. 2024 Jan 8:14:1232416.
doi: 10.3389/fphys.2023.1232416. eCollection 2023.

Enlarged colony housing promotes linear progression of subchondral bone remodeling in joint instability rat models

Affiliations

Enlarged colony housing promotes linear progression of subchondral bone remodeling in joint instability rat models

Stephanie Menges et al. Front Physiol. .

Abstract

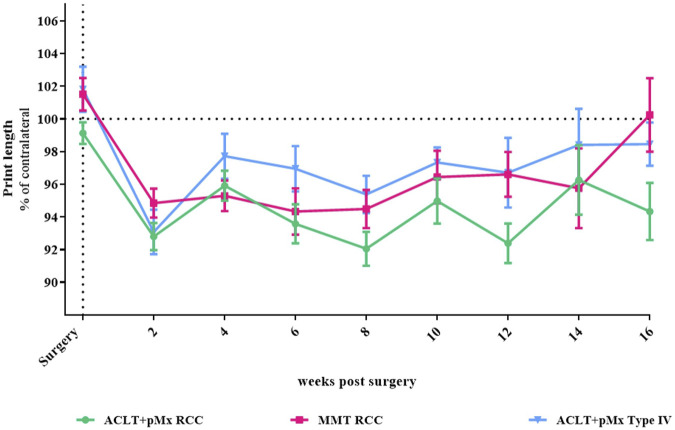
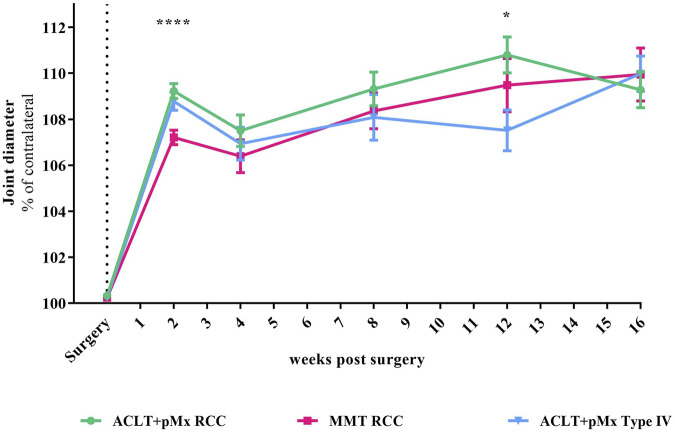
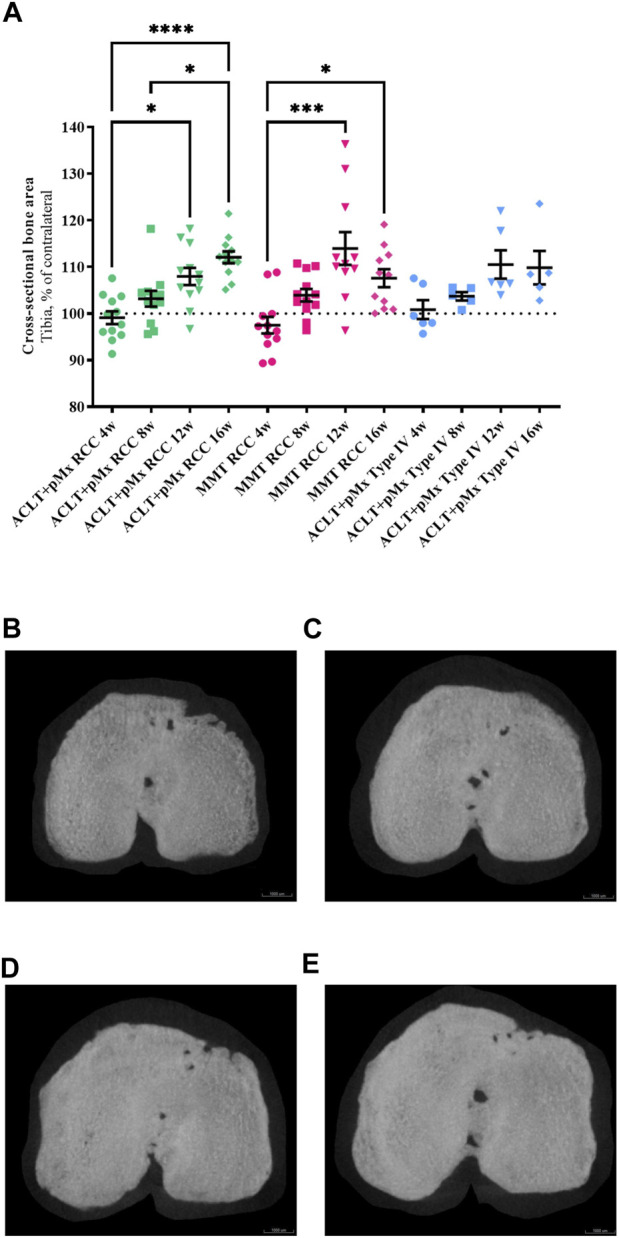
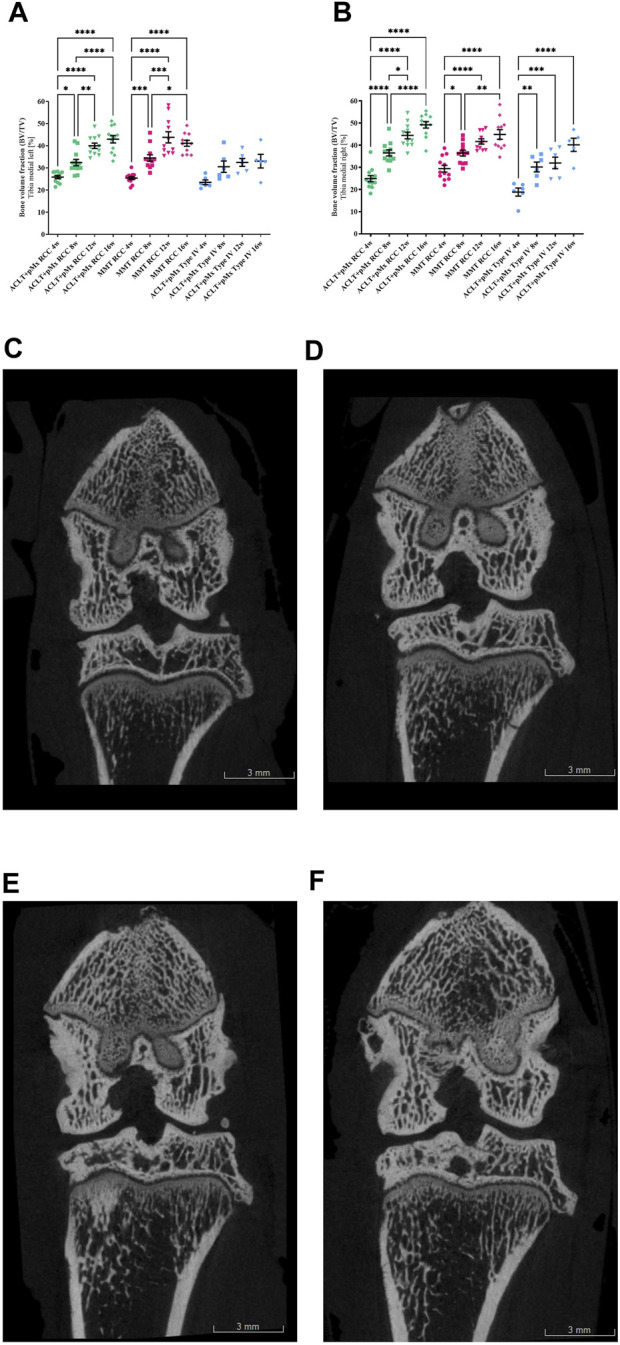
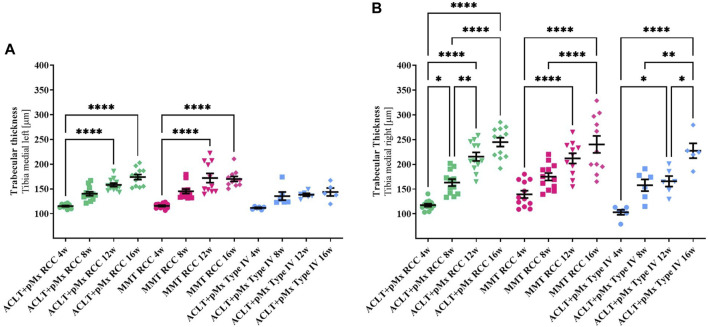
Objective: Osteoarthritis (OA) is a disease with high prevalence and an unmet medical need for disease modifying treatments. In rat models, OA-like subchondral bone and cartilage changes can be induced by instability surgery with different severity levels. Factors which determine structural changes additionally comprise the study duration and activity-impacted joint loading. Methods: A medial meniscal tear (MMT) or anterior cruciate ligament transection with partial meniscectomy (ACLT+pMx) was induced unilaterally in rats housed in a rat colony cage (RCC), allowing high activity levels including jumping and stair climbing. In parallel, ACLT+pMx rats were housed in Type IV cages. The time course of OA-related changes was investigated at 4, 8, 12, and 16 weeks after surgery by micro-CT, gait analysis and joint diameter measurements. Results: Gait disturbance was observed after 2 weeks and to a similar extend in all models. The increase in ipsilateral joint diameters peaked after 2 weeks and were more pronounced after ACLT+pMx compared to MMT-surgery, but independent of housing. Micro-CT analysis revealed that increases in osseous tibial width were most distinct after ACLT+pMx in RCC and progressed continuously until week sixteen. In contrast, osseous tibial width of ipsilateral joints in MMT RCC and ACLT+pMx Type IV groups did not increase further after week twelve. In contralateral joints, this parameter was not affected, regardless of the model or caging. However, a significant increase in bone volume fraction and trabecular thickness was observed over time in the femur and tibia of both ipsilateral and contralateral knees. Here, the medial tibial compartment of the operated joint was most affected and linear changes were most pronounced in the ACLT+pMx RCC group. Conclusion: Increased movement of animals in colony cages leads to robust structural changes in subchondral bone after surgically induced joint instability over time, while in regular Type IV housing maximal changes are reached in week twelve. The new insights into the differentiation of the models, particularly with respect to the linear progression of bone changes in ACLT+pMx in the RCC, may be useful for the design of chronic OA-studies within a longer lifespan and therefore supporting the development of novel therapies.

Keywords: colony housing; joint instability; osteoarthritis; rats; subchondral bone.


Conflict of interest statement

The authors SM and CB are employees of Merck Healthcare KGaA. KK-D is employed by Merck KGaA. This work was sponsored by Merck Healthcare KGaA, Darmstadt, Germany (CrossRef funder ID: 10.13039/100009945). Representatives of the sponsor were involved in the study design, collection, analysis, and interpretation of data, in the writing of the manuscript, and in the decision to submit the manuscript for publication.

Figures

FIGURE 1
FIGURE 1
Time course of gait disturbance via CatWalk-analysis; n = 5–48; mean ± SEM; dotted horizontal line indicates 100%; two outliers via ROUT method detected and excluded from analysis (ACLT+pMx RCC week 6: 85.26%; ACLT+pMx RCC week 8: 124.46); additional data excluded due to internal CatWalk quality requirements for paw print analysis (n = 8); data did not pass Shaprio-Wilk test for normal distribution; no significant differences in mixed-effects model analysis with Šídák’s multiple comparisons test.
FIGURE 2
FIGURE 2
Time course of joint diameter; n = 5-48; mean ± SEM; no outliers via ROUT method detected; data did not pass Shaprio-Wilk test for normal distribution; results of mixed-effects model analysis with Šídák’s multiple comparisons test: week 2 ****p < 0.0001 ACLT+pMx RCC vs. MMT RCC; week 12 *p < 0.05 ACLT+pMx RCC vs. ACLT+pMx Type IV.
FIGURE 3
FIGURE 3
(A) Analysis of the cross-sectional bone area of the ipsilateral tibia in comparison to the contralateral tibia; n = 11/12 (RCC), n = 5/6 (Type IV); mean ± SEM; dotted horizontal line indicates 100%; one outlier via ROUT method detected and excluded (ACLT+pMx Type IV 8w: 121.54%); data did not pass Shaprio-Wilk test for normal distribution; results of Kruskal–Wallis test with Dunn’s multiple comparison test: *p < 0.05 ACLT+pMx RCC 4w vs. ACLT+pMx RCC 12w; *p < 0.05 ACLT+pMx RCC 8w vs. ACLT+pMx RCC 16w; *p < 0.05 MMT RCC 4w vs. MMT RCC 16w; ***p < 0.001 MMT RCC 4w vs. MMT RCC 12w; ****p < 0.0001 ACLT+pMx RCC 4w vs. ACLT+pMx RCC 16w. (B) Micro-CT image of the cross-sectional bone area from the ipsilateral tibia of animal no. 80, ACLT+pMx RCC 4w group. Scale bar = 1000 µm. (C) Micro-CT image of the cross-sectional bone area from the ipsilateral tibia of animal no. 36, ACLT+pMx RCC 8w group. Scale bar = 1000 µm. (D) Micro-CT image of the cross-sectional bone area from the ipsilateral tibia of animal no. 22, ACLT+pMx RCC 12w group. Scale bar = 1000 µm. (E) Micro-CT image of the cross-sectional bone area from the ipsilateral tibia of animal no. 32, ACLT+pMx RCC 16w group. Scale bar = 1000 µm.
FIGURE 4
FIGURE 4
(A) Bone volume fraction analysis (BV/TV) of the left medial Tibia; n = 11/12 (RCC), n = 5/6 (Type IV); mean ± SEM; no outliers via ROUT method detected; data passed Shaprio-Wilk test for normal distribution; results of 1way ANOVA with Šídák’s multiple comparisons test: *p < 0.05 ACLT+pMx RCC 4w vs. ACLT+pMx RCC 8w; *p < 0.05 MMT RCC 8w vs. MMT RCC 16w; **p < 0.01 ACLT+pMx RCC 8w vs. ACLT+pMx RCC 12w; **p < 0.01 ACLT+pMx RCC 16w vs. ACLT+pMx Type IV 16w; ***p < 0.001 MMT RCC 4w vs. MMT RCC 8w; ***p < 0.001 MMT RCC 8w vs. MMT RCC 12w; ****p < 0.0001 ACLT+pMx RCC 4w vs. ACLT+pMx RCC 12w; ****p < 0.0001 ACLT+pMx RCC 4w vs. ACLT+pMx RCC 16w; ****p < 0.0001 ACLT+pMx RCC 8w vs. ACLT+pMx RCC 16w; ****p < 0.0001 MMT RCC 4w vs. MMT RCC 12w; ****p < 0.0001 MMT RCC 4w vs. MMT RCC 16w. (B) Bone volume fraction analysis (BV/TV) of the right medial Tibia; n = 11/12 (RCC), n = 5/6 (Type IV); mean ± SEM; no outliers via ROUT method detected; data passed Shaprio-Wilk test for normal distribution; results of 1way ANOVA with Šídák’s multiple comparisons test: *p < 0.05 ACLT+pMx RCC 8w vs. ACLT+pMx RCC 12w; *p < 0.05 MMT RCC 4w vs. MMT RCC 8w; *p < 0.05 ACLT+pMx RCC 16w vs. ACLT+pMx Type IV 16w; **p < 0.01 MMT RCC 8w vs. MMT RCC 16w; **p < 0.01 ACLT+pMx Type IV 4w vs. ACLT+pMx Type IV 8w; ***p < 0.001 ACLT+pMx Type IV 4w vs. ACLT+pMx Type IV 12w; ***p < 0.001 ACLT+pMx RCC 12w vs. ACLT+pMx Type IV 12w; ****p < 0.0001 ACLT+pMx RCC 4w vs. ACLT+pMx RCC 8w; ****p < 0.0001 ACLT+pMx RCC 4w vs. ACLT+pMx RCC 12w; ****p < 0.0001 ACLT+pMx RCC 4w vs. ACLT+pMx RCC 16w; ****p < 0.0001 ACLT+pMx RCC 8w vs. ACLT+pMx RCC 16w; ****p < 0.0001 MMT RCC 4w vs. MMT RCC 12w; ****p < 0.0001 MMT RCC 4w vs. MMT RCC 16w; ****p < 0.0001 ACLT+pMx Type IV 4w vs. ACLT+pMx Type IV 16w. (C) Coronal plane image of a micro-CT-scan of the ipsilateral knee joint of animal no. 80, ACLT+pMx RCC 4w group. Scale bar = 3 mm. (D) Coronal plane image of a micro-CT-scan of the ipsilateral knee joint of animal no. 36, ACLT+pMx RCC 8w group. Scale bar = 3 mm. (E) Coronal plane image of a micro-CT-scan of the ipsilateral knee joint of animal no. 22, ACLT+pMx RCC 12w group. Scale bar = 3 mm. (F) Coronal plane image of micro-CT-scan of the ipsilateral knee joint of animal no. 32, ACLT+pMx RCC 16w group. Scale bar = 3 mm.
FIGURE 5
FIGURE 5
(A) Trabecular thickness (Tb.Th) of the left medial Tibia; n = 11/12 (RCC), n = 5/6 (Type IV); mean ± SEM; no outliers via ROUT method detected; data did not pass Shaprio-Wilk test for normal distribution; results of Kruskal–Wallis test with Dunn’s multiple comparison test: ****p < 0.0001 ACLT+pMx RCC 4w vs. ACLT+pMx RCC 12w; ****p < 0.0001 ACLT+pMx RCC 4w vs. ACLT+pMx RCC 16w; ****p < 0.0001 MMT RCC 4w vs. MMT RCC 12w; ****p < 0.0001 MMT RCC 4w vs. MMT RCC 16w. (B) Trabecular thickness (Tb.Th) of the right medial Tibia; n = 11/12 (RCC), n = 5/6 (Type IV); mean ± SEM; no outliers via ROUT method detected; data passed Shaprio-Wilk test for normal distribution; results of 1way ANOVA with Šídák’s multiple comparisons test: *p < 0.05 ACLT+pMx RCC 4w vs. ACLT+pMx RCC 8w; *p < 0.05 ACLT+pMx Type IV 4w vs. ACLT+pMx Type IV 12w; *p < 0.05 ACLT+pMx Type IV 12w vs. ACLT+pMx Type IV 16w; *p < 0.05 ACLT+pMx RCC 12w vs. ACLT+pMx Type IV 12w; **p < 0.01 ACLT+pMx RCC 8w vs. ACLT+pMx RCC 12w; **p < 0.01 ACLT+pMx Type IV 8w vs. ACLT+pMx Type IV 16w; ****p < 0.0001 ACLT+pMx RCC 4w vs. ACLT+pMx RCC 12w; ****p < 0.0001 ACLT+pMx RCC 4w vs. ACLT+pMx RCC 16w; ****p < 0.0001 ACLT+pMx RCC 8w vs. ACLT+pMx RCC 16w; ****p < 0.0001 MMT RCC 4w vs. MMT RCC 12w; ****p < 0.0001 MMT RCC 4w vs. MMT RCC 16w; ****p < 0.0001 MMT RCC 8w vs. MMT RCC 16w; ****p < 0.0001 ACLT+pMx Type IV 4w vs. ACLT+pMx Type IV 16w.

Similar articles

References

    1. Abbud Lozoya K. A., Kouri Flores J. B. (2000). A novel rat osteoarthrosis model to assess apoptosis and matrix degradation. Pathol. Res. Pract. 196, 729–745. 10.1016/S0344-0338(00)80105-3 - DOI - PubMed
    1. Aizah N., Chong P. P., Kamarul T. (2021). Early alterations of subchondral bone in the rat anterior cruciate ligament transection model of osteoarthritis. Cartilage 13, 1322S–1333S. 10.1177/1947603519878479 - DOI - PMC - PubMed
    1. Andriacchi T. P., Mündermann A. (2006). The role of ambulatory mechanics in the initiation and progression of knee osteoarthritis. Curr. Opin. Rheumatol. 18, 514–518. 10.1097/01.BOR.0000240365.16842.4E - DOI - PubMed
    1. Appleton C. T. G., McErlain D. D., Pitelka V., Schwartz N., Bernier S. M., Henry J. L., et al. (2007). Forced mobilization accelerates pathogenesis: characterization of a preclinical surgical model of osteoarthritis. Arthritis Res. Ther. 91 (9), R13–R15. 10.1186/AR2120 - DOI - PMC - PubMed
    1. Bendele A. M. (2001). Animal models of osteoarthritis. J. Musculoskel Neuron Interact. 1, 363–376. - PubMed

LinkOut - more resources