

Identification of mitophagy-related biomarkers in human osteoporosis based on a machine learning model
- PMID: 38260098
- PMCID: PMC10800828
- DOI: 10.3389/fphys.2023.1289976
Identification of mitophagy-related biomarkers in human osteoporosis based on a machine learning model
Abstract
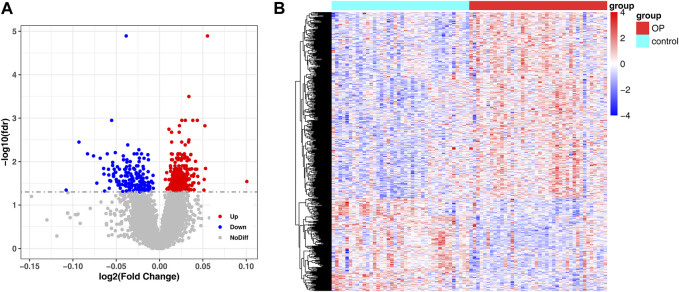
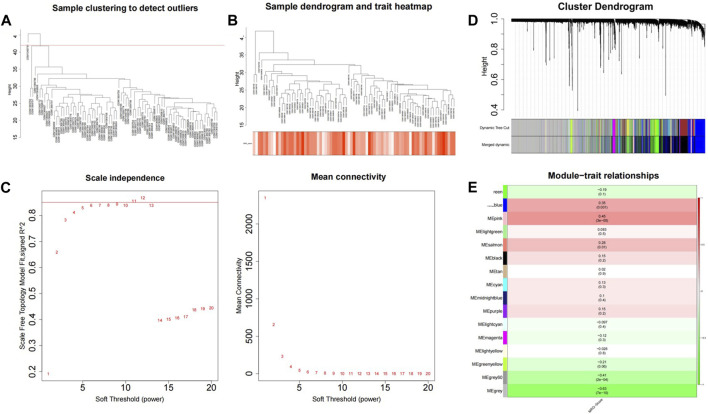
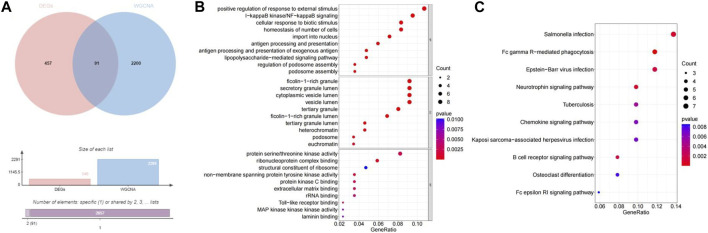
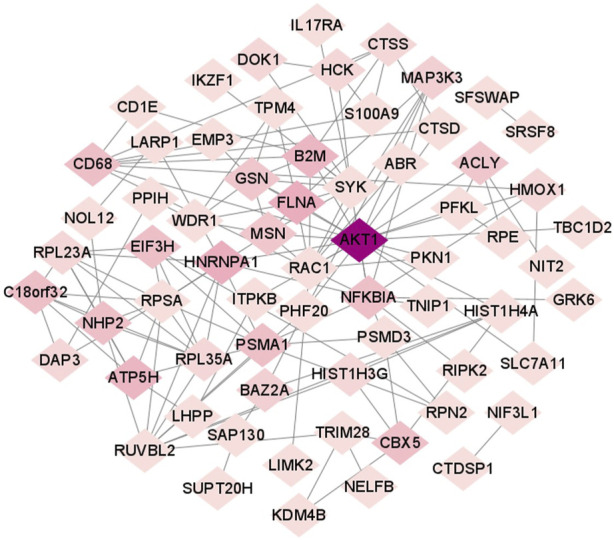
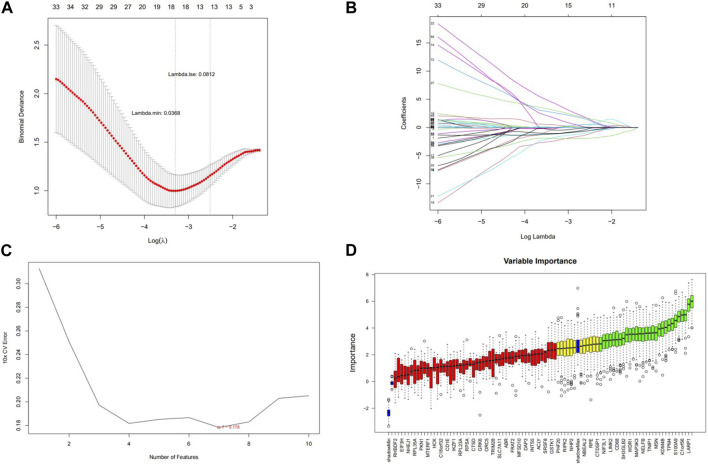
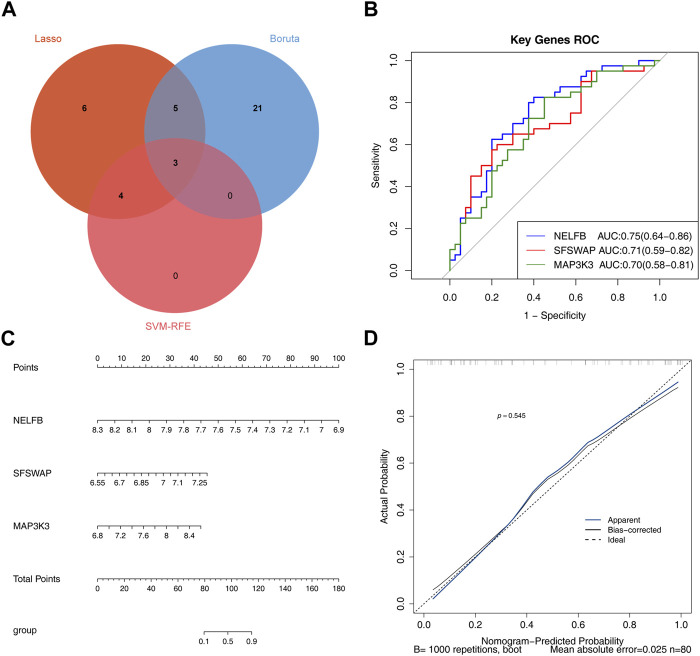
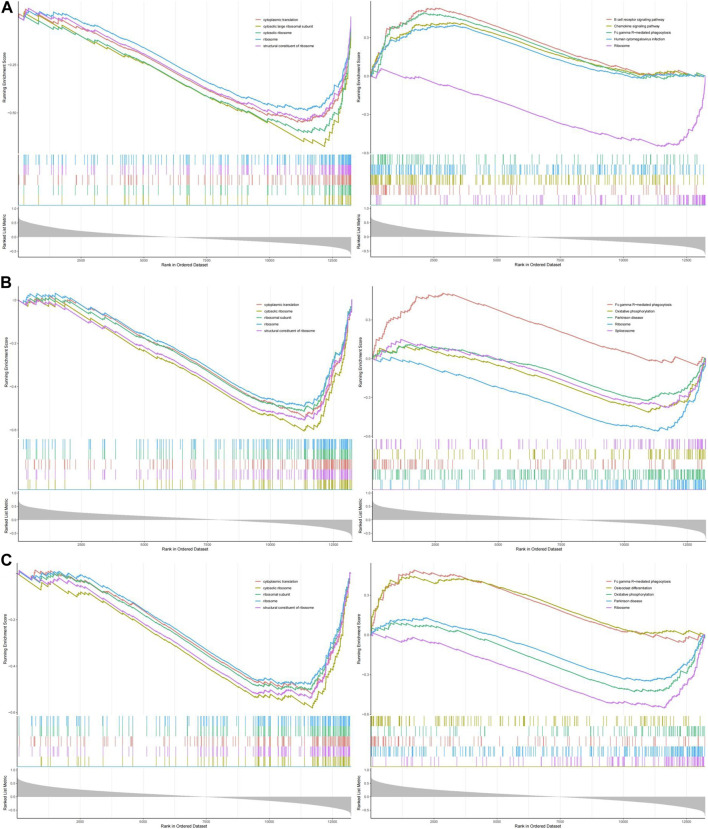
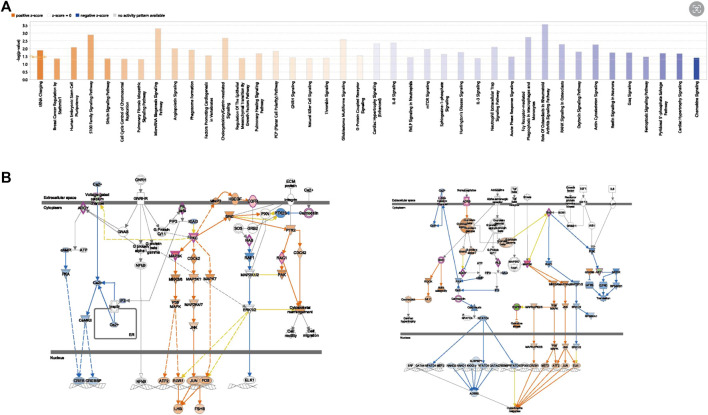
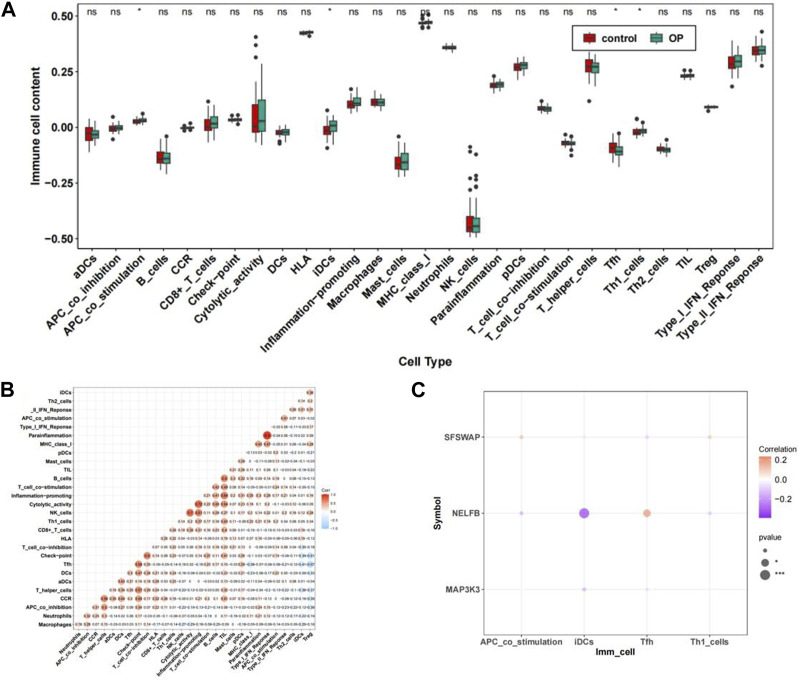
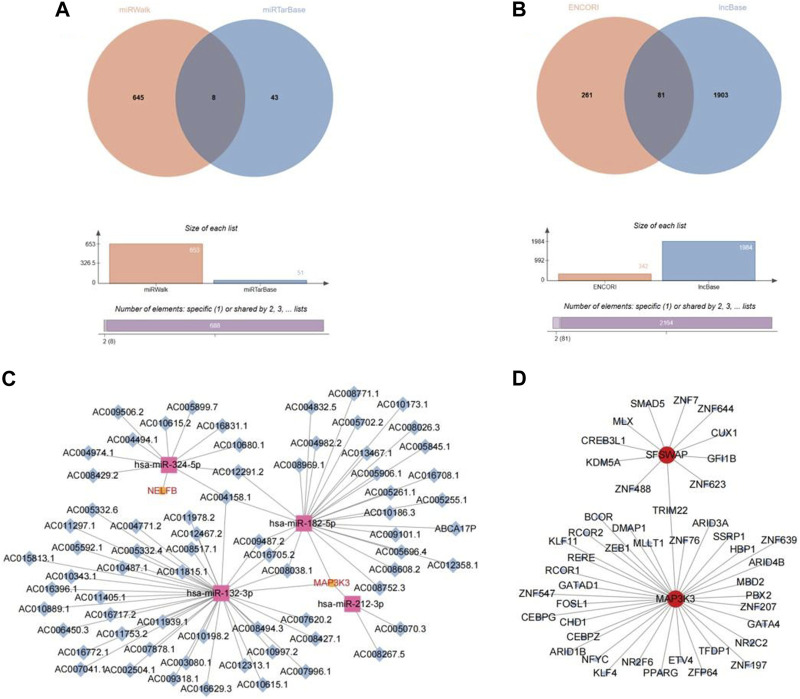
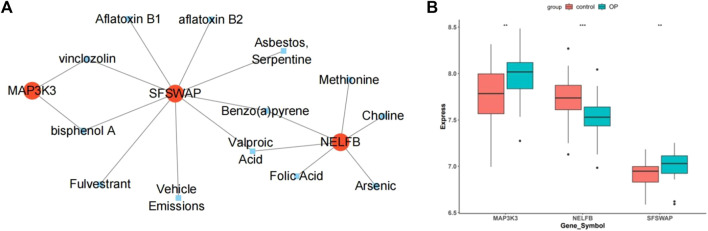
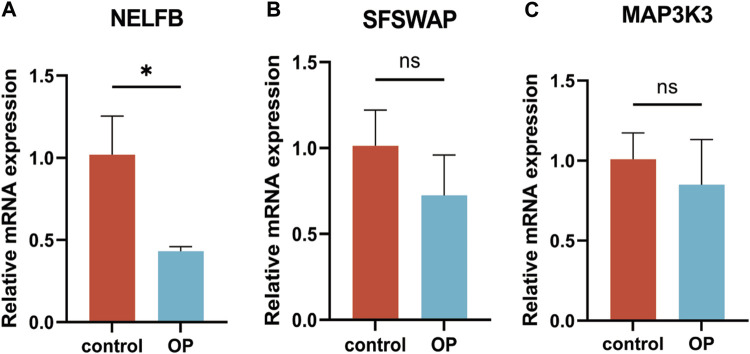
Background: Osteoporosis (OP) is a chronic bone metabolic disease and a serious global public health problem. Several studies have shown that mitophagy plays an important role in bone metabolism disorders; however, its role in osteoporosis remains unclear. Methods: The Gene Expression Omnibus (GEO) database was used to download GSE56815, a dataset containing low and high BMD, and differentially expressed genes (DEGs) were analyzed. Mitochondrial autophagy-related genes (MRG) were downloaded from the existing literature, and highly correlated MRG were screened by bioinformatics methods. The results from both were taken as differentially expressed (DE)-MRG, and Gene Ontology (GO) analysis and Kyoto Encyclopedia of Genes and Genomes (KEGG) enrichment analysis were performed. Protein-protein interaction network (PPI) analysis, support vector machine recursive feature elimination (SVM-RFE), and Boruta method were used to identify DE-MRG. A receiver operating characteristic curve (ROC) was drawn, a nomogram model was constructed to determine its diagnostic value, and a variety of bioinformatics methods were used to verify the relationship between these related genes and OP, including GO and KEGG analysis, IP pathway analysis, and single-sample Gene Set Enrichment Analysis (ssGSEA). In addition, a hub gene-related network was constructed and potential drugs for the treatment of OP were predicted. Finally, the specific genes were verified by real-time quantitative polymerase chain reaction (RT-qPCR). Results: In total, 548 DEGs were identified in the GSE56815 dataset. The weighted gene co-expression network analysis(WGCNA) identified 2291 key module genes, and 91 DE-MRG were obtained by combining the two. The PPI network revealed that the target gene for AKT1 interacted with most proteins. Three MRG (NELFB, SFSWAP, and MAP3K3) were identified as hub genes, with areas under the curve (AUC) 0.75, 0.71, and 0.70, respectively. The nomogram model has high diagnostic value. GO and KEGG analysis showed that ribosome pathway and cellular ribosome pathway may be the pathways regulating the progression of OP. IPA showed that MAP3K3 was associated with six pathways, including GNRH Signaling. The ssGSEA indicated that NELFB was highly correlated with iDCs (cor = -0.390, p < 0.001). The regulatory network showed a complex relationship between miRNA, transcription factor(TF) and hub genes. In addition, 4 drugs such as vinclozolin were predicted to be potential therapeutic drugs for OP. In RT-qPCR verification, the hub gene NELFB was consistent with the results of bioinformatics analysis. Conclusion: Mitophagy plays an important role in the development of osteoporosis. The identification of three mitophagy-related genes may contribute to the early diagnosis, mechanism research and treatment of OP.
Keywords: bioinformatics; biomarker; differentially expressed genes (DEGs); mitophagy; osteoporosis; protein-protein interaction (PPI).
Copyright © 2024 Su, Yu, Li, Lu, Ren, Xu, Yang, Zhang, Ma and Li.
Conflict of interest statement
The authors declare that the research was conducted in the absence of any commercial or financial relationships that could be construed as a potential conflict of interest.
Figures

Similar articles
-
Identification of novel mitophagy-related biomarkers for Kawasaki disease by integrated bioinformatics and machine-learning algorithms.Transl Pediatr. 2024 Aug 31;13(8):1439-1456. doi: 10.21037/tp-24-230. Epub 2024 Aug 26. Transl Pediatr. 2024. PMID: 39263286 Free PMC article.
-
Identification of a Potential MiRNA-mRNA Regulatory Network for Osteoporosis by Using Bioinformatics Methods: A Retrospective Study Based on the Gene Expression Omnibus Database.Front Endocrinol (Lausanne). 2022 May 10;13:844218. doi: 10.3389/fendo.2022.844218. eCollection 2022. Front Endocrinol (Lausanne). 2022. PMID: 35620387 Free PMC article.
-
Comprehensive analysis of the m6A-related molecular patterns and diagnostic biomarkers in osteoporosis.Front Endocrinol (Lausanne). 2022 Aug 10;13:957742. doi: 10.3389/fendo.2022.957742. eCollection 2022. Front Endocrinol (Lausanne). 2022. PMID: 36034449 Free PMC article.
-
JUN and ATF3 in Gout: Ferroptosis-related potential diagnostic biomarkers.Heliyon. 2024 Oct 30;10(22):e39957. doi: 10.1016/j.heliyon.2024.e39957. eCollection 2024 Nov 30. Heliyon. 2024. PMID: 39619595 Free PMC article. Review.
-
Identification of oxidative stress-related diagnostic markers and immune infiltration features for idiopathic pulmonary fibrosis by bibliometrics and bioinformatics.Front Med (Lausanne). 2024 Aug 6;11:1356825. doi: 10.3389/fmed.2024.1356825. eCollection 2024. Front Med (Lausanne). 2024. PMID: 39165378 Free PMC article. Review.
Cited by
-
Development and Validation of Diagnostic Models for Transcriptomic Signature Genes for Multiple Tissues in Osteoarthritis.J Inflamm Res. 2024 Jul 31;17:5113-5127. doi: 10.2147/JIR.S472118. eCollection 2024. J Inflamm Res. 2024. PMID: 39099665 Free PMC article.
-
Comprehensive Analysis of the Role of Metabolic Features in Osteoporosis: A Multi-Omics Analysis.Int J Gen Med. 2025 May 26;18:2727-2739. doi: 10.2147/IJGM.S515717. eCollection 2025. Int J Gen Med. 2025. PMID: 40453197 Free PMC article.
-
Metabolic score for insulin resistance (METS-IR) predicts all-cause and cardiovascular mortality in the general population: evidence from NHANES 2001-2018.Cardiovasc Diabetol. 2024 Jul 10;23(1):243. doi: 10.1186/s12933-024-02334-8. Cardiovasc Diabetol. 2024. PMID: 38987779 Free PMC article.
References
LinkOut - more resources
Full Text Sources
Miscellaneous