[Preprint]. 2024 Jan 5:rs.3.rs-3463557.
doi: 10.21203/rs.3.rs-3463557/v1.

Skeletal muscle reprogramming enhances reinnervation after peripheral nerve injury

Affiliations

Skeletal muscle reprogramming enhances reinnervation after peripheral nerve injury

Pihu Mehrotra et al. Res Sq. .

Update in

Abstract

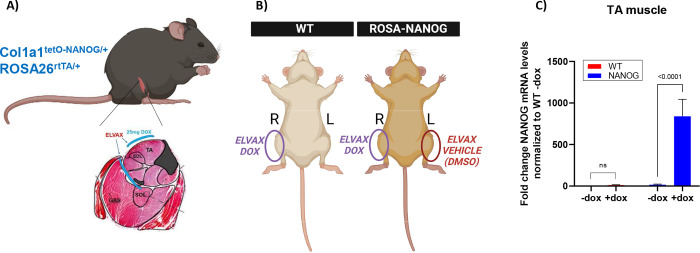
Peripheral Nerve Injuries (PNI) affect more than 20 million Americans and severely impact quality of life by causing long-term disability. The onset of PNI is characterized by nerve degeneration distal to the nerve injury resulting in long periods of skeletal muscle denervation. During this period, muscle fibers atrophy and frequently become incapable of "accepting" innervation because of the slow speed of axon regeneration post injury. We hypothesize that reprogramming the skeletal muscle to an embryonic-like state may preserve its reinnervation capability following PNI. To this end, we generated a mouse model in which NANOG, a pluripotency-associated transcription factor can be expressed locally upon delivery of doxycycline (Dox) in a polymeric vehicle. NANOG expression in the muscle upregulated the percentage of Pax7+ nuclei and expression of eMYHC along with other genes that are involved in muscle development. In a sciatic nerve transection model, NANOG expression led to upregulation of key genes associated with myogenesis, neurogenesis and neuromuscular junction (NMJ) formation, and downregulation of key muscle atrophy genes. Further, NANOG mice demonstrated extensive overlap between synaptic vesicles and NMJ acetylcholine receptors (AChRs) indicating restored innervation. Indeed, NANOG mice showed greater improvement in motor function as compared to wild-type (WT) animals, as evidenced by improved toe-spread reflex, EMG responses and isometric force production. In conclusion, we demonstrate that reprogramming the muscle can be an effective strategy to improve reinnervation and functional outcomes after PNI.


Figures

Figure 1:
Figure 1:. Mouse model for dox-inducible NANOG expression in skeletal muscle.
(A) Localized NANOG expression in the muscle was achieved by subcutaneous implantation of the slow-release polymer Elvax (shown in blue) near the TA, EDL, Soleus and Gastrocnemius muscles. Schematic of muscle adapted from [107]. (B) Schematic of surgical implantation of Elvax in naïve uninjured WT and NANOG mice; the right leg of both received Elvax-DOX, while the left leg of NANOG mice received Elvax-DMSO (vehicle), and left leg of WT mice did not receive Elvax. (C) Fold change in relative mRNA levels of NANOG from isolated TA muscle 4 days after Elvax implantation in naïve uninjured WT and NANOG animals (normalized to WT; no Elvax).
Figure 2:
Figure 2:. NANOG expression de-differentiates skeletal muscle to a pro-regenerative state.
The left leg of naïve uninjured mice was implanted with Elvax-DOX for two weeks; the right leg was implanted with Elvax-DMSO and served as control for the Elvax placement. One week after removal of Elvax, the TA muscle was harvested for evaluation. (A) Immunostaining of TA muscle sections for eMYHC (red), Laminin (green) and DAPI (Blue). Scale bar- 100 μm, insets are higher magnification images with scale bar 50 μm. (B) Quantification of fiber area of TA muscle in mice with Elvax-DOX vs. Elvax-DMSO. (C) Quantification of small muscle fibers (less than 100 μm2) expressing eMYHC. (D) Percentage of centrally nucleated regenerative muscle fibers throughout the TA muscle. (E) Immunostaining for Pax7 (red), Laminin (green) and DAPI (Blue). Fields of view depicted representative images from the center of the muscle, and section adjacent to Elvax placement. Scale bar- 20μm. (F) Quantification for percentage of Pax7 positive nuclei throughout the TA muscle.
Figure 3:
Figure 3:. NANOG expression in skeletal muscle in a sciatic nerve injury model upregulates genes associated with skeletal muscle dedifferentiation, neurogenesis and nerve development.
(A) Schematic depicting experimental procedure, timeline and experiments performed. (B) Top 42 upregulated genes in TA muscle on side of transection normalized to non-transected limb in WT and NANOG animals. Log2 fold change values are depicted within each cell. Genes of interest with respect to muscle or nerve development are highlighted by arrows. (C) Plot depicting log 2-fold change in selected genes from panel B associated with myoblast fusion (MYMK and MYMX), NMJ formation (NRG2 and CHRNG), neurogenesis (GDF15, NRCAM and Sox11) and muscle hypertrophy (GDF5) after transection, normalized to expression in non-transected limb of the same animal in WT and NANOG mice. (D) RT-PCR expression data from TA muscle for genes in Panel C on side of transection normalized to non-transected limb in WT and NANOG animals. (E) Heatmaps showing differentially expressed genes associated with gene ontology term Axon Guidance and (F) Skeletal System Morphogenesis. Only genes with statistically significant differences (padj<0.05) between WT and NANOG samples have been depicted. Genes of particular interest are highlighted within green boxes.
Figure 4:
Figure 4:. NANOG upregulates ECM organization and Nerve Regeneration pathways and downregulates atrophy-associated pathways 5 weeks after nerve transection.
(A) Top 10 most highly enriched GO cellular components, molecular functions and biological processes. ECM: Extracellular Matrix, RTK: Receptor Tyrosine Kinase. (B) Enrichment plots from Reactome database depicting ECM synthesis and signaling associated pathways; ECM organization, Collagen formation, Integrin cell surface interactions and ECM proteoglycans. (C) Enrichment plots from KEGG and Reactome databases depicting nerve development pathways; Axon guidance, Gap junction, Neuroactive ligand receptor interaction and NCAM signaling for neurite outgrowth. (D) Top 10 most highly downregulated GO cellular components, molecular functions and biological processes. (E) Enrichment plots from KEGG and Reactome databases depicting Ubiquitin mediated proteolysis and Autophagy. NES: Normalized Enrichment Score.
Figure 5:
Figure 5:. NANOG improves overlap between neuronal synaptic vesicles and muscle AChRs following transection.
(A) Confocal images of NMJs 5 and 16 weeks after transection using whole mount immunocytochemistry. Presynaptic axons and synaptic vesicles (green) and postsynaptic AChRs (Red). Regions of overlap between pre- and post-synaptic regions are yellow. WT mice frequently demonstrate poor overlap between synaptic vesicles and AChRs (arrows). Multiple innervations were also seen in WT mice (asterisks). NANOG mice showed pre- vs. post-synaptic overlap similar to NMJs from control non-transected limbs. Scale bar = 20μm. Quantification for percentage of colocalization between synaptic vesicles and AChRs at (B) 5 weeks and (C) at 16 weeks. (D) Confocal images of NMJs 5 and 16 weeks after transection in muscle cross-sections. Presynaptic axons and synaptic vesicles (green) and postsynaptic AChRs (red). Regions of overlap between pre- and post-synaptic regions are yellow. WT mice frequently demonstrate poor overlap between synaptic vesicles and AChRs (arrows). NANOG mice showed overlap similar to NMJs from control non-transected limbs. Scale bar = 20μm. Quantification for percentage of colocalization between synaptic vesicles and AChRs at (E) 5 weeks and (F) 16 weeks after nerve injury.
Figure 6:
Figure 6:. NANOG mice show enhanced functional recovery after nerve transection.
(A) Depiction of mouse toe spread reflex and assigned scores. Scores range from 0 (no spread) to 2 (full spread of all toes). (B) Quantification of toe-spread reflex from Week 0 to Week 16 after nerve transection. (C) Setup for needle EMG recordings. The mouse was anesthetized and stimulating electrodes were placed on either side of the sciatic nerve above the site of transection. Recording electrodes were placed mid-belly in the TA muscle and around the ankle for differential recordings. (D) A typical EMG waveform recorded in non-transected control mice. The waveform includes a stimulation artifact followed by an CMAP excitation M-wave. (E) Representative waveforms from WT and NANOG transected limbs at 5 weeks and 16 weeks after injury. The start of M-wave is marked by red arrows. EMG recordings were completed in both the transected side and non-transected control limb. EMG for each animal was normalized to the control limb. (F) Schematic depicting the amplitude of the CMAP M-wave, calculated from the positive peak to the negative peak. (G) Quantification of EMG amplitude at 2, 4, 5, 8, 10, and 16 weeks after sciatic nerve transection in WT and NANOG mice. (H) EMG peak to peak at 5 weeks and (I) 16 weeks post nerve injury. (J) Schematic depicting the area of an M-wave, calculated as total area of the positive and negative CMAP M-wave curves. (K) Quantification of EMG area from the start of nerve transection at 2, 4, 5, 8, 10 and16 weeks after sciatic nerve transection in WT and NANOG mice. (L) CMAP M-wave area at 5 weeks and (M) 16 weeks post nerve injury. (N) Schematic of latency time, calculated as the time taken from the trigger of stimulus to the onset of M-wave depolarization response. (O) Quantification of EMG latency time at 2, 4, 5, 8, 10 and 16 weeks after sciatic nerve transection in WT and NANOG mice. (P) Latency time at 5 weeks and (Q) 16 weeks post nerve injury; n = 11–12 from 0–5 weeks and 5–6 from 8–16 weeks for control and NANOG, respectively. (R) Setup for muscle force measurement in live mice using the Aurora force transducer. The mouse was anesthetized, and its foot was secured to the footplate. Electrodes were placed subcutaneously over the TA muscle for stimulation, and the aggregate torque produced was recorded and quantified as force. (S) Maximum force recorded at stimulation frequency of 150 Hz from both transected side and non-transected control limb. Force in the transected side was normalized to the average force of the control non-transected limb for each condition; n = 5 for both WT and NANOG animals.

References

    1. Taylor C.A., et al., The incidence of peripheral nerve injury in extremity trauma. American journal of physical medicine & rehabilitation, 2008. 87(5): p. 381–385. - PubMed
    1. Rivera J.C., Glebus G., and Cho M., Disability following combat-sustained nerve injury of the upper limb. The bone & joint journal, 2014. 96(2): p. 254–258. - PubMed
    1. Bergmeister K.D., et al., Acute and long-term costs of 268 peripheral nerve injuries in the upper extremity. PloS one, 2020. 15(4): p. e0229530. - PMC - PubMed
    1. Grinsell D. and Keating C., Peripheral nerve reconstruction after injury: a review of clinical and experimental therapies. BioMed research international, 2014. 2014. - PMC - PubMed
    1. Padovano W.M., et al., Incidence of nerve injury after extremity trauma in the United States. Hand, 2022. 17(4): p. 615–623. - PMC - PubMed

Publication types