[Preprint]. 2024 Jan 9:rs.3.rs-3504130.
doi: 10.21203/rs.3.rs-3504130/v1.

Exploring Cellular Gateways: Unraveling the Secrets of Disordered Proteins within Live Nuclear Pores

Affiliations

Exploring Cellular Gateways: Unraveling the Secrets of Disordered Proteins within Live Nuclear Pores

Wenlan Yu et al. Res Sq. .

Abstract

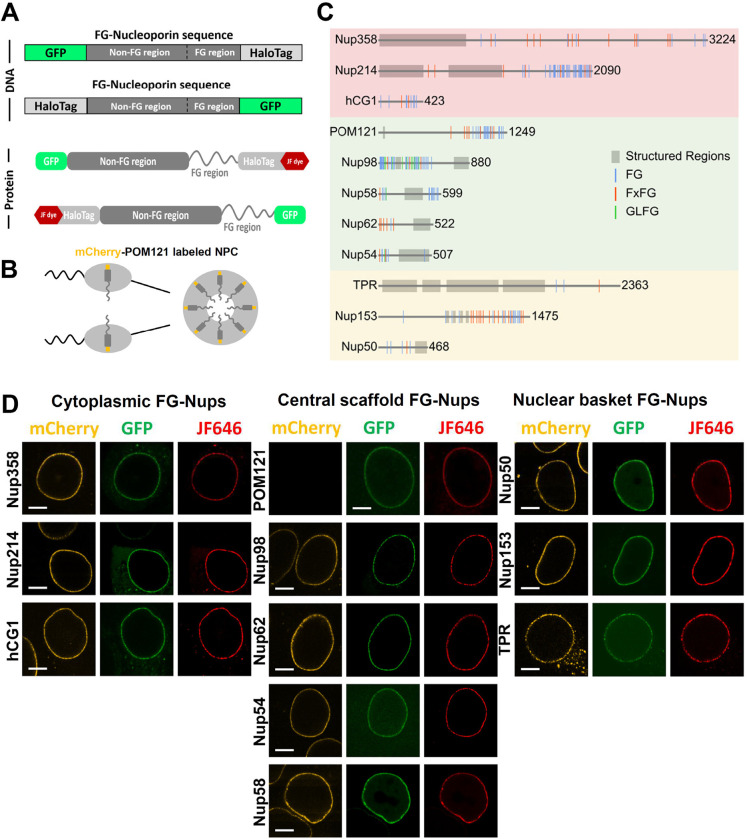
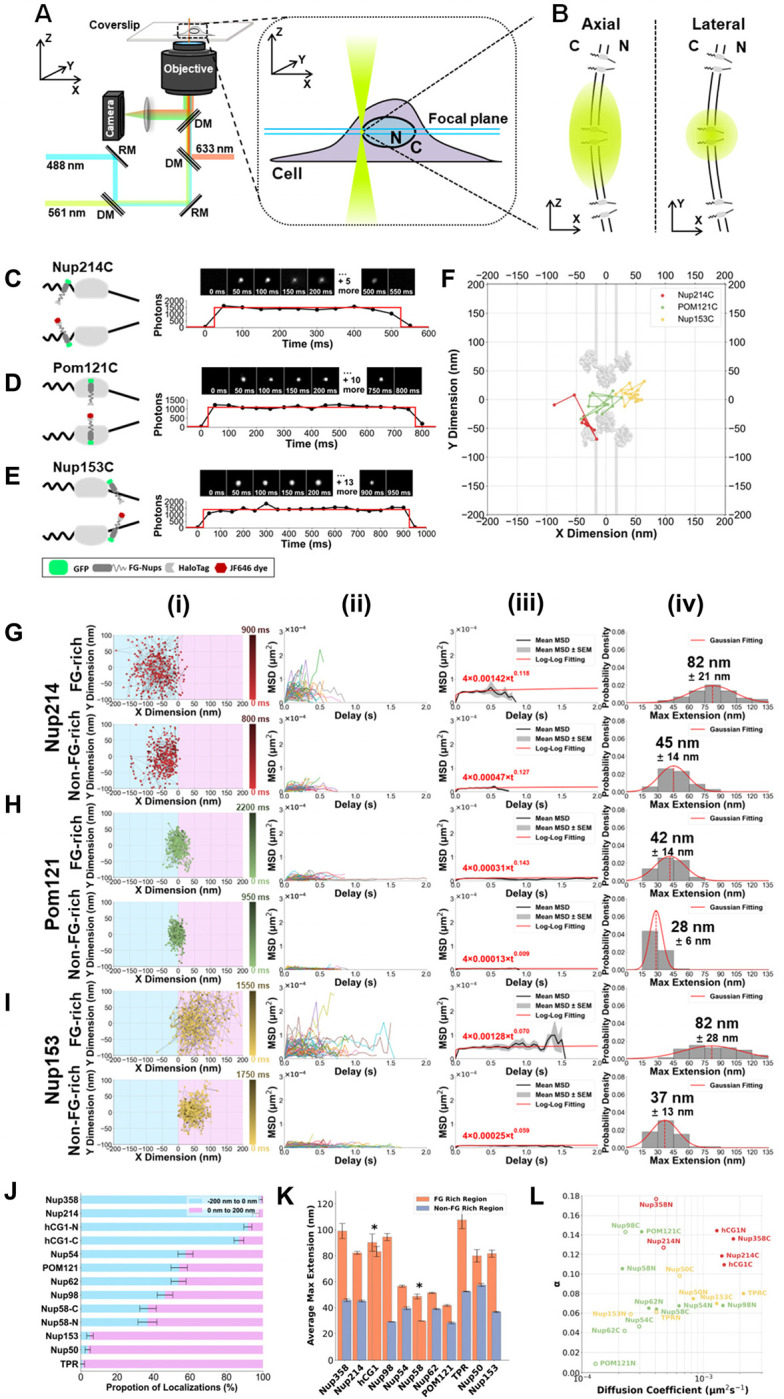
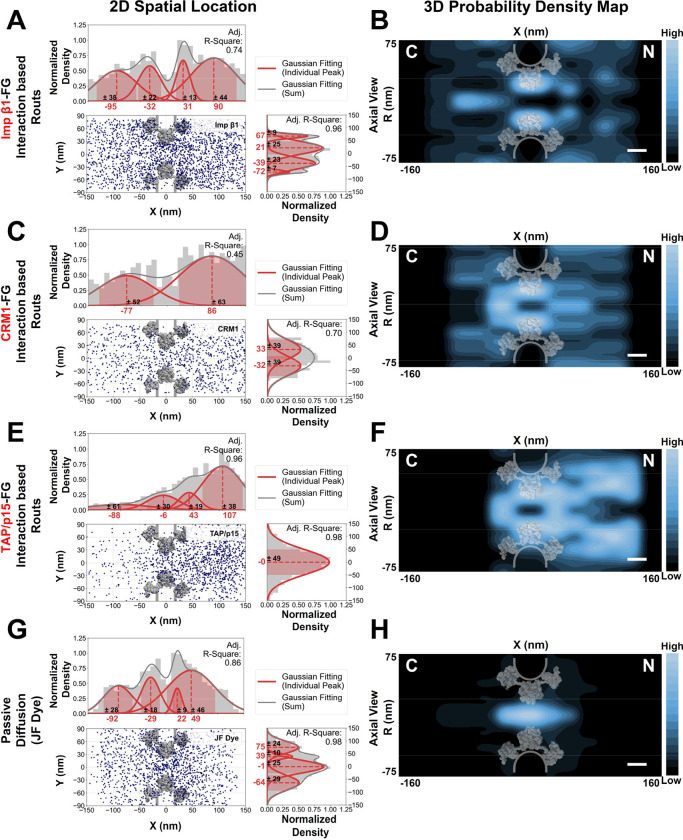
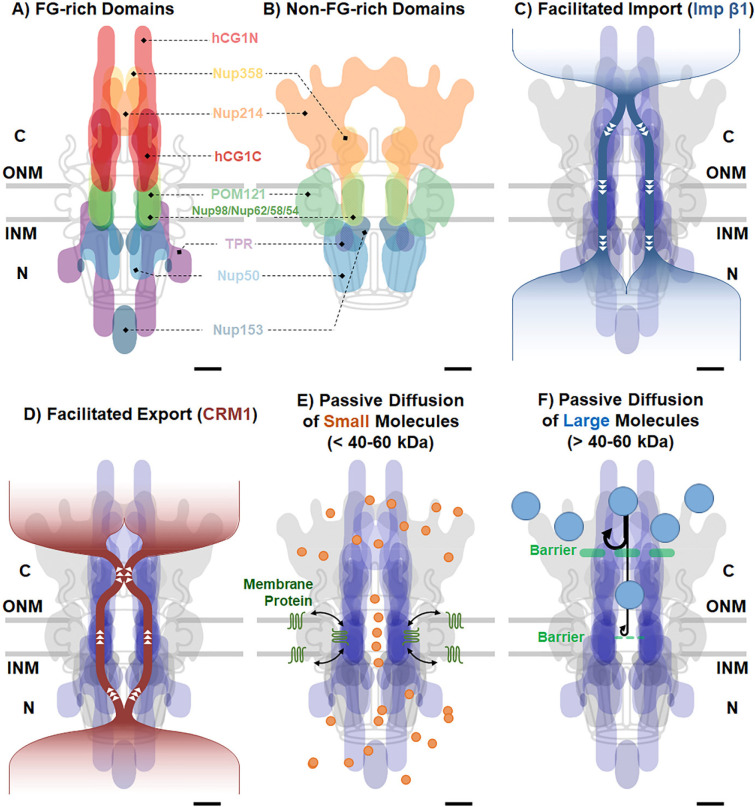
Understanding the spatial organization of nucleoporins (Nups) with intrinsically disordered domains within the nuclear pore complex (NPC) is crucial for deciphering eukaryotic nucleocytoplasmic transport. Leveraging high-speed 2D single-molecule tracking and virtual 3D super-resolution microscopy in live HeLa cells, we investigated the spatial distribution of all eleven phenylalanine-glycine (FG)-rich Nups within individual NPCs. Our study reveals a nuanced landscape of FG-Nup conformations and arrangements. Five FG-Nups are steadfastly anchored at the NPC scaffold, collectively shaping a central doughnut-shaped channel, while six others exhibit heightened flexibility, extending towards the cytoplasmic and nucleoplasmic regions. Intriguingly, Nup214 and Nup153 contribute to cap-like structures that dynamically alternate between open and closed states along the nucleocytoplasmic transport axis, impacting the cytoplasmic and nuclear sides, respectively. Furthermore, Nup98, concentrated at the scaffold region, extends throughout the entire NPC while overlapping with other FG-Nups. Together, these eleven FG-Nups compose a versatile, capped trichoid channel spanning approximately 270 nm across the nuclear envelope. This adaptable trichoid channel facilitates a spectrum of pathways for passive diffusion and facilitated nucleocytoplasmic transport. Our comprehensive mapping of FG-Nup organization within live NPCs offers a unifying mechanism accommodating multiple transport pathways, thereby advancing our understanding of cellular transport processes.

Keywords: FG-Nups; Hydrophobic interaction; Intrinsically disordered proteins; Live cell imaging; Nuclear pore complexes; Nuclear pore structure; Nucleocytoplasmic transport; Nucleoporins; Single-molecule tracking; Super-resolution light microscopy; Three-dimensional microscopy imaging.


Conflict of interest statement

Declaration of interests The authors declare that they have no competing financial interests.

Figures

Figure 1.
Figure 1.. Labeling Strategy and Live Confocal Imaging of FG-Nups Labeled with HaloTag and GFP.
A) FG Nup constructs illustrating N- and C-terminal labeling strategies. The cartoons delineate the FG-rich and non-FG-rich regions of the proteins and indicate where JF dye binds to the HaloTag. B) Schematic depiction of stable expression of mCherry-POM121 in HeLa cells. The rotational symmetrical distribution of POM121 within the NPC allowed us to employ the mCherry signal for NPC centroid determination. C) The amino acid sequences of all eleven human FG-Nups, depicting both the FG motifs and more structured regions. FG, FxFG, and GLFP sequences are highlighted in distinct colors. Information about the labeled regions was compiled from the protein structure database and previously published studies. D) Three-channel live-cell laser scanning confocal image displaying labeled NPCs in live HeLa cells. Bright nuclear envelope (NE) rings are presented in three distinct colors, representing ten FG-Nups. These observations were made by examining NPCs containing either mCherry-POM121 and JF646-HaloTag-FG-Nup-EGFP or mCherry-POM121 and EGFP-FG-Nup-HaloTag-JF646 in live cells. In the case of EGFP-POM121-HaloTag, we observed NE rings in two colors due to the fusion of either EGFP or mCherry at the N terminus. Scale bar: 5 μm.
Figure 2.
Figure 2.. Dynamics of FG Nups within live cell NPCs revealed through 2D single-molecule tracking using SPEED microscopy.
A) Simplified optical setup for SPEED microscopy. Single-point illumination employs 488-nm, 561-nm, and 633-nm lasers, targeting individual NPCs at the nuclear envelope (NE) equator in live cells. DM: dichroic mirror, RM: reflection mirror, N: Nucleus, C: Cytoplasm. B) A single NPC is illuminated at the focal plane of SPEED microscopy, depicted in both axial and lateral dimensions. (N: Nucleus, C: Cytoplasm). C-E) Example single-molecule fluorescence are shown for Nup214C located on the cytoplasmic side, POM121C in the central scaffold, and Nup153C in the nuclear basket. The cartoons illustrate the labeling of these FG Nups. The time-series images and their corresponding photobleaching curves indicate the initiation and termination of fluorescence from JF dyes used to label these FG Nups, with the Y-axis representing the photon counts and the X-axis representing time. F) Single-molecule tracking and the localization of fluorescent spots in the time-series images, as presented in C-E, generated the 2D single-molecule trajectories for Nup214C (red), POM121C (green), and Nup153C (yellow). These trajectories were then superimposed and overlaid onto the NPC scaffold structure (light grey). The light grey structure represents the NPC scaffold structure obtained through Cryo-EM, sourced from the RCSB Protein Data Bank. It is noteworthy that the structure presented here is the original version publicly available. This structure contains three small fragments of Nup98 and a coiled-coil structure from each of the three central scaffold FG Nups: Nup62, Nup58, and Nup54, in addition to the structural information of scaffold Nups. G-I) Mean Squared Displacement (MSD) analyses were conducted on 2D single-molecule trajectories, which were compiled from over fifty single-molecule traces for the FG-rich and non-FG-rich domains of Nup214 (red), POM121C (green), and Nup153C (yellow), respectively. These analyses (ii) of the trajectories (i) provided essential insights, including the extension length (iv), the diffusion coefficient (iii), and the exponent α (iii), as determined by the relationship MSD(t)=4Dtα for these FG Nups within live cell NPCs. The histogram of extension lengths was fitted with Gaussian functions, facilitating the quantification of the maximum extension length presented as mean ± SD. The blue and pink regions specifically delineate the range from −200 nm to 0 nm (cytoplasmic side) and from 0 nm to 200 nm (nuclear side) along the nucleocytoplasmic transport axis (the X dimension), respectively. In the perpendicular direction (the Y dimension) for both regions, the range extends from −100 nm to 100 nm. J) The distribution of localizations for the FG-rich domains of each FG-Nup, evaluated with respect to their 2D spatial locations on the cytoplasmic (blue) or nucleoplasmic (pink) side, is illustrated. The blue and pink areas correspond to the range from −200 nm to 0 nm and from 0 nm to 200 nm along the nucleocytoplasmic transport axis, respectively. K) Displays the average maximum extensions (in nm) for each FG-Nup, distinguishing between FG-rich (orange) and non-FG-rich (dark blue) regions. Nups denoted with * contain FG-rich regions (orange) at both ends. L) A scatter plot depicts the diffusion of FG Nups positioned on the cytoplasmic side (red), within the central scaffold (green), and on the nuclear side (yellow). The Y-axis represents α, while the X-axis displays the diffusion coefficient (μm2/s), presented on a logarithmic scale. N: Nucleus, C: Cytoplasm.
Figure 3.
Figure 3.. 2D Spatial Localizations and 3D Spatial Probability Density Maps for FG Nups Situated at the Central Scaffold of the NPC.
(A-D) 2D Spatial Localizations of the FG-rich Domains and 3D Spatial Probability Density Maps for both the FG-rich and non-FG-rich domains of POM121, Nup98, Nup62, and Nup54. Normalized 2D spatial density histograms from these 2D spatial localizations were fitted with Gaussian functions along the X and Y dimensions, respectively. The 2D spatial localizations of the non-FG-rich Domains were provided in the Supplementary Information. The 3D Spatial Probability Density Maps are presented in a slice view, highlighting dimensions along the axial (X dimension, representing the cytoplasmic transport axis) and cross-sectional (R dimension, perpendicular to the cytoplasmic transport axis) orientations. These maps are provided for the FG-rich domains (in green), the non-FG-rich domains (in blue), and the composite map of both FG-rich and non-FG-rich domains (in blue-green) for these FG Nups. The light grey structure depicts the NPC scaffold, including small fragments of the central scaffold FG Nups (Nup98, Nup62, Nup58, and Nup54), obtained through Cryo-EM and sourced from the RCSB Protein Data Bank. Roman numerals indicate cross-section slices representing probability density along the R dimension. The color bar, ranging from dark to bright, represents the density change from low to high. Scale bar: 20 nm. N: nucleus. C: Cytoplasm. (E-F) 2D Spatial Localizations and 3D Spatial Probability Density Maps for Nup85C and Nup58N. Normalized 2D spatial density histograms from these 2D spatial localizations were fitted with Gaussian functions along the X and Y dimensions, respectively. The slice views of 3D spatial probability density maps are presented in axial (X dimension, representing the cytoplasmic transport axis) and cross-sectional (R dimension, perpendicular to the cytoplasmic transport axis) views. The light grey structure depicts the NPC scaffold, including small fragments of the central scaffold FG Nups (Nup98, Nup62, Nup58, and Nup54), obtained through Cryo-EM and sourced from the RCSB Protein Data Bank. Roman numerals indicate cross-section slices that illustrate probability density along the R dimension. The color bar, ranging from dark to bright, represents the density change from low to high. Scale bar: 20 nm. N: nucleus. C: Cytoplasm. (G) Overlap of the FG-rich and non-FG-rich domains of the five FG Nups located at the central scaffold of the NPC, shown in both the axial and top views. The light grey structure depicts the NPC scaffold, including small fragments of the central scaffold FG Nups (Nup98, Nup62, Nup58, and Nup54), obtained through Cryo-EM and sourced from the RCSB Protein Data Bank. The color bar, ranging from dark to bright, represents the density change from low to high. Scale bar: 20 nm. N: nucleus. C: Cytoplasm.
Figure 4.
Figure 4.. 2D Spatial Localizations and 3D Spatial Probability Density Maps for FG Nups Situated on the Cytoplasmic Side of the NPC.
(A) 2D Spatial Localizations of the FG-rich Domains and 3D spatial probability density maps for both the FG-rich and non-FG-rich domains of Nup358. Normalized 2D spatial density histograms from the 2D spatial localizations were fitted with Gaussian functions along the X and Y dimensions, respectively. The 2D spatial localizations of the non-FG-rich Domains were provided in the Supplementary Information. The slice views of 3D spatial probability density saps are presented in axial (X dimension, representing the cytoplasmic transport axis) and cross-sectional (R dimension, perpendicular to the cytoplasmic transport axis) views for (i) the FG-rich domains (red), (ii) the non-FG-rich domains (blue), and (iii) the combined map of the FG-rich and non-FG-rich domains (red-blue) for Nup358. The light grey structure depicts the NPC scaffold, including small fragments of the central scaffold FG Nups (Nup98, Nup62, Nup58, and Nup54), obtained through Cryo-EM and sourced from the RCSB Protein Data Bank. Roman numerals indicate cross-section slices representing probability density along the R dimension. The color bar, ranging from dark to bright, represents the density change from low to high. Scale bar: 20 nm. N: nucleus. C: Cytoplasm. (B-C) 2D Spatial Localizations and 3D spatial probability density maps for hCG1C and hCG1N. Normalized 2D spatial density histograms from these 2D spatial localizations were fitted with Gaussian functions along the X and Y dimensions, respectively. The slice views of 3D spatial probability density maps are presented in axial (X dimension, representing the cytoplasmic transport axis) and cross-sectional (R dimension, perpendicular to the cytoplasmic transport axis) views. The light grey structure depicts the NPC scaffold, including small fragments of the central scaffold FG Nups (Nup98, Nup62, Nup58, and Nup54), obtained through Cryo-EM and sourced from the RCSB Protein Data Bank. Roman numerals indicate cross-section slices that illustrate probability density along the R dimension. The color bar, ranging from dark to bright, represents the density change from low to high. Scale bar: 20 nm. N: nucleus. C: Cytoplasm. (D) 2D Spatial Localizations of the FG-rich Domains and 3D spatial probability density maps for both the FG-rich and non-FG-rich domains of Nup214. Normalized 2D spatial density histograms from the 2D spatial localizations were fitted with Gaussian functions along the X and Y dimensions, respectively. The 2D spatial localizations of the non-FG-rich Domains were provided in the Supplementary Information. The slice views of 3D spatial probability density saps are presented in axial (X dimension, representing the cytoplasmic transport axis) and cross-sectional (R dimension, perpendicular to the cytoplasmic transport axis) views for (i) the FG-rich domains (red), (ii) the non-FG-rich domains (blue), and (iii) the combined map of the FG-rich and non-FG-rich domains (red-blue) for Nup214. The light grey structure depicts the NPC scaffold, including small fragments of the central scaffold FG Nups (Nup98, Nup62, Nup58, and Nup54), obtained through Cryo-EM and sourced from the RCSB Protein Data Bank. Roman numerals indicate cross-section slices representing probability density along the R dimension. The color bar, ranging from dark to bright, represents the density change from low to high. Scale bar: 20 nm. N: nucleus. C: Cytoplasm. (E)The plug-like structure formed by Nup214C undergoes transitions between an engaged (closed) state and two disengaged (open) states, with varying probabilities and dimensions in diameter. The color bar, ranging from dark to bright, represents the density change from low to high. Scale bar: 20 nm. N: nucleus. C: Cytoplasm. (F) Overlap of the FG-rich and non-FG-rich domains of the three FG Nups situated on the cytoplasmic side of the NPC, presented in both the axial and top views. The open and closed states of Nup214C were separately incorporated into the maps of FG-rich domains (i and iii). The light grey structure depicts the NPC scaffold, including small fragments of the central scaffold FG Nups (Nup98, Nup62, Nup58, and Nup54), obtained through Cryo-EM and sourced from the RCSB Protein Data Bank. The color bar, transitioning from dark to bright, signifies changes in density from low to high. Scale bar: 20 nm. N: nucleus. C: Cytoplasm.
Figure 5.
Figure 5.. 2D Spatial Localizations and 3D Spatial Probability Density Maps for FG Nups Situated on the Nuclear Side of the NPC.
(A) 2D Spatial Localizations of the FG-rich Domains and 3D Spatial Probability Density Maps for both the FG-rich and non-FG-rich domains of Nup153. Normalized 2D spatial density histograms from the 2D spatial localizations were fitted with Gaussian functions along the X and Y dimensions, respectively. The 2D spatial localizations of the non-FG-rich Domains were provided in the Supplementary Information. The slice views of 3D spatial probability density maps are presented in axial (X dimension, representing the cytoplasmic transport axis) and cross-sectional (R dimension, perpendicular to the cytoplasmic transport axis) views for the FG-rich domains (yellow), the non-FG-rich domains (blue), and the combined map of the FG-rich and non-FG-rich domains (yellow-blue) for these FG Nups. The light grey structure depicts the NPC scaffold, including small fragments of the central scaffold FG Nups (Nup98, Nup62, Nup58, and Nup54), obtained through Cryo-EM and sourced from the RCSB Protein Data Bank. Roman numerals indicate cross-section slices representing probability density along the R dimension. The color bar, ranging from dark to bright, represents the density change from low to high. Scale bar: 20 nm. N: nucleus. C: Cytoplasm. (B) The plug-like structure formed by Nup153C undergoes transitions between an engaged (closed) state and two disengaged (open) states, with varying probabilities and dimensions in diameter. The light grey structure depicts the NPC scaffold, including small fragments of the central scaffold FG Nups (Nup98, Nup62, Nup58, and Nup54), obtained through Cryo-EM and sourced from the RCSB Protein Data Bank. Roman numerals indicate cross-section slices representing probability density along the R dimension. The color bar, ranging from dark to bright, represents the density change from low to high. Scale bar: 20 nm. N: nucleus. C: Cytoplasm. (C-D) 2D Spatial Localizations of the FG-rich Domains and 3D Spatial Probability Density Maps for both the FG-rich and non-FG-rich domains of TPR and Nup50. Normalized 2D spatial density histograms from these 2D spatial localizations were fitted with Gaussian functions along the X and Y dimensions, respectively. The 2D spatial localizations of the non-FG-rich Domains were provided in the Supplementary Information. The slice views of 3D spatial probability density maps are presented in axial (X dimension, representing the cytoplasmic transport axis) and cross-sectional (R dimension, perpendicular to the cytoplasmic transport axis) views for the FG-rich domains (yellow), the non-FG-rich domains (blue), and the combined map of the FG-rich and non-FG-rich domains (yellow-blue) for these FG Nups. The light grey structure depicts the NPC scaffold, including small fragments of the central scaffold FG Nups (Nup98, Nup62, Nup58, and Nup54), obtained through Cryo-EM and sourced from the RCSB Protein Data Bank. Roman numerals indicate cross-section slices representing probability density along the R dimension. The color bar, ranging from dark to bright, represents the density change from low to high. Scale bar: 20 nm. N: nucleus. C: Cytoplasm. (E) Overlap of the FG-rich and non-FG-rich domains of the three FG Nups situated on the nuclear side of the NPC, presented in both the axial and top views. The open and closed states of Nup153C were separately incorporated into the maps of FG-rich domains (i and ii). The light grey structure depicts the NPC scaffold, including small fragments of the central scaffold FG Nups (Nup98, Nup62, Nup58, and Nup54), obtained through Cryo-EM and sourced from the RCSB Protein Data Bank. The color bar, transitioning from dark to bright, signifies changes in density from low to high. Scale bar: 20 nm. N: nucleus. C: Cytoplasm.
Figure 6.
Figure 6.. 3D Transport Pathways Utilized by Different NTRs and Transiting Macromolecules through the NPCs in Live Cells.
(A) 2D spatial locations of EGFP-labeled Importin β1 transport through the NPCs in live cells. Normalized 2D spatial density histograms from the 2D spatial localizations were fitted with Gaussian functions along the X and Y dimensions, respectively. B) 3D Transport Route of Importin β1 through the NPC. The slice view of 3D spatial probability density map of Importin β1 (blue) was oberlaid with the NPC scaffold structure (light grey). The light grey structure depicts the NPC scaffold, including small fragments of the central scaffold FG Nups (Nup98, Nup62, Nup58, and Nup54), obtained through Cryo-EM and sourced from the RCSB Protein Data Bank. (C) 2D spatial locations of EGFP-labeled CRM1 transport through the NPCs in live cells. Normalized 2D spatial density histograms from the 2D spatial localizations were fitted with Gaussian functions along the X and Y dimensions, respectively. (D) 3D Transport Route of CRM1 through the NPC. The slice view of 3D spatial probability density map of CRM1 (blue) was oberlaid with the NPC scaffold structure (light grey). (E) 2D spatial locations of EGFP-labeled TAP/p15 export through the NPCs in live cells. Normalized 2D spatial density histograms from the 2D spatial localizations were fitted with Gaussian functions along the X and Y dimensions, respectively. (F) 3D Export Route of TAP/p15 through the NPC. The slice view of 3D spatial probability density map of Importin β1 (blue) was oberlaid with the NPC scaffold structure (light grey). (G) 2D spatial locations of JF dyes diffuse through the NPCs in live cells. Normalized 2D spatial density histograms from the 2D spatial localizations were fitted with Gaussian functions along the X and Y dimensions, respectively. (H) 3D Passive Diffusion Path of JF Dyes through the NPC. The slice view of 3D spatial probability density map of JF dyes (blue) was oberlaid with the NPC scaffold structure (light grey). Scale bar: 20 nm. N: nucleus. C: cytoplasm.
Figure 7.
Figure 7.. Distinct Pathways through the Capped Adaptable Trichoid Channels (CATCH) within the NPC
(A) An illustration depicting the native configuration of FG-rich domains of all eleven FG Nups in the NPC of live cells. N: nucleus. C: Cytoplasm. ONM: Outer Nuclear Membrane. INM: Inner Nuclear Membrane. (B) An illustration depicting the native configuration of non-FG-rich domains of all eleven FG Nups in the NPC of live cells. (C) The facilitated import pathway utilized by Importin-β1 is closely associated with the configuration of FG-rich domains in all eleven FG Nups. Arrows illustrate the import process rather than implying unidirectional movement. N: nucleus. C: Cytoplasm. ONM: Outer Nuclear Membrane. INM: Inner Nuclear Membrane. (D) The facilitated export pathway employed by CRM1 is intricately linked to the configuration of FG-rich domains in all eleven FG Nups. Arrows depict the export process, avoiding the implication of unidirectional movement. N: nucleus. C: Cytoplasm. ONM: Outer Nuclear Membrane. INM: Inner Nuclear Membrane. (E) An illustration depicting the passive diffusion of small molecules, both soluble and membrane-bound (< 40–60 kDa), through the configuration of FG-rich domains of all eleven FG Nups. (F) An illustration depicting the passive diffusion of large molecules (> 60 kDa) encountering barriers (green lines) inhibiting their passive diffusion. Scale bar: 20 nm. N: nucleus. C: Cytoplasm. ONM: Outer Nuclear Membrane. INM: Inner Nuclear Membrane.

Similar articles

References

    1. Cronshaw J. M., Krutchinsky A. N., Zhang W., Chait B. T. & Matunis M. J. Proteomic analysis of the mammalian nuclear pore complex. The Journal of cell biology 158, 915–927 (2002). - PMC - PubMed
    1. Denning D. P., Patel S. S., Uversky V., Fink A. L. & Rexach M. Disorder in the nuclear pore complex: the FG repeat regions of nucleoporins are natively unfolded. Proceedings of the National Academy of Sciences 100, 2450–2455 (2003). - PMC - PubMed
    1. Fahrenkrog B. & Aebi U. The nuclear pore complex: nucleocytoplasmic transport and beyond. Nature Reviews Molecular Cell Biology 4, 757–766 (2003). - PubMed
    1. Li C., Goryaynov A. & Yang W. The selective permeability barrier in the nuclear pore complex. Nucleus 7, 430–446 (2016). 10.1080/19491034.2016.1238997 - DOI - PMC - PubMed
    1. Terry L. J. & Wente S. R. Flexible gates: dynamic topologies and functions for FG nucleoporins in nucleocytoplasmic transport. Eukaryotic cell 8, 1814–1827 (2009). - PMC - PubMed

Publication types