[Preprint]. 2024 Jan 16:2024.01.07.574538.
doi: 10.1101/2024.01.07.574538.

A spatial cell atlas of neuroblastoma reveals developmental, epigenetic and spatial axis of tumor heterogeneity

Affiliations

A spatial cell atlas of neuroblastoma reveals developmental, epigenetic and spatial axis of tumor heterogeneity

Anand G Patel et al. bioRxiv. .

Abstract

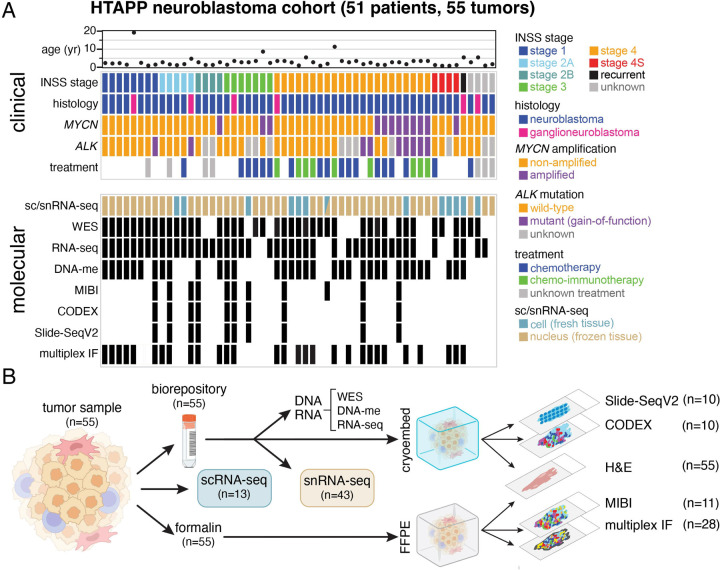
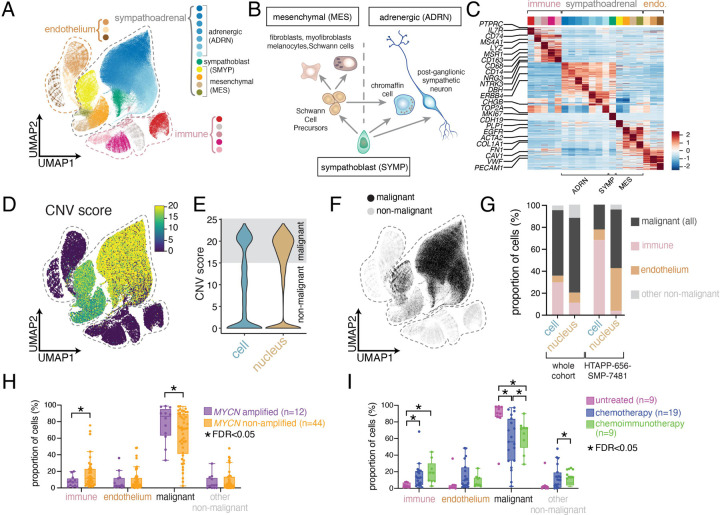
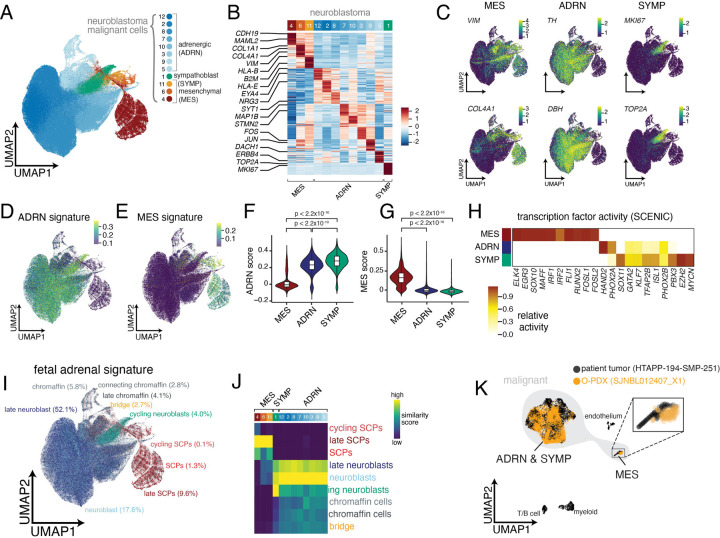
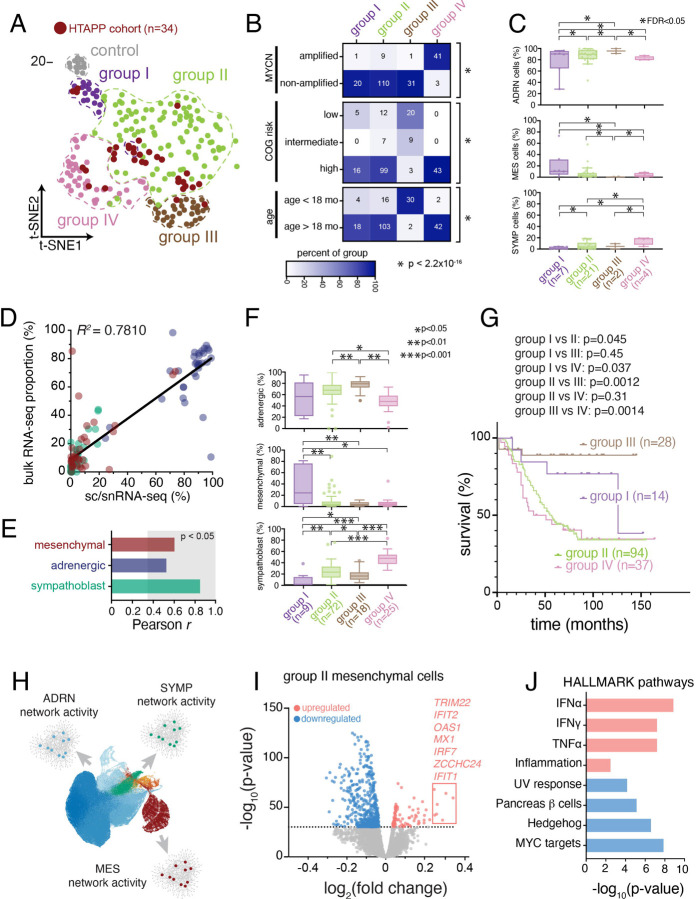
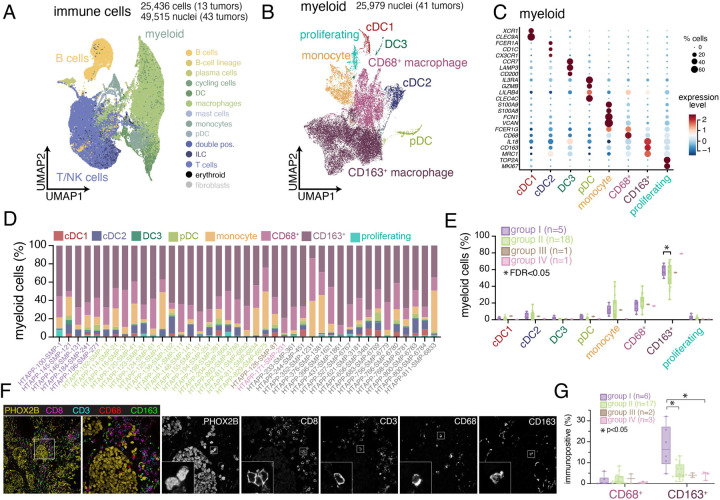
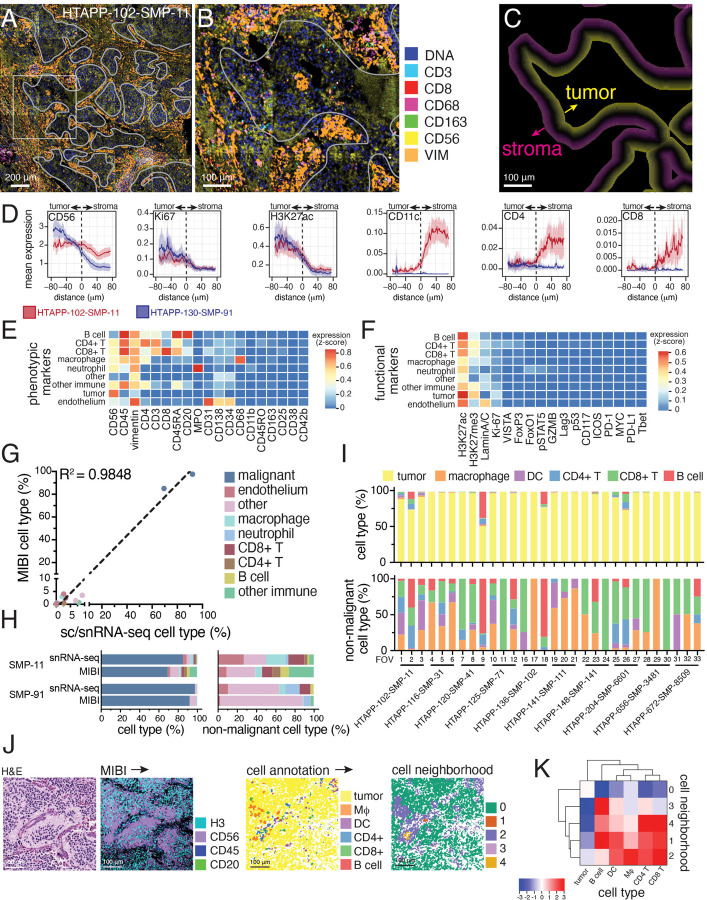
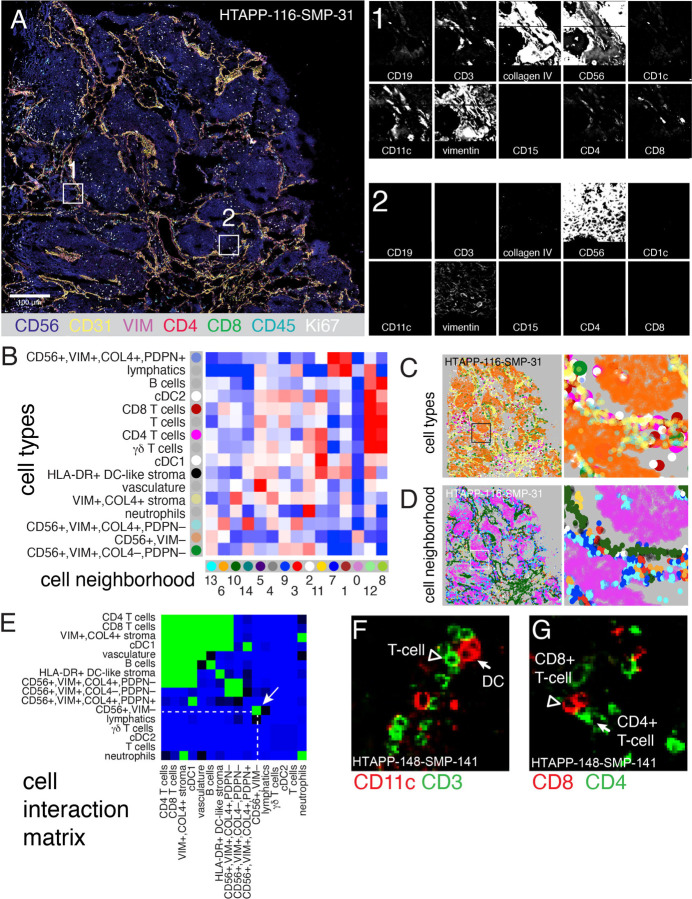
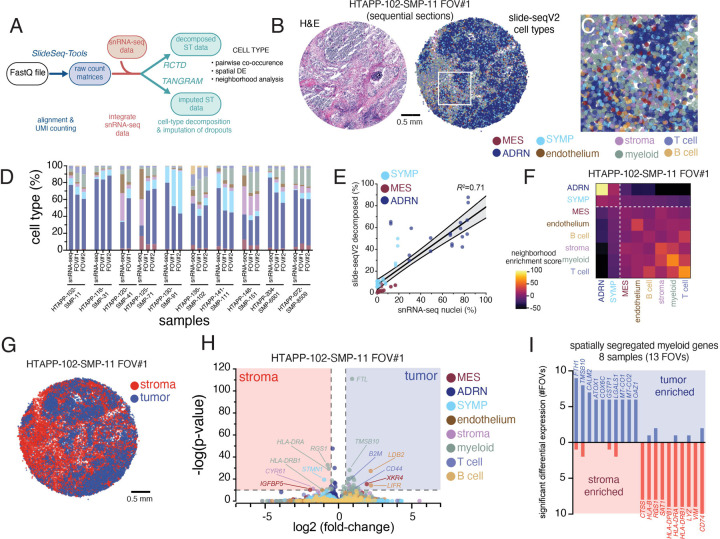
Neuroblastoma is a pediatric cancer arising from the developing sympathoadrenal lineage with complex inter- and intra-tumoral heterogeneity. To chart this complexity, we generated a comprehensive cell atlas of 55 neuroblastoma patient tumors, collected from two pediatric cancer institutions, spanning a range of clinical, genetic, and histologic features. Our atlas combines single-cell/nucleus RNA-seq (sc/scRNA-seq), bulk RNA-seq, whole exome sequencing, DNA methylation profiling, spatial transcriptomics, and two spatial proteomic methods. Sc/snRNA-seq revealed three malignant cell states with features of sympathoadrenal lineage development. All of the neuroblastomas had malignant cells that resembled sympathoblasts and the more differentiated adrenergic cells. A subset of tumors had malignant cells in a mesenchymal cell state with molecular features of Schwann cell precursors. DNA methylation profiles defined four groupings of patients, which differ in the degree of malignant cell heterogeneity and clinical outcomes. Using spatial proteomics, we found that neuroblastomas are spatially compartmentalized, with malignant tumor cells sequestered away from immune cells. Finally, we identify spatially restricted signaling patterns in immune cells from spatial transcriptomics. To facilitate the visualization and analysis of our atlas as a resource for further research in neuroblastoma, single cell, and spatial-omics, all data are shared through the Human Tumor Atlas Network Data Commons at www.humantumoratlas.org.

Keywords: Neuroblastoma; immunotherapy; intratumoral heterogeneity; single-cell biology.


Figures

Figure 1.
Figure 1.. HTAPP neuroblastoma study design and sample cohort.
(A) Clinical, histologic, and molecular features of the HTAPP neuroblastoma dataset (n=55). Sequencing and spatial technologies applied are indicated. (B) Sample workflow. Fresh, frozen, and fixed tissue from neuroblastoma tumors were from two institutions, St. Jude Children’s Research Hospital and Dana-Farber Cancer Institute. Fresh or frozen tissue were dissociated for single-cell or single-nucleus RNA-sequencing, respectively. Additionally, a subset of tumors underwent deep spatial profiling using spatial proteomic (MIBI and CODEX) or spatial transcriptomic (Slide-SeqV2) methods. Abbreviations: INSS, international neuroblastoma staging system; WES, whole exome sequencing; DNA-me, DNA methylation; MIBI, multiplexed ion beam imaging; CODEX, co-detection by indexing; FFPE, formalin-fixed paraffin-embedded; IF, immunofluorescence.
Figure 2.
Figure 2.. Single-cell and nucleus RNA-sequencing of 55 neuroblastoma tumors.
(A) UMAP plot showing integrated data from both scRNA-seq (n=13 tumors; 84,769 cells) and snRNA-seq (n=43 tumors; 445,286 nuclei). Twenty clusters were identified, which were annotated as endothelial (n=3 clusters), immune (n=5 clusters), or sympathoadrenal (n=12 clusters). (B) Schematic of sympathoadrenal lineages within the developing adrenal gland. Sympathoblasts are a proliferative sympathoadrenal progenitor, which differentiate to generate either: (i.) cells of the mesenchymal (MES) lineage, which are derived from multipotent Schwann cell precursors (SCPs), or (ii.) cells of the adrenergic (ADRN) lineage, which consist of postmitotic adrenergic cells. (C) Heatmap showing relative expression of the top 30 genes for each joint cluster. Expression is colored based on scaled normalized value (z-score). (D) UMAP plot showing copy number variant (CNV) scores following inference of copy-number alteration. (E) Violin plot comparing the CNV score from scRNA-seq and snRNA-seq data. (F) UMAP plot as in (A) colored based on the presence or absence of inferred copy number alterations. (G) Cell type composition after coarse annotation of the transcriptomic atlas, comparing all single-cell RNA-seq data and all single-nucleus RNA-seq data, or comparing one sample (HTAPP-656-SMP-7481) that was processed by both single-cell and single-nucleus RNA-sequencing. (H-I) Relative proportion of immune, endothelium, malignant, and non-malignant cells/nuclei for each tumor comparing MYCN status (H) or treatment status (I). The comparison of treatment impact in heterogeneity (HI was restricted to only intermediate-risk or high-risk samples. Bars with a * demarcate credibly significant differences, as calculated by Bayesian composition analysis using a false discovery rate (FDR) of 0.05. Abbreviations: UMAP, uniform manifold approximation and projection; ADR, adrenergic; S, sympathoblast; MES, mesenchymal; SCP, Schwann cell precursor; CNV, copy number variation; FDR, false discovery rate.
Figure 3.
Figure 3.. Analysis of malignant cell-specific programs of neuroblastoma.
(A) UMAP plot showing integrated data of malignant cells/nuclei from scRNA-seq (n=13 tumors; 50,532 cells) and snRNA-seq (n=43 tumors; 293,592 nuclei) clustered by joint cluster. Twelve clusters were identified which were annotated as adrenergic (n=8 clusters), mesenchymal (n=3 clusters), or sympathoblast (n=1 cluster). (B) Heatmap showing relative expression of the top 30 genes for each malignant cluster. Expression is colored based on scaled normalized value (z-score). (C) UMAP plots of malignant cells/nuclei, colored based on expression of mesenchymal markers (VIM, COL4A1), adrenergic markers (TH, DBH), and sympathoblast markers (MKI67, TOP2A). Cells are colored based on normalized expression. (D-E) UMAP plots of malignant neuroblastoma data, colored based on adrenergic (D) and mesenchymal (E) signature scores from van Groningen, et al. (F-G) Violin plot of adrenergic (F) and mesenchymal (G) signature scores split by developmental state (mesenchymal, adrenergic, and sympathoblast). (H) Heatmap showing inferred transcription factor activity for a curated list of neuroblastoma core regulatory circuit factors,. A full list of differentially active transcription factors is available in Table S5. Transcription factor activity is colored based on normalized activity. (I) UMAP plot as in (A), colored based on predicted similarity to fetal adrenal medulla cell states from Jansky, et al. using SingleR. (J) Heatmap of similarity scores between each joint cluster and fetal adrenal medulla cell states. Similarity scores are calculated as normalized Spearman correlations. (K) Overlay comparing snRNA-seq data from an orthotopic patient-derived xenograft (SJNBL012407_X1) to snRNA-seq from the originating patient tumor (HTAPP-194-SMP-251).
Figure 4.
Figure 4.. DNA methylation profiling identifies 4 subtypes of neuroblastoma that differ in malignant cell state composition and outcome.
(A) t-SNE dimension reduction of 207 neuroblastoma methylation profiles from the NCI TARGET cohort (n=173) or the HTAPP neuroblastoma cohort (n=34). Consensus clustering was used to delineate 4 groups of tumors plus a group of control adrenal samples. Samples from the HTAPP cohort are demarcated in dark red. (B) Heatmaps colored based on relative abundance of clinical risk factors within each methylation grouping from (A). Numbers within each cell correspond to the absolute number of tumors. p-values, Fisher exact test of independence. (C) Box plot of the proportion of malignant cells/nuclei within each malignant cell state, divided by methylation group. Data are presented as median ± interquartile range. Statistically credible differences, as determined by Bayesian composition analysis set with a false discovery < 0.05, are displayed as bars with an asterisk. (D and E) Validation and optimization of CIBERSORTx bulk deconvolution parameters derived using matched snRNA-seq and bulk RNA-seq data from n=33 tumors from the HTAPP cohort. (D) shows a scatterplot comparing proportion of cells in each malignant state within sc/snRNA-seq data (‘ground truth’) compared to the estimated proportion from bulk deconvolution. (E) shows the cell-type specific correlation between sc/snRNA-seq and bulk deconvolved data. Bars in the gray region meet significant criteria for concordance with ground truth as measured by Pearson correlation (p < 0.05) (F) Box plots of estimated malignant cell proportions within the NCI TARGET dataset, as estimated by CIBERSORTx bulk deconvolution of bulk RNA-seq data, divided by methylation grouping. Plots show proportions of cells that are estimated to be in the mesenchymal (top), adrenergic (middle), or sympathoblast (bottom) state. Data are presented as median ± interquartile range. Differences across groups that meet statistical significance are shown (p values; Wilcoxon rank sum test). (G) Kaplan-Meier curve showing overall survival of patients within the NCI TARGET cohort (n=175) divided by methylation grouping. p-values were calculated using the Mantel-Cox log rank test. Censored datapoints are represented with solid rectangles. (H) Schematic of the scMINER activity inference. scMINER generates cell type-specific gene regulatory network to infer protein activity and signaling factor activation. (I) Volcano plot of signaling pathway inference comparing group II MES cells to MES cells from the other methylation groupings. (J) HALLMARK pathway analysis of statistically significant results from (I).
Figure 5.
Figure 5.. Immune cell heterogeneity and spatial compartmentalization of neuroblastoma.
(A) UMAP plot of integrated immune cells/nuclei from scRNA-seq (n=13 tumors; 25,436 cells) and snRNA-seq (n=43 tumors; 49,515 nuclei). Cells/nuclei are colored based on CellTypist automated annotation. (B) UMAP plot of 25,979 myeloid nuclei from the HTAPP neuroblastoma dataset (B). Nuclei are categorized based on the expression of cell markers. (C) Dot plot showing expression of cell markers for each myeloid cluster. Expression is colored based on scaled normalized value (z-score) and the size of each dot represents the percentage of cells within each cluster that had detectable expression. (D) Bar plots showing cell type proportions of myeloid subtypes for each sample within the snRNA-seq cohort (n=41). (E) Composition analysis of the myeloid compartment across snRNA-seq datasets (n=41), separated by methylation grouping. Data are presented as median ± interquartile range. Statistically credible differences, as measured using Bayesian component analysis with false discover rate < 0.05, are represented with an asterisk. (F) Example image of multiplexed immunofluorescence for sample HTAPP-102-SMP-11, stained with PHOX2B, CD8, CD3, CD68, and CD163. (G) Quantitation of CD68+ and CD163+ cells from multiplexed immunofluorescence (n=28). Data is divided by methylation grouping. Data is presented as median ± interquartile range. Differences across groups that meet statistical significance are marked with an asterisk (p values; Wilcoxon rank sum test).
Figure 6.
Figure 6.. Multiplexed ion-beam imaging (MIBI) identifies compartmentalization of tumor and immune cells.
(A) Multiplexed ion beam imaging (MIBI) of multiplexed spatial proteomic data. Two large, tiled arrays (5x5 captured areas) from samples HTAPP-102-SMP-11 and HTAPP-130-SMP-91 were obtained. As an example, the stitched array from HTAPP-102-SMP-11 is shown in panel A; 7 markers are shown (double-stranded DNA [dsDNA], CD3, CD8, CD68, CD163, CD56 and Vimentin [VIM]). A white overlay shows the tumor-stroma interface, which was used for patched level analysis of neuroblastoma (PLANB). (B) A high magnification of the boxed area within (A). (C) Patched level analysis of neuroblastoma (PLANB) determines the relative locality of cell types or markers with reference to the tumor-stroma boundary using a stepwise pixel-by-pixel algorithm. (D) PLANB analysis of HTAPP-102-SMP-11 and HTAPP-130-SMP-91 showing the distribution of tumor markers (CD56, Ki67, H3K27ac), myeloid cells (CD11c), or T cells (CD4, CD8). The x-axis reflects distance relative to tumor-stroma interface, with negative values being within the tumor nest and positive values being outside the tumor nest. The y-axis reflects relative expression of markers (arbitrary units). (E-F) Heatmap showing expression of cell type phenotypic markers (E) and functional markers (F) for each cell type in the large, tiled arrays. (G-H) Cell type proportions from the two large, tiled arrays comparing the prevalence of cell types in the MIBI data compared to snRNA-seq data. Panel (G) shows a scatterplot comparing proportions of each cell type identified in sc/snRNA-seq data (x-axis) to the proportion detected in the tiled MIBI arrays for HTAPP-102-SMP-11 and HTAPP-130-SMP-91. Panel (H) shows bar plots comparing cell type composition in snRNA-seq and MIBI datasets both including (left) and excluding (right) malignant cells/nuclei. (I) Bar plot of cell types in the single-tile MIBI datasets (10 samples, 30 FOVs). Following capture of MIBI data, segmentation and marker expression was used to annotate cell types. Bar plots including and excluding malignant cells are shown on the top and bottom, respectively. (J) Neighborhood analysis of MIBI data from the 30 FOVs from (H). As an example, we show HTAPP-102-SMP-11 field-of-view (FOV) #1. On the left side, we show an H&E from an adjacent section. Following MIBI capture, images were segmented, and cell types were automatically called. These cell maps were then analyzed using neighborhood analysis to identify those cell types that co-localize with each other. (K) Cluster-map of cell type composition within each neighborhood from the combined MIBI dataset (n=30 FOVs). Dendrograms represent hierarchical clustering of cell types (rows) and neighborhoods (columns). Colors represent scaled likelihood of adjacency between cell types.
Figure 7.
Figure 7.. Co-detection by indexing (CODEX) imaging of whole slides identifies recurrent patterns of cellular interaction.
(A) Representative CODEX whole-slide image of HTAPP-161-SMP-31, showing 3-color overview (using CD56, collagen IV [COLIV] and CD3), imaged using a 52-marker CODEX panel. Insets of two regions are shown with a selected panel of markers typical for B cells (CD19), T cells (CD3, CD4, and CD8), stroma (collagen IV), tumor (CD56), myeloid cells (CD1c, CD11c, and CD15), and cells of ambiguous lineage (Vimentin). (B) Identification of 15 cell neighborhoods (CNs) based on 16 cell types, showing cell type enrichment within each CN (pooled data across 10 CODEX samples). (C) Representative cell type maps from sample HTAPP-116-SMP-31. Cells are colored to match the row legend in panel B. (D) Representative CN map from sample HTAPP-116-SMP-31. Neighborhoods are colored to match the column legend in panel B. (E) Heatmap of likelihood ratios of cell-cell contact between the 16 annotated cell types across the entire HTAPP CODEX cohort (n=10 samples). (F-G) Representative CODEX images of cell contacts between either CD3-positive T cells and CD11c-positive dendritic cells (F) or CD4-positive and CD8-positive T cells (G).
Figure 8.
Figure 8.. High resolution spatial transcriptomics with Slide-SeqV2 demonstrates myeloid reprogramming within neuroblastoma.
(A) Data processing workflow for Slide-Seq v2 data. Slide-SeqV2, after alignment and UMI counting, underwent both cell type decomposition and zero-count imputation. For both analyses, analogous snRNA-seq from the same tumor fragment was employed to define cell types or expression modules. (B) An example Slide-SeqV2 array from HTAPP-102-SMP-11. On the left, an adjacent frozen section was processed by H&E staining. On the right, a Slide-SeqV2 array colored based on cell type after decomposition with RCTD. (C) Magnified view of the HTAPP-102-SMP-11 field-of-view (FOV) #1 from panel B. (D) Comparison of cell composition from snRNA-seq data and Slide-SeqV2 assays. 17 Slide-SeqV2 datasets were generated from 10 specimens. The colors of the bars match up with the legend in panels B and C. (E) Scatterplot comparing the percentage of malignant cell states within single-nucleus RNA-seq data (x-axis; n=10) to the percentage of measured within each decomposed Slide-SeqV2 FOV (y-axis; n=19). (F) Cell-cell interaction cluster-map of cell types showing the frequency that two cell types are adjacent to each other. (G) Tumor-rich and stroma-rich compartments, defined after clustering. Tumor-rich areas were defined as Slide-SeqV2 beads with >50% malignant cell composition while stroma-rich areas were defined as Slide-SeqV2 beads with <50% malignant cell composition. (H) Volcano plot of CSIDE differential expression analysis comparing cell-type expression patterns between tumor-rich and stroma-rich compartments. (I) Bar plot of recurrent myeloid genes that are enriched in tumor-rich myeloid cells or stromal-rich myeloid cells. The y-axis represents the frequency that significant enrichment was detected (out of 13 evaluated FOVs).

References

    1. Chen X., Pappo A., and Dyer M.A. (2015). Pediatric solid tumor genomics and developmental pliancy. Oncogene 34, 5207–5215. - PMC - PubMed
    1. Bedoya-Reina O.C., Li W., Arceo M., Plescher M., Bullova P., Pui H., Kaucka M., Kharchenko P., Martinsson T., Holmberg J., et al. (2021). Single-nuclei transcriptomes from human adrenal gland reveal distinct cellular identities of low and high-risk neuroblastoma tumors. Nature Communications 12. 10.1038/s41467-021-24870-7. - DOI - PMC - PubMed
    1. Dong R., Yang R., Zhan Y., Lai H.-D., Ye C.-J., Yao X.-Y., Luo W.-Q., Cheng X.-M., Miao J.-J., Wang J.-F., et al. (2020). Single-Cell Characterization of Malignant Phenotypes and Developmental Trajectories of Adrenal Neuroblastoma. Cancer Cell 38, 716–733.e6. - PubMed
    1. Kameneva P., Artemov A.V., Kastriti M.E., Faure L., Olsen T.K., Otte J., Erickson A., Semsch B., Andersson E.R., Ratz M., et al. (2021). Single-cell transcriptomics of human embryos identifies multiple sympathoblast lineages with potential implications for neuroblastoma origin. Nat. Genet. 53, 694–706. - PMC - PubMed
    1. Young M.D., Mitchell T.J., Vieira Braga F.A., Tran M.G.B., Stewart B.J., Ferdinand J.R., Collord G., Botting R.A., Popescu D.-M., Loudon K.W., et al. (2018). Single-cell transcriptomes from human kidneys reveal the cellular identity of renal tumors. Science 361, 594–599. - PMC - PubMed

Publication types