[Preprint]. 2024 Jan 10:2024.01.10.574997.
doi: 10.1101/2024.01.10.574997.

Mechanosensitive genomic enhancers potentiate the cellular response to matrix stiffness

Affiliations

Mechanosensitive genomic enhancers potentiate the cellular response to matrix stiffness

Brian D Cosgrove et al. bioRxiv. .

Update in

Abstract

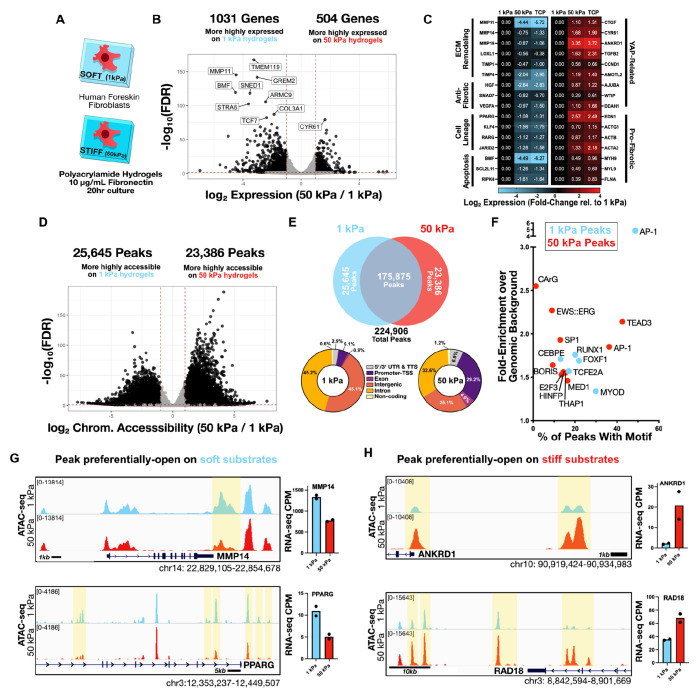
Epigenetic control of cellular transcription and phenotype is influenced by changes in the cellular microenvironment, yet how mechanical cues from these microenvironments precisely influence epigenetic state to regulate transcription remains largely unmapped. Here, we combine genome-wide epigenome profiling, epigenome editing, and phenotypic and single-cell RNA-seq CRISPR screening to identify a new class of genomic enhancers that responds to the mechanical microenvironment. These 'mechanoenhancers' could be active on either soft or stiff extracellular matrix contexts, and regulated transcription to influence critical cell functions including apoptosis, mechanotransduction, proliferation, and migration. Epigenetic editing of mechanoenhancers on rigid materials tuned gene expression to levels observed on softer materials, thereby reprogramming the cellular response to the mechanical microenvironment. These editing approaches may enable the precise alteration of mechanically-driven disease states.


Conflict of interest statement

Competing interests: C.A.G. is a co-founder of Tune Therapeutics and Locus Biosciences, and an advisor to Tune Therapeutics and Sarepta Therapeutics. C.A.G. is an inventor on patents and patent applications related to CRISPR epigenome editing. B.D.C. is an employee of Tune Therapeutics. The remaining authors have no conflicts of interest to declare.

Figures

Fig. 1.
Fig. 1.. Short-term culture on physiologically-soft materials results in broad changes in gene expression and chromatin structure.
(A) To examine the influence of physiologically-soft mechanical microenvironments on the cellular epigenetic state, primary human neonatal fibroblasts (HFF cells) were cultured on soft (Elastic modulus, E=1kPa) or stiff (E= 50kPa) fibronectin-coated polyacrylamide hydrogels for 20 hours. (B) RNA-seq revealed differentially-expressed genes (FDR < 0.01, abs(Log2 Fold-Change)>1), with clusters of differentially-expressed genes highlighted in (C). (D) ATAC-seq revealed differentially-accessible chromatin regions (FDR < 0.01, abs(Log2 Fold-Change)>1) from HFF cells cultured on either soft or stiff hydrogels. (E) Overview and annotations of differentially-accessible chromatin regions across HFF cells cultured on either 1 kPa and 50 kPa hydrogels from the Top 5000 most significantly changing peaks over UTR/TTS, promoter-TSS, exon, intergenic, intronic, or non-coding RNA annotations. (F) Significantly enriched de novo motifs from differentially-accessible regions on 1 kPa or 50 kPa substrates. (G-H) ATAC-seq tracks showing representative regions with significantly lower (MMP14, PPARG) or higher (ANKRD1, RAD18) chromatin accessibility on stiff hydrogels.
Fig. 2.
Fig. 2.. CRISPRi screening reveals a MYH9 intron 3 mechanoenhancer that regulates MYH9 expression and cell contractility.
(A) Expression of MYH9 on soft 1 kPa hydrogels, 50 kPa hydrogels, and TCP from RNA-seq (N=2 reps/group) (B) Schematic of CRISPRi screening procedure for finding genomic regulators of MYH9 protein expression. (C) Individual gRNA enrichment in Low/High MYH9 expression bins following the MYH9 locus screen averaged across two replicates. (D) CRISPRi screening results across the MYH9 locus as shown by MYH9 Repression Phenotype Scores (t-score) and average effect size (z-score) as calculated across each DHS in the screen. Blue points indicate DHS was differentially-accessible in ATAC-seq data between soft/stiff hydrogel conditions across both screen replicates. (E) ATAC-seq signal across the MYH9 intron 3 enhancer region, with the yellow highlight denoting the force-sensitive pRE#1 subregion. (F) Normalized ENCODE H3K37ac signal around differentially-accessible pRE#1 peak from MYH9 intron 3 region compared for 9 available ENCODE tier 1 cell lines. (G) Relative MYH9 RNA expression 10d following lentiviral transduction with dCas9KRAB along with either a non-targeting gRNA, MYH9 intron 3 enhancer-targeting gRNA, or an MYH9 promoter-targeting gRNA. CTL group represents no transduction. (H) Representative F-actin and vinculin focal adhesion immunostaining images and corresponding quantifications (I-K) of focal adhesion morphologic parameters in HFF cells transduced with either a non-targeting or a MYH9 intron 3 enhancer-targeting gRNA (N=39-45 FA/group, ** = p <0.01, **** = p<0.0001 by Studenťs t-test). Red line indicates group means. (L) Schematic of Cas9 nuclease saturation indel screening procedure performed in HFF cells across the MYH9 int3 enhancer region. (M) Plot showing the results of this Cas9 screening, with the ratio of gRNA enrichment in low MYH9 expression bins as compared to high MYH9 expression bins across the MYH9 intron 3 enhancer as well as across non-targeting gRNAs and ENCODE safe-targeting gRNAs. Dots shown are averages across all three replicates. (N-O) gRNA positioning of hit gRNAs relative to the positions of the core SRF CaRG motif (gRNA#24) and HLTF motif (gRNA#43). (P) Relative MYH9 expression during singleton validation of the top three gRNA hits from the screen, six days post-transduction (N=3 reps/group).
Fig. 3.
Fig. 3.. BMF intron #4 mechanoenhancer has increased activity with reduced contractility and is a mediator of anoikis.
(A) BMF RNA expression from RNA-seq across different stiffness conditions in HFF cells (N=2 reps per stiffness condition). (B) ENCODE Tier1 H3K27ac signal and ATAC-seq data between HFF cells cultured on soft and stiff PA hydrogels with regions of differential chromatin accessibility highlighted, with grey highlights indicating regions of differential-accessibility across stiffness contexts. (C) Luciferase enhancer reporter readouts from three of the BMF regions with and without 24hr of 10 μM Y-27632 treatment, showing relative firefly luciferase activity controlled by these enhancers normalized to a control co-transfected renilla luciferase reporter. Box and whisker plots show median, plus indicates the group mean, and bars indicate the top/bottom 10% expression range (N=4 reps/group). (D) Relative RNA expression (N=3) and (E) normalized Caspase-3/7 activity (N=4 reps/group) of HFF cells either untreated, or transduced with various gRNAs, following 0.5 uM LatrunculinA for 24 hours. All data presented as mean +/− SEM and are representative of at least two independent experiments,**** indicates p<0.0001, * indicates p <0.05 by Studen’s t-test. Caspase 3-7 activity and luciferase assay stats are shown compared to the DMSO control group, while RNA expression comparisons are shown by overlay bars. “nt gRNA” abbreviates “non-targeting” gRNA.
Fig. 4.
Fig. 4.. Functional screening of putative mechanosensitive regulatory elements across migration and growth.
(A) Experimental schema for the paired migration and cellular growth screens in HFF cells transduced with a CRISPRi library of 21,498 gRNA corresponding to the top 1000 differentially-accessible ATAC-seq peaks on stiff substrates. (B-C) Migration (B) and growth (C) phenotype Z-scores for the promoter positive controls, the five pREs with the greatest phenotype Z-scores, and the three representative pREs within the top 5 highest Z-scores for the other phenotype. Each dot represents one gRNA targeting a given pRE. Red dashed line indicates a Z-score threshold of two. (D) Venn diagram comparing the pREs that regulated both or only one of the measured phenotypes. (E) Intergenic pRE located near CYR61 that regulated migration (left) and pRE located within an intron of SKP2 that regulated growth (right). H3K4me1, H3K4me3, and H3K27ac signal tracks and peak calls in HFF cells are shown. ATAC-seq from HFF cells cultured on soft (1kPa) and stiff (50kPa) are shown below in blue and red, respectively. Note the scaling of H3K4me1, H3K4me3, and H3K27ac, is different from scaling of ATAC-seq.
Fig. 5.
Fig. 5.. Single cell CRISPRi screen identifies genes regulated by mechanosensitive regulatory elements.
(A) Overview of single cell CRISPRi screen workflow. Briefly, a gRNA library targeting pREs identified in the migration and growth bulk screens was delivered to CRISPRi HFF cells and single cell transcriptomes were profiled eight days later. (B) Volcano plot comparing the change in mRNA expression (avg_logFC) versus the significance (−log10(FDR)) of each gRNA-gene connection. Significant gRNA-gene connections for gRNAs targeting pREs (‘pRE’), positive control gRNAs targeting previously identified enhancers (‘Enhancer’), positive control gRNAs targeting promoter regions (‘Promoter’), and non-targeting gRNAs (‘NT’) are colored as red, purple, green, and black, respectively (FDR < 0.01). Nonsignificant (‘NS’) gRNA-gene connections are colored in light grey. (C) Average logFC of gene expression for MYH9 promoter-targeting positive control gRNAs and intron 3 enhancer-targeting positive control gRNA (grey), the ten migration (yellow) and growth (purple) pREs with greatest effects on gene expression following perturbation. Points shown are individual gRNA-gene linkages corresponding to each pRE, and all regions shown display significant reduction of the target gene (FDR < 0.01). (D) Z-scores of hit gRNA for each pRE from functional screening versus the average logFC of significant gRNA from the same pRE. Points shown for the top 10 pREs by Z-score from functional screening, along with the greatest absolute fold-change of pRE-gene linkages from scRNA-seq screen. (E) Browser track showing pRE-gene connections for a pRE proximal to CTGF, with red and green indicating decrease and increase in gene expression, respectively. Purple shading indicates pRE #740 and green shading indicates promoters of differentially expressed genes. ATAC-seq signal tracks and peaks in HFF cells are shown. (F) CTGF mRNA expression measured via RT-qPCR for individual gRNA validations (non-targeting (‘NT’), N=6; N=3 for all other gRNAs (‘g4’, ‘g8’, ‘g9’)). (G) CPM values for CTGF mRNA expression from bulk RNA-sequencing of HFF cells cultured on 1kPa (N=2), 50kPa (N=2), or TCP (N=2) surfaces. (H) CPM values for chromatin accessibility of CCN2 enhancer in HFF cells cultured on 10ka (N=3), 12kPa (N=3), or 50kPa (N=2), surfaces or cultured on 50kPa surface and treated with ROCKi (Y27) (N=3). (F-H) Individual points represent biological replicates. Error bars represent mean +/− 1 SEM. **** indicates p-value < 0.0001, *** indicates p-value < 0.001, ** indicates p-value < 0.01. (I) Distribution of the difference in effect size for pRE-connected genes versus permuted samples comparing ‘HAS1 High’ Fibroblasts versus all other cell types (‘All’) within IPF lung tissue. One-tailed p-value for permuted samples comparing the mean effect size is shown in the plot. Red dashed line indicates the observed difference between the effect size of the pRE-connected genes and all other genes.

References

    1. Morrison S. J., Spradling A. C., Stem cells and niches: mechanisms that promote stem cell maintenance throughout life. Cell. 132, 598–611 (2008). - PMC - PubMed
    1. Jones D. L., Wagers A. J., No place like home: anatomy and function of the stem cell niche. Nat. Rev. Mol. Cell Biol. 9, 11–21 (2008). - PubMed
    1. Jiang P., Zhang Y., Ru B., Yang Y., Vu T., Paul R., Mirza A., Altan-Bonnet G., Liu L., Ruppin E., Wakefield L., Wucherpfennig K. W., Systematic investigation of cytokine signaling activity at the tissue and single-cell levels. Nat. Methods. 18, 1181–1191 (2021). - PMC - PubMed
    1. Simeonov D. R., Gowen B. G., Boontanrart M., Roth T. L., Gagnon J. D., Mumbach M. R., Satpathy A. T., Lee Y., Bray N. L., Chan A. Y., Lituiev D. S., Nguyen M. L., Gate R. E., Subramaniam M., Li Z., Woo J. M., Mitros T., Ray G. J., Curie G. L., Naddaf N., Chu J. S., Ma H., Boyer E., Van Gool F., Huang H., Liu R., Tobin V. R., Schumann K., Daly M. J., Farh K. K., Ansel K. M., Ye C. J., Greenleaf W. J., Anderson M. S., Bluestone J. A., Chang H. Y., Corn J. E., Marson A., Discovery of stimulation-responsive immune enhancers with CRISPR activation. Nature. 549, 111–115 (2017). - PMC - PubMed
    1. Korkmaz G., Lopes R., Ugalde A. P., Nevedomskaya E., Han R., Myacheva K., Zwart W., Elkon R., Agami R., Functional genetic screens for enhancer elements in the human genome using CRISPR-Cas9. Nat. Biotechnol. 34, 192–198 (2016). - PubMed

Publication types