[Preprint]. 2024 Jan 8:2024.01.07.574148.
doi: 10.1101/2024.01.07.574148.

Concerted neuron-astrocyte gene expression declines in aging and schizophrenia

Affiliations

Concerted neuron-astrocyte gene expression declines in aging and schizophrenia

Emi Ling et al. bioRxiv. .

Update in

  • A concerted neuron-astrocyte program declines in ageing and schizophrenia.
    Ling E, Nemesh J, Goldman M, Kamitaki N, Reed N, Handsaker RE, Genovese G, Vogelgsang JS, Gerges S, Kashin S, Ghosh S, Esposito JM, Morris K, Meyer D, Lutservitz A, Mullally CD, Wysoker A, Spina L, Neumann A, Hogan M, Ichihara K, Berretta S, McCarroll SA. Ling E, et al. Nature. 2024 Mar;627(8004):604-611. doi: 10.1038/s41586-024-07109-5. Epub 2024 Mar 6. Nature. 2024. PMID: 38448582 Free PMC article.

Abstract

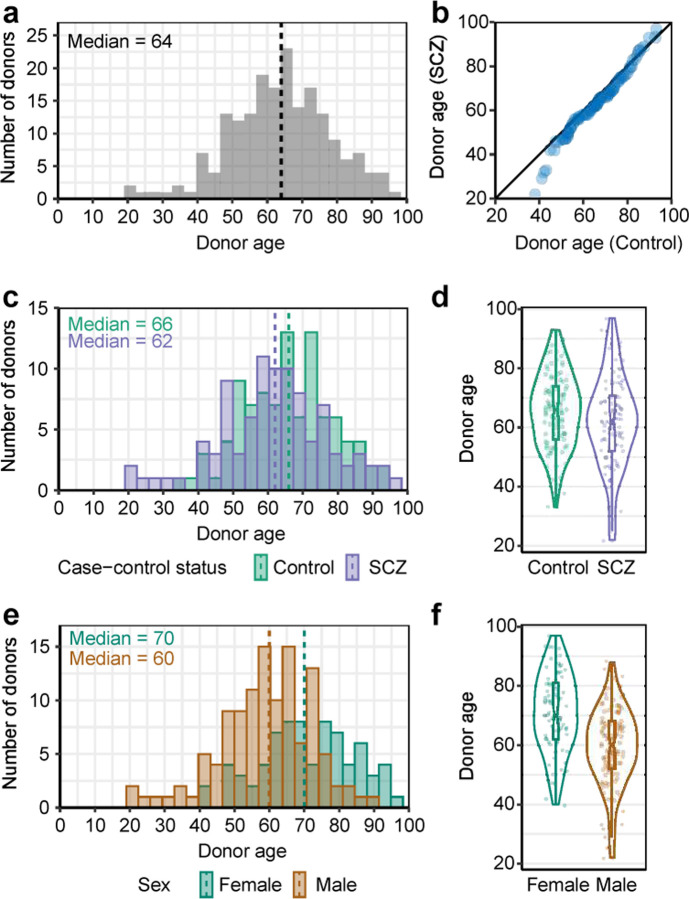
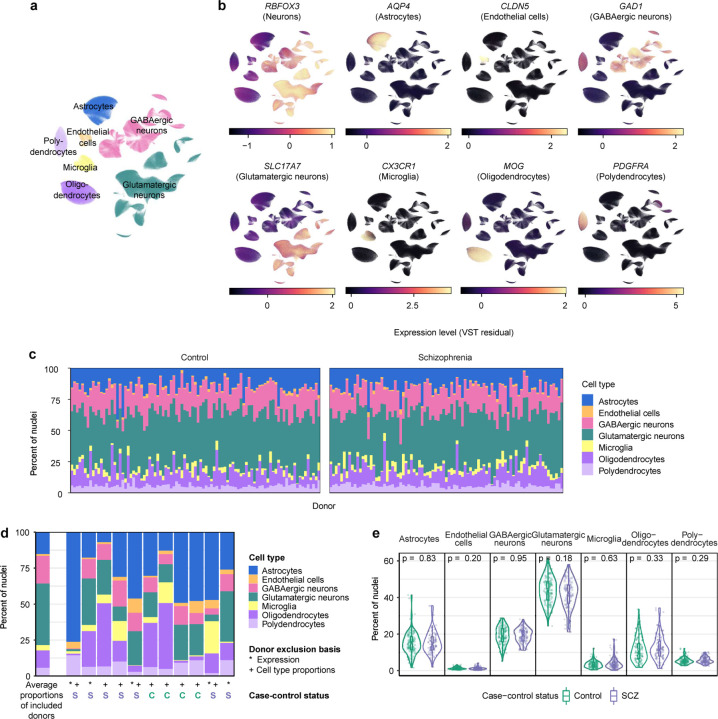
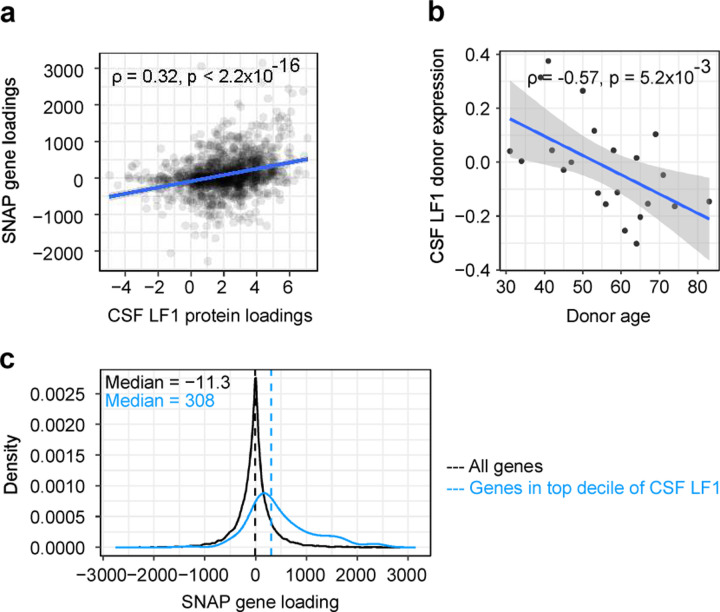
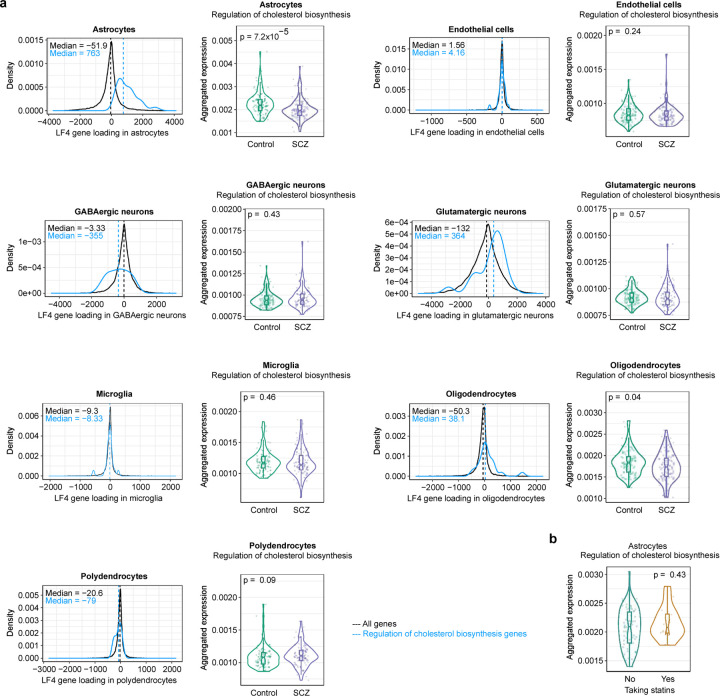
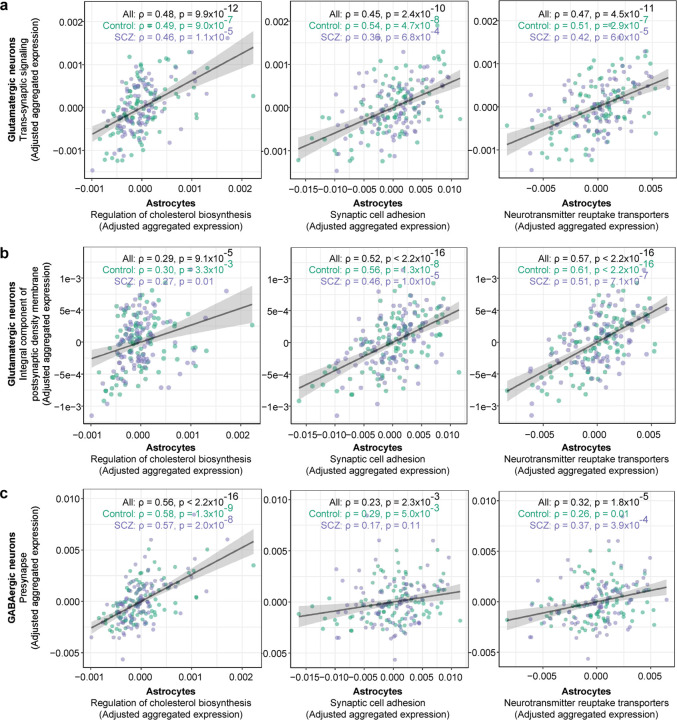
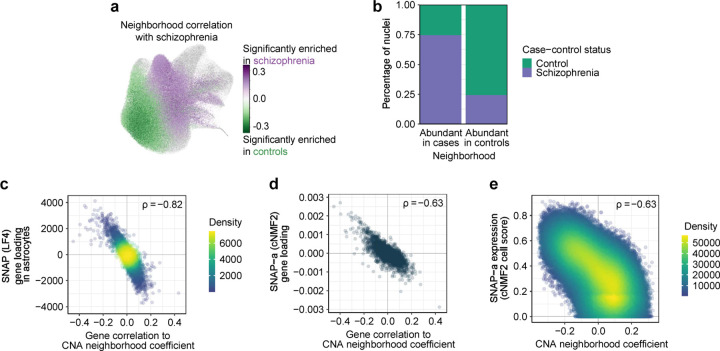
Human brains vary across people and over time; such variation is not yet understood in cellular terms. Here we describe a striking relationship between people's cortical neurons and cortical astrocytes. We used single-nucleus RNA-seq to analyze the prefrontal cortex of 191 human donors ages 22-97 years, including healthy individuals and persons with schizophrenia. Latent-factor analysis of these data revealed that in persons whose cortical neurons more strongly expressed genes for synaptic components, cortical astrocytes more strongly expressed distinct genes with synaptic functions and genes for synthesizing cholesterol, an astrocyte-supplied component of synaptic membranes. We call this relationship the Synaptic Neuron-and-Astrocyte Program (SNAP). In schizophrenia and aging - two conditions that involve declines in cognitive flexibility and plasticity 1,2 - cells had divested from SNAP: astrocytes, glutamatergic (excitatory) neurons, and GABAergic (inhibitory) neurons all reduced SNAP expression to corresponding degrees. The distinct astrocytic and neuronal components of SNAP both involved genes in which genetic risk factors for schizophrenia were strongly concentrated. SNAP, which varies quantitatively even among healthy persons of similar age, may underlie many aspects of normal human interindividual differences and be an important point of convergence for multiple kinds of pathophysiology.


Conflict of interest statement

COMPETING INTERESTS The authors declare no competing interests.

Figures

Extended Data Figure 1.
Extended Data Figure 1.. Ages of brain tissue donors.
a, Distribution of the ages of brain donors (n = 191 donors). b, Distributions of donors’ ages by schizophrenia status, displayed as a quantile-quantile plot that compares ages of unaffected control donors (n = 97 donors) to ages of donors with schizophrenia (n = 94 donors). c-d, Distributions of donors’ ages separated by schizophrenia status (n = 97 unaffected and 94 affected), displayed as (c) histograms and (d) violin plots. e-f, Distributions of donors’ ages, separated by sex (n = 75 women and 116 men), displayed as (e) histograms and (f) violin plots. Note that while female brain donors are on average older than male donors, expression of SNAP (LF4) did not associate with sex in either a naive or age-adjusted analysis (Extended Data Fig. 9d–e), nor in a simultaneous regression on age, sex, and schizophrenia affected/unaffected status (Supplementary Table 3).
Extended Data Figure 2.
Extended Data Figure 2.. Single-donor assignment and sequencing metrics.
a, Validation of the computational assignment of nuclei to individual brain donors whose genomes have been analyzed (individually) by SNP array-genotyping plus imputation. The matrix displays the concordance of single-donor assignment between whole-genome sequencing (WGS) (y-axis) and SNP array + imputation (x-axis) for a pilot set of 11 donors whose genomes were analyzed by both methods. (Accuracy of donor assignment when WGS data are available has been previously shown by .) Each row/column corresponds to one of the 11 donors, and each entry in the table displays the number of nuclei that were assigned to a given donor (at a false discovery rate of 0.05). b, Density plot showing the fraction of all nuclei that were determined to be “singlets” (containing alleles from just one donor); n = 1,262,765 assignable singlets out of 1,271,830). c, Density plot showing donor-assignment likelihoods (as false discovery rates, on a log scale) for the 1,271,830 singlet nuclei. d, Number of nuclei assigned to each donor in each of 11 batches or (rightmost panel) across all batches, separated by schizophrenia case-control status (n = 10 controls and 10 schizophrenia cases per batch). P-values from a two-sided Wilcoxon rank-sum test comparing the affected to the unaffected donors are reported at the top of each panel. Central lines represent medians. e, Median number of UMIs ascertained per donor in each batch or (rightmost panel) across all batches, separated by schizophrenia case-control status (n = 10 controls and 10 schizophrenia cases per batch). P-values from a two-sided Wilcoxon rank-sum test comparing the affected to the unaffected donors are reported at the top of each panel. Central lines represent medians. f, Relationship of median UMIs/nucleus (normalized to the median value of the donors in each donor’s batch) to (top) post-mortem interval (PMI) and (bottom) RIN score (Spearman’s ρ). Colors represent different batches. Shaded regions represent 95% confidence intervals.
Extended Data Figure 3.
Extended Data Figure 3.. Cell-type classification and composition analysis.
a, Two-dimensional projection of the RNA-expression profiles of the 1,218,284 nuclei analyzed from 191 donors, reproduced from Fig. 1c. Nuclei are colored by their assignments to the major cell types present in Brodmann area 46 (BA46). The same projection is used in panel b. b, Expression levels of canonical marker genes of cell types in BA46. Values represent Pearson residuals from variance stabilizing transformation (VST). c, Relative representation of each cell type among nuclei ascertained from each donor. Donors are ordered by their anonymized research IDs at the Harvard Brain Tissue Resource Center. d, Cell-type proportions detected in 11 donors whom we excluded from subsequent analyses, with the basis of exclusion (unusual cell-type proportions and/or expression profiles) indicated under each donor. For comparison, average cell-type proportions of the 180 donors included in subsequent analyses are displayed to the left (donors from panel c). e, Cell-type proportions ascertained in the BA46 tissue samples; data points are separated by schizophrenia status (n = 93 unaffected and 87 affected). P-values from a two-sided Wilcoxon rank-sum test comparing the affected to the unaffected donors are reported at the top of each panel. Box plots show interquartile ranges; whiskers, 1.5x the interquartile interval; central lines, medians; notches, confidence intervals around medians.
Extended Data Figure 4.
Extended Data Figure 4.. Expression of glutamatergic neuron-subtype marker genes.
a, Two-dimensional projection of the RNA-expression profiles of 524,186 glutamatergic neuron nuclei, reproduced from Fig. 1d. Nuclei are colored by their assignments to subtypes of glutamatergic neurons using classifications from and . The same projection is used in panels b to j below. b-j Expression levels of marker genes for subtypes of (b) L2/3 IT, (c) L4 IT, (d) L5 IT, (e) L5 ET, (f) L6 IT-Car3, (g) L5/6 NP, (h) L6 CT, (i) L6b, and (j) L6 IT glutamatergic neurons. Markers are from or from transcriptomically similar subtypes in . Values represent Pearson residuals from variance stabilizing transformation (VST).
Extended Data Figure 5.
Extended Data Figure 5.. Expression of GABAergic neuron-subtype marker genes.
a, Two-dimensional projection of the RNA-expression profiles of 238,311 GABAergic neuron nuclei, reproduced from Fig. 1e. Nuclei are colored by their assignments to subtypes of GABAergic neurons using classifications from and . The same projection is used in panels B to H below. b-h, Expression levels of marker genes for subtypes of (b) PVALB, (c) SST-CHODL, (d) MEIS2, (e) SST, (f) LAMP5, (g) SNCG, and (h) VIP GABAergic neurons. Markers are from or from transcriptomically similar subtypes in . Values represent Pearson residuals from variance stabilizing transformation (VST).
Extended Data Figure 6.
Extended Data Figure 6.. Glutamatergic neuron-subtype composition analysis across donors.
a, Relative representation of each glutamatergic neuron subtype among nuclei ascertained from each donor. Donors are ordered by their anonymized research IDs at the Harvard Brain Tissue Resource Center. b-c, Proportions of (b) glutamatergic neuron subtypes and (c) subtypes of these subtypes (defined in ) by schizophrenia status (n = 93 unaffected and 87 affected). P-values from a two-sided Wilcoxon rank-sum test comparing the affected to the unaffected donors are reported at the top of each panel. Box plots show interquartile ranges; whiskers, 1.5x the interquartile interval; central lines, medians; notches, confidence intervals around medians.
Extended Data Figure 7.
Extended Data Figure 7.. GABAergic neuron-subtype composition analysis across donors.
a, Relative representation of each GABAergic neuron subtype among nuclei ascertained from each donor. Donors are ordered by their anonymized research IDs at the Harvard Brain Tissue Resource Center. b-c, Proportions of (b) GABAergic neuron subtypes and (c) subtypes of these subtypes (defined in ) by schizophrenia status (n = 93 unaffected and 87 affected). P-values from a two-sided Wilcoxon rank-sum test comparing the affected to the unaffected donors are reported at the top of each panel. Box plots show interquartile ranges; whiskers, 1.5x the interquartile interval; central lines, medians; notches, confidence intervals around medians.
Extended Data Figure 8.
Extended Data Figure 8.. Properties of the latent factors inferred from snRNA-seq data.
a, Total % variance in expression explained by latent factors with different numbers of requested factors k. b, Fraction of variance explained by each latent factor in an analysis with 10 requested factors. c-d, Independence of latent factors, visualized as Pearson correlation heatmaps of factors’ (c) gene loadings (n = 125,437 gene/cell-type combinations) and (d) donor scores (n = 180 donors). e, Expression level of each latent factor (panels) in each donor (points), split by batch (n = 20 donors per batch). f, Relationship of latent factors to markers of superficial and deep cortical layers from . Markers label dominant classes of glutamatergic neurons (superficial: LAMP5, LINC00507, RORB; deep: THEMIS, FEZF2) or spatially restricted subtypes (superficial: Exc L2 LAMP5 LTK, marked by CUX2 and LINC01500; deep: Exc L5-6 THEMIS C1QL3, marked by SATB2 and LINC00343). Factor 2 exhibits the most distinct segregation of these superficial and deep layer markers when genes are ranked by their loadings onto each factor. n = 18,830 genes expressed in glutamatergic neurons; colored dots are plotted over the dots of genes not among the markers listed above (grey).
Extended Data Figure 9.
Extended Data Figure 9.. Properties of Latent Factor 4 (LF4).
a, Expression of each latent factor by case-control status (n = 93 controls and 87 cases). P-values are from a two-sided Wilcoxon rank-sum test. Box plots show interquartile ranges; whiskers, 1.5x the interquartile interval; central lines, medians; notches, confidence intervals around medians. b, Expression of LF4 by case-control status, split by sex (female: n = 31 controls and 39 cases; male: n = 62 controls and 48 cases). P-values are from a two-sided Wilcoxon rank-sum test. Box plots show interquartile ranges; whiskers, 1.5x the interquartile interval; central lines, medians; notches, confidence intervals around medians. Note that the more-modest p-value for the females-only analysis relative to the males-only analysis appears to represent the smaller sample (70 females vs. 110 males) rather than a weaker relationship to schizophrenia status; please see also Extended Data Fig. 18h. c, Similar plots as in b, here displaying LF4 expression values adjusted for donor age. d, Expression of LF4 by sex, split by case-control status (controls: n = 31 females and 62 males; cases: n = 39 females and 48 males). P-values are from a two-sided Wilcoxon rank-sum test. Box plots show interquartile ranges; whiskers, 1.5x the interquartile interval; central lines, medians; notches, confidence intervals around medians. e, Similar plots as in d, here displaying LF4 expression values adjusted for donor age. f-k, Relationship of LF4 expression measurements to other available donor and tissue characteristics: (f) time of death in zeitgeber time (ZT), with rhythmicity analyses performed as in ; (g) post-mortem interval; (h) number of nuclei sampled; (i) number of UMIs sampled; (j) use of psychiatric medications (left column) across each donor’s lifespan or (right column) in the last 6 months prior to death; and (k) use of clozapine. Correlation coefficients in g-j are Spearman’s ρ. P-values in k are from a two-sided Wilcoxon rank-sum test. Box plots show interquartile ranges; whiskers, 1.5x the interquartile interval; central lines, medians; notches, confidence intervals around medians. l, Concentrations of the strongest enriched neuronal gene-expression changes in LF4 among synaptic functions as annotated by SynGO . Plots show categories of SynGO biological processes. m, See also Fig. 2a. LF4 involves broadly similar gene-expression effects in glutamatergic and GABAergic neurons, and a distinct set of gene-expression effects in astrocytes. Genes plotted are the protein-coding genes that are expressed (at levels of at least 10 UMIs per 105) in both cell types (Spearman’s ρ; n = 1,538, 1,067, and 1,131 genes respectively).
Extended Data Figure 10.
Extended Data Figure 10.. Robustness of Latent Factor 4 (LF4) to analysis parameters.
LFs similar to LF4 were identified in (a) analyses with different numbers of factors (n = 180 donors), (b) a controls-only analysis (n = 93 donors), and (c) a cases-only analysis (n = 87 donors). a, Column 1: Association of latent-factor expression levels with schizophrenia case-control status, shown as a quantile-quantile plot that compares observed −log10 p-values to the distribution of −log10 p-values expected under a null hypothesis (n = 15, 20, and 30 factors). The observed p-values were calculated for each latent factor by a two-sided Wilcoxon rank-sum test of latent factor expression levels (by donor) between cases and controls. In all analyses, LF4 is the factor that deviates the most from the line of unity and displays the strongest association with schizophrenia case-control status. Column 2: Expression of LF4 by case-control status (n = 93 controls and 87 cases). P-values are from a two-sided Wilcoxon rank-sum test. Box plots show interquartile ranges; whiskers, 1.5x the interquartile interval; central lines, medians; notches, confidence intervals around medians. Shaded regions represent 95% confidence intervals. Column 3: Comparison of gene loadings (n = 125,437 gene/cell-type combinations) that demonstrates the relationship of LF4 inferred from an analysis requesting 10 factors to LF4 inferred from an analysis requesting 15, 20, or 30 factors (Spearman’s ρ). Shaded regions around regression lines represent 95% confidence intervals. Column 4: Comparison of donor expression levels (n = 180 donors) that demonstrates the relationship of LF4 inferred from an analysis requesting 10 factors to LF4 inferred from an analysis requesting 15, 20, or 30 factors (Spearman’s ρ). Shaded regions around regression lines represent 95% confidence intervals. b, Column 1: Comparison of gene loadings from glutamatergic neurons (n = 18,829 genes) that demonstrates the relationship of LF4 inferred from an analysis of all donors to LF1 inferred from an analysis of only control donors (Spearman’s ρ). Shaded regions around regression lines represent 95% confidence intervals. Column 2: Similar plot as in Column 1, here plotting gene loadings from astrocytes (n = 18,346 genes). Column 3: Comparison of donor expression levels (n = 180 donors) that demonstrates the relationship of LF4 inferred from an analysis of all donors to LF1 inferred from an analysis of only control donors (Spearman’s ρ). Shaded regions around regression lines represent 95% confidence intervals. c, Similar plots as in b, here for the relationship of LF4 inferred from an analysis of all donors to LF4 inferred from an analysis of only donors with schizophrenia.
Extended Data Figure 11.
Extended Data Figure 11.. Latent factor analysis of cerebrospinal fluid (CSF) proteomics data from different individuals identifies a factor resembling SNAP.
To assess the biological significance of SNAP, we also sought evidence that SNAP manifests in the proteins that can be sampled from cerebrospinal fluid (CSF). We analyzed available data from a mass-spectrometry proteomics analysis of cerebrospinal fluid (CSF) from 22 healthy human donors , performing a latent factor analysis that is conceptually analogous to our analysis (in Fig. 1f) of cell-type-specific RNA-expression measurements in the brain donors (but of an independent data set, derived from a distinct set of donors). The top latent factor in analysis of the CSF proteomics data (explaining >15% of inter-individual variation in CSF protein measurements) bore a strong resemblance to SNAP. a, Relationship of SNAP gene loadings to the top latent factor in an analysis of inter-individual variation in CSF protein levels (CSF LF1) using quantitative protein abundance measurements from (Spearman’s ρ; n = 1,341 genes/proteins shared between both analyses). For SNAP, each gene is represented by a single composite loading representing gene loadings from all cell types (weighted by its median expression in each cell type). Shaded region represents 95% confidence interval. b, Relationship of CSF LF1 donor scores to age (Spearman’s ρ; n = 22 donors). Shaded region represents 95% confidence interval. c, Density plot showing distribution of SNAP gene loadings for (black) all genes and genes encoding proteins that are strongly recruited (top decile) by (blue) CSF LF1. Distributions were found to be different by Wilcox test (p = 2.1x10⁻²⁸, two-sided Wilcoxon rank-sum test).
Extended Data Figure 12.
Extended Data Figure 12.. Relationship of synaptic vesicle cycle gene expression in neuronal subtypes to advancing age.
a-b, See also Fig. 2c. Neuronal expression of synaptic vesicle cycle genes in the most abundant subtypes of (a) glutamatergic and (b) GABAergic neurons (across 180 donors), plotted against donor age (Spearman’s ρ). Expression values are the fraction of all UMIs in each donor (from the indicated subtype) that are derived from these genes, normalized to the median expression among control donors. Shaded regions represent 95% confidence intervals. The observed decline in schizophrenia and aging was consistent with earlier observations that expression of genes for synaptic components is reduced in schizophrenia and with advancing age .
Extended Data Figure 13.
Extended Data Figure 13.. Relationship of gene-set expression in astrocytes and neurons to advancing age and schizophrenia.
a, Expression of gene sets enriched in the astrocyte and neuronal components of LF4 (across 180 donors), plotted against donor age (Spearman’s ρ). Expression values are the fraction of all UMIs in each donor (from the indicated cell type) that are derived from these genes, normalized to the median expression among control donors. Shaded regions represent 95% confidence intervals. b, Expression (by donor, separated by schizophrenia case-control status; n = 180 donors) of gene sets enriched in the astrocyte and neuronal components of LF4. Expression values are the fraction of all UMIs in each donor (from the indicated cell type) that are derived from these genes, adjusted for donor age. P-values from a two-sided Wilcoxon rank-sum test comparing the affected to the unaffected donors are reported at the top of each panel. Box plots show interquartile ranges; whiskers, 1.5x the interquartile interval; central lines, medians; notches, confidence intervals around medians.
Extended Data Figure 14.
Extended Data Figure 14.. Expression of cholesterol-biosynthesis genes in cortical cell types.
a, See also Fig. 2d. For each cortical cell type: (Left) Distributions of LF4 gene loadings for (black) all expressed genes and (blue) specifically for genes annotated by GO as having roles in cholesterol biosynthesis (core genes contributing to the enrichment of GO:0045540 (“cholesterol biosynthesis genes”) in that cell type’s component of LF4. (Right) Each cell type’s expression of cholesterol biosynthesis genes (by donor, split by schizophrenia case-control status; n = 180 donors). Expression values are the fraction of all UMIs in each donor (from the indicated cell type) that are derived from these genes. P-values are from a two-sided Wilcoxon rank-sum test comparing the affected to the unaffected donors. Box plots show interquartile ranges; whiskers, 1.5x the interquartile interval; central lines, medians; notches, confidence intervals around medians. b, Expression in astrocytes of cholesterol biosynthesis genes by donor, separated by statin intake among donors with available medication data (n = 63 donors not taking statins and 16 donors taking statins). Expression values are the fraction of all UMIs in each donor’s astrocytes that are derived from these genes. P-value is from a two-sided Wilcoxon rank-sum test. Box plots show interquartile ranges; whiskers, 1.5x the interquartile interval; central lines, medians; notches, confidence intervals around medians.
Extended Data Figure 15.
Extended Data Figure 15.. Concerted synaptic investments by neurons and astrocytes.
See also Fig. 2e. a, Relationship of donors’ glutamatergic-neuron expression of genes that are integral components of the postsynaptic density membrane (core genes contributing to the enrichment of GO:0099061) to astrocyte expression of (top) cholesterol biosynthesis, (middle) synaptic adhesion, and (bottom) neurotransmitter reuptake transporters (Spearman’s ρ). Expression values are the fraction of all UMIs in each donor (from the indicated cell type) that are derived from these genes, normalized to the median expression among control donors. Shaded regions represent 95% confidence intervals. b, Similar plots as in a, here for donors’ GABAergic-neuron expression of presynapse genes (core genes contributing to the enrichment of GO:0098793) on the x-axis.
Extended Data Figure 16.
Extended Data Figure 16.. Concerted synaptic investments by neurons and astrocytes, adjusted for age and schizophrenia case-control status.
a-c See also Fig. 2e. Relationship of donors’ neuronal gene expression to astrocyte gene expression (Spearman’s ρ), adjusted for age and case-control status. Astrocyte gene sets plotted on the x-axes represent (left) cholesterol biosynthesis, (middle) synaptic adhesion, and (right) neurotransmitter reuptake transporters. Neuronal gene sets plotted on the y-axes represent (a) trans-synaptic signaling in glutamatergic neurons, (b) integral component of postsynaptic density, and (c) presynapse genes. Expression values are the fraction of all UMIs in each donor (from the indicated cell type) that are derived from these genes, adjusted for donor age and schizophrenia case-control status. Shaded regions represent 95% confidence intervals.
Extended Data Figure 17.
Extended Data Figure 17.. Astrocyte subtype classification and proportions across donors.
a, Two-dimensional projection of the RNA-expression profiles of 179,764 astrocyte nuclei from 180 donors, reproduced from Fig. 3a. Nuclei are colored by their assignments to subtypes of astrocytes using classifications from and . The same projection is used in panels B to D below. b-d, Expression levels of marker genes for subtypes of (b) protoplasmic astrocytes (SLC1A3+) and non-protoplasmic astrocytes (SLC1A3- and GFAP+) comprising the (c) fibrous (AQP1+) and (d) interlaminar (AQP1- and ID3+, SERPINI2+, and WDR49+) subtypes. Markers are from or from transcriptomically similar subtypes in . Values represent Pearson residuals from variance stabilizing transformation (VST). e, Proportions of astrocyte subtypes in BA46 by schizophrenia status (n = 93 unaffected and 87 affected). P-values from a two-sided Wilcoxon rank-sum test comparing the affected to the unaffected donors are reported at the top of each panel. Box plots show interquartile ranges; whiskers, 1.5x the interquartile interval; central lines, medians; notches, confidence intervals around medians. f, Relationship of sampled astrocyte subtype proportions to donor age (Spearman’s ρ).
Extended Data Figure 18.
Extended Data Figure 18.. Astrocyte gene-expression programs inferred by cNMF (SNAP-a) and their relationship to SNAP.
a, Visualization of the trade-off between error and stability of cNMF factors as a function of the number of factors k. 11 factors were requested based on these results. b, Clustergram of consensus matrix factorization estimates. Each color on the x- and y-axes represents one of 11 cNMF factors. c-d, Relationship of SNAP-a to SNAP by (c) gene loadings (n = 33,611 genes) and (d) donors’ expression levels of each factor (n = 180 donors) (Spearman’s ρ). Shaded regions represent 95% confidence intervals. e, UMAP of RNA-expression patterns from 179,764 astrocyte nuclei from 180 donors, using the same projection from Fig. 3a–c. Nuclei are colored by (left) each donor’s expression of SNAP or (right) each cell’s expression of the astrocyte component of SNAP (cNMF2, also referred to as SNAP-a). SNAP-a is reproduced from Fig. 3c for comparison with SNAP. f, Distributions of SNAP-a expression levels among astrocytes in each donor, split by experimental batch. Box plots show interquartile ranges; whiskers, 1.5x the interquartile interval; central lines, medians. g, Density plots showing distributions of SNAP-a expression levels among astrocytes in each donor for one representative batch (batch 4) out of 11 batches. Labels in top-right corners indicate anonymized research IDs at the Harvard Brain Tissue Resource Center. Colors represent case-control status (green: controls; purple: schizophrenia cases). At the single-astrocyte level, SNAP-a expression exhibited continuous, quantitative variation rather than discrete state shifts by a subpopulation of astrocytes, supporting the idea that astrocyte biological variation extends beyond polarized states ,,. h, Distributions of SNAP-a expression levels by case-control status, split by sex. P-values from a two-sided Wilcoxon rank-sum test comparing the affected to the unaffected donors are reported at the top of each panel. Box plots show interquartile ranges; whiskers, 1.5x the interquartile interval; central lines, medians; notches, confidence intervals around medians. i, Distributions of SNAP-a expression levels by case-control status, split by astrocyte subtype. P-values from a two-sided Wilcoxon rank-sum test comparing the affected to the unaffected donors are reported at the top of each panel. Box plots show interquartile ranges; whiskers, 1.5x the interquartile interval; central lines, medians; notches, confidence intervals around medians.
Extended Data Figure 19.
Extended Data Figure 19.. Identification of astrocyte transcriptional neighborhoods associated with schizophrenia case-control status by co-varying neighborhood analysis.
To further assess the robustness of the astrocyte gene-expression changes represented by SNAP and SNAP-a, we employed a third computational approach, co-varying neighborhood analysis (CNA) . a, Same projection as in Fig. 3a–c, but with points colored according to their transcriptional neighborhood’s correlation to schizophrenia case-control status (n = 179,764 astrocyte nuclei from 180 donors). Among cells whose neighborhood coefficients passed an FDR < 0.05 threshold for association, purple indicates high correlation to case status and green indicates high correlation to control status. All other cells with FDR > 0.05 for association are colored in gray. b, Proportion of nuclei in each of the indicated astrocyte transcriptional neighborhoods that are assigned to schizophrenia cases and controls (n = 34,271 nuclei abundant in cases and 38,327 nuclei abundant in controls). c-d, Relationship of genes’ correlation to schizophrenia-associated transcriptional neighborhoods to (c) the astrocyte component of SNAP (n = 8,997 shared genes) and (d) SNAP-a by their gene loadings (n = 9,015 shared genes) (Spearman’s ρ). Genes plotted are the subsets of protein-coding genes (with expression levels of at least 1 UMI per 105) that are shared between the indicated pairs of analyses. e, Relationship of cell-level neighborhood coefficients for schizophrenia-associated transcriptional neighborhoods to SNAP-a cell scores (Spearman’s ρ; n = 179,764 astrocytes).
Extended Data Figure 20.
Extended Data Figure 20.. Expression across cell types of genes most strongly recruited by SNAP-a.
Expression in each cell type (by donor, separated by schizophrenia status), of the 20 genes that are most strongly recruited by SNAP-a (n = 93 unaffected (green) and 87 affected (purple) donors). These included eight genes with roles in adhesion of cells to synapses (NRXN1, NTM, CTNND2, LSAMP, GPM6A, LRRC4C, LRRTM4, and EPHB1) (as established by earlier work including and reviewed in ,). P-values from a two-sided Wilcoxon rank-sum test comparing the affected to the unaffected donors are reported at the top of each panel. Box plots show interquartile ranges; whiskers, 1.5x the interquartile interval; central lines, medians; notches, confidence intervals around medians. Genes that have been strongly implicated in human genetic studies of schizophrenia are highlighted in blue. Genes with known functions in synaptic adhesion (listed above) or neurotransmitter uptake (SLC1A2) are underlined.
Extended Data Figure 21.
Extended Data Figure 21.. Relationship of reactive astrocyte marker expression to SNAP-a expression.
Relationship of donors’ expression levels of reactive astrocyte marker genes to SNAP-a expression (Spearman’s ρ). Markers are from and represent (a) pan-reactive (PAN), (b) A1, and (c) A2 reactive astrocytes.
Extended Data Figure 22.
Extended Data Figure 22.. Biological states and transcriptional programs of L5 IT glutamatergic neurons in schizophrenia.
a-b, Relationship of SNAP-a to SNAP-n (Spearman’s ρ). Values plotted are (a) quantile-normalized and (b) donor age-adjusted, quantile-normalized donor scores for each factor. Shaded regions represent 95% confidence intervals. c, UMAP of regulon activity scores (as inferred by pySCENIC ) from L5 IT glutamatergic neuron nuclei from 180 donors, using the same projection from Fig. 3f–h. Regulons plotted are the most strongly enriched in L5 IT glutamatergic neurons with high versus low SNAP-n expression. (+) indicates that the targets of the indicated regulon were found to be upregulated in expression.
Extended Data Figure 23.
Extended Data Figure 23.. Expression across cell types of genes most strongly recruited by SNAP-n.
Expression in each cell type (by donor, separated by schizophrenia case-control status) of the 20 genes that are most strongly recruited by SNAP-n (n = 93 controls and 87 cases). P-values from a two-sided Wilcoxon rank-sum test comparing the affected to the unaffected donors are reported at the top of each panel. Box plots show interquartile ranges; whiskers, 1.5x the interquartile interval; central lines, medians; notches, confidence intervals around medians. Genes that have been strongly implicated in human genetic studies of schizophrenia are highlighted in blue.
Extended Data Figure 24.
Extended Data Figure 24.. Astrocyte gene-expression programs underlying SNAP-a.
a, See also Fig. 3k. Concerted expression in (left) astrocytes and (right) GABAergic neurons of genes strongly recruited by SNAP-a. These were enriched in genes encoding synaptic-adhesion proteins, intrinsic components of synaptic membranes such as transporters and receptors, as well as genes strongly implicated in human genetic studies of schizophrenia. Genes in the “Schizophrenia genetics” heatmap are from among the prioritized genes from (FDR < 0.05) or . Genes annotated by ^ are from among all genes at loci implicated by common variants in , regardless of prioritization status. b, UMAP of regulon activity scores (as inferred by pySCENIC ) from 179,764 astrocyte nuclei from 180 donors, using the same projection from Fig. 3a–c. Regulons plotted are the most strongly enriched in astrocytes with high versus low SNAP-a expression. (+) indicates that the targets of the indicated regulon are predicted to be upregulated in expression. c-d, Transcriptional investments (by donor, separated by schizophrenia case-control status) in (c) genes encoding synaptic receptors and transporters and (d) cholesterol biosynthesis genes, in subtypes of astrocytes. Quantities plotted are the fraction of all UMIs in each subtype that are derived from these genes. P-values from a two-sided Wilcoxon rank-sum test comparing the affected to the unaffected donors are reported at the top of each panel. Box plots show interquartile ranges; whiskers, 1.5x the interquartile interval; central lines, medians; notches, confidence intervals around medians. e, Relationship of SNAP-a expression to association with super-enhancers. Genes expressed in astrocytes were grouped based on whether their promoters were predicted to contact super-enhancers in astrocytes (using bulk H3K27ac HiChIP and scATAC-seq data from ), and SNAP-a loadings were compared between the two groups. (Left) Distributions of SNAP-a gene loadings for (blue) 1,286 genes whose promoters are predicted to contact super-enhancers in astrocytes and (black) the set of 32,325 remaining expressed background genes. (Right) Binomial smooth results of scaled SNAP-a gene loadings versus log10-scaled mean expression values in astrocytes, shown separately for the two groups. Shaded regions represent 95% confidence intervals.
Extended Data Figure 25.
Extended Data Figure 25.. Expression of well-characterized transcriptional programs in SNAP-a and SNAP-n.
a, Concerted expression in (left) astrocytes and (right) L5 IT glutamatergic neurons of target genes of known transcriptional programs specifically active in SNAP-a or SNAP-n. Genes are listed in decreasing order by their importance for each regulon as scored by pySCENIC. b, Relationship of donors’ expression levels of known SREBP1 target genes (involved in fatty acid biosynthesis) ,, to SNAP-a expression (Spearman’s ρ). Target-gene expression levels in astrocytes are shown. c, Relationship of donors’ expression levels of known JUNB target genes (that are late-response genes) ,, to SNAP-n expression (Spearman’s ρ). Target-gene expression levels in L5 IT glutamatergic neurons are shown.
Extended Data Figure 26.
Extended Data Figure 26.. Heritability enrichment for 26 traits among the top 2,000 astrocyte-identity or astrocyte-activity (SNAP-a) genes.
Heritability enrichment analysis for the indicated phenotypes in regions surrounding (a) the 2,000 genes most preferentially expressed in astrocytes compared to other cell types or (b) the 2,000 genes most strongly recruited by SNAP-a in astrocytes. Summary statistics are from the following studies: ADHD , age of smoking initiation , ALS , Alzheimer’s disease , autism , bipolar disorder (all, type I, and type II) , cigarettes per day , educational attainment , epilepsy (all, focal, generalized) , height , insomnia , IQ , neuroticism , OCD , PTSD , risk , schizophrenia , smoking cessation , smoking initiation , subjective well-being , Tourette’s , ulcerative colitis .
Extended Data Figure 27.
Extended Data Figure 27.. Calculation of polygenic risk scores for schizophrenia.
a, Association of polygenic risk scores (PRS) for schizophrenia (from PGC3 GWAS, ) with schizophrenia case-control status, displayed as a quantile-quantile plot that compares PRS of control donors to the PRS of donors with schizophrenia (n = 191 donors). b, Distributions of schizophrenia PRS for 94 schizophrenia cases and 97 controls. P-value is from a two-sided Wilcoxon rank-sum test. Box plots show interquartile ranges; whiskers, 1.5x the interquartile interval; central lines, medians; notches, confidence intervals around medians. c, See also Fig. 4b. Relationship of inter-individual variation in expression of each of the 10 latent factors inferred by PEER (donor scores, quantile-normalized) to donors’ polygenic risk scores (PRSs) for schizophrenia (Spearman’s ρ; PGC3 GWAS from ). Shaded regions represent 95% confidence intervals. The observed relationship of schizophrenia PRS to expression of LF4 – which associates with schizophrenia and aging – is consistent with previous observations that a PRS for schizophrenia also associates with decreased measures of cognition in older individuals and with psychosis in Alzheimer’s Disease .
Extended Data Figure 28.
Extended Data Figure 28.. Relationship of astrocytic NRXN1 and C4 expression to advancing age.
a, Relationship of NRXN1 expression to age in astrocytes (Spearman’s ρ). Shaded region represents 95% confidence interval. b, Expression of NRXN1 in astrocytes in control donors, split by donor age (n = 56 donors younger than 70 years old and 37 donors 70 years old or older). P-value is from a two-sided Wilcoxon rank-sum test. Box plots show interquartile ranges; whiskers, 1.5x the interquartile interval; central lines, medians; notches, confidence intervals around medians. c, Validation of a metagene computational approach for identifying RNA transcripts (UMIs) from the C4 genes. Standard analysis approaches tend to discard sequence reads from C4A or C4B because these genes are almost identical in sequence, differing only at a few key positions (far from the 3’ end), such that most reads are discarded due to low mapping quality. To measure expression of these genes, UMIs were either aligned to a custom reference genome that contained only one C4 gene (x-axis) or were processed through a custom pipeline that identified UMIs associated with sets of gene families with high sequence homology, including C4A/C4B (y-axis). The two approaches (custom reference approach and joint expression of C4A/C4B via the metagene approach) arrived at concordant C4 UMI counts in 15,664 of 15,669 cells tested. Note that these measurements do not distinguish between C4A and C4B. d, Relationship of C4 expression to age in astrocytes (Spearman’s ρ). Shaded region represents 95% confidence interval. e, Expression of C4 in astrocytes in control donors, split by donor age (n = 56 donors younger than 70 years old and 37 donors 70 years old or older). P-value is from a two-sided Wilcoxon rank-sum test. Box plots show interquartile ranges; whiskers, 1.5x the interquartile interval; central lines, medians; notches, confidence intervals around medians.
Figure 1.
Figure 1.. Identification of concerted multi-cellular gene-expression changes common to schizophrenia and aging.
a, Generation of snRNA-seq data, in a series of 20-donor “villages”. b, Uniform manifold approximation and projection (UMAP, colored by donor) of the RNA-expression profiles of the 1,218,284 nuclei analyzed from 191 donors. c, Assignments of nuclei to cell types (same projection as in b). d-e, Assignments of nuclei to (d) glutamatergic (n = 524,186) and (e) GABAergic (n = 238,311) neuron subtypes. f, Latent factor analysis. Cell-type-resolution expression data from all donors and cell types were combined into a single analysis. Latent factor analysis identified constellations of gene-expression changes that consistently appeared together. g, Cell type-specificity of the latent factors inferred from 180 donors, shown as cell-type distributions of the 1,000 most strongly loading gene/cell-type combinations per factor. Factors 4–7 and 10 are strongly driven by gene-expression co-variation spanning multiple cell types. h, Association of schizophrenia with inter-individual variation in the expression levels of the ten latent-factors in Fig. 1g, shown as a quantile-quantile plot comparing the ten factors’ observed schizophrenia associations (−log10 p-values) to the distribution of association statistics expected by chance; only LF4 significantly associates with schizophrenia. See also Extended Data Fig. 10. i, Relationship of quantile-normalized Latent Factor 4 (LF4) donor expression levels to age (Spearman’s ρ; n = 180 donors). Shaded regions represent 95% confidence intervals. j, Quantile-normalized LF4 donor scores (n = 93 controls, 87 cases), adjusted for age. P-value is from a two-sided Wilcoxon rank-sum test. In the violin plot, boxes show interquartile ranges; whiskers, 1.5x the interquartile interval; central lines, medians; notches, confidence intervals around medians.
Figure 2.
Figure 2.. A Synaptic Neuron-Astrocyte Program (SNAP) revealed by Latent Factor 4 (LF4).
a, Comparisons of SNAP gene recruitment between cell types. Shown, in each pairwise cell-type comparison, are the latent-factor (LF4) gene loadings of all genes expressed (≥ 1 UMI per 105) in both cell types in the comparison (Spearman’s ρ; n = 10,346, 11,232, 11,217 genes respectively). b, Concentrations of synaptic gene sets (as annotated by SynGO) in LF4’s neuronal components. c, Fraction of gene expression (UMIs) devoted to synaptic vesicle-cycle genes in subtypes of glutamatergic and GABAergic neurons, across 180 donors. P-values for case-control comparisons are from a two-sided Wilcoxon rank-sum test. Box plots show interquartile ranges; whiskers, 1.5x the interquartile interval; central lines, medians; notches, confidence intervals around medians. d, Left, distributions of astrocytes’ LF4 gene loadings for (black) all expressed genes (n = 18,347) and (blue) genes annotated for functions in cholesterol biosynthesis (n = 21) (hereafter referred to as “cholesterol biosynthesis” genes according to their GO annotation, though subsets contribute to cholesterol export and/or to synthesis of additional fatty acids). Right, proportion of astrocytic gene expression devoted to the annotated cholesterol biosynthesis genes shown, across 180 donors. P-value is from a two-sided Wilcoxon rank-sum test. Box plots show interquartile ranges; whiskers, 1.5x the interquartile interval; central lines, medians; notches, confidence intervals around medians. e, Concerted gene-expression variation in neurons and astrocytes. Relationships (across 180 donors) of astrocytic gene expression related to three biological activities (synapse adhesion, neurotransmitter uptake, cholesterol biosynthesis) to neuronal gene expression related to synapses (Spearman’s ρ). Quantities plotted are the fraction of all detected nuclear mRNA transcripts (UMIs) derived from these genes in each donor’s astrocytes (x-axis) or neurons (y-axis), relative to the median expression among control donors. Shaded regions represent 95% confidence intervals for the estimated slopes.
Figure 3.
Figure 3.. Biological states and transcriptional programs of astrocytes and L5 IT glutamatergic neurons in schizophrenia.
a-c, UMAP of RNA-expression patterns from 179,764 astrocyte nuclei from 180 donors. Nuclei are colored by (a) astrocyte subtype, (b) schizophrenia affected/unaffected status, and (c) expression of the astrocyte component of SNAP (referred to as SNAP-a). d, Relationship of donors’ quantile-normalized SNAP-a expression scores to age (Spearman’s ρ; n = 180 donors). Shaded regions represent 95% confidence intervals. e, Distributions of SNAP-a donor scores (age-adjusted and quantile-normalized) for persons with and without schizophrenia (n = 93 controls, 87 cases). P-value is from a two-sided Wilcoxon rank-sum test. Box plots show interquartile ranges; whiskers, 1.5x the interquartile interval; central lines, medians; notches, confidence intervals around medians. f-j, Similar plots as in a-e for the L5 IT glutamatergic neuron contribution to SNAP (referred to as SNAP-n; n = 75,929 nuclei). k, Heatmap showing variation in expression levels of a select set of strongly SNAP-recruited genes across the astrocytes (left) and glutamatergic neurons (right) of 180 brain donors, who are ordered from left to right by SNAP expression levels, in both the left and right panels. One set of genes (SNAP-a, above) exhibits co-regulation in astrocytes; a distinct set of genes (SNAP-n, below) exhibits co-regulation in neurons. Genes annotated by ^ are at genomic loci implicated by common genetic variation in schizophrenia . Gray bars indicate that regulon activity was not detected.
Figure 4.
Figure 4.. Relationship of SNAP to schizophrenia genetics.
a, Enrichment of schizophrenia genetic association (from common variants, using MAGMA to generate a schizophrenia association Z-score for each gene) in the 2,000 genes most preferentially expressed in glutamatergic neurons and astrocytes, or the 2,000 genes whose expression is most strongly recruited by SNAP-n and SNAP-a. Values plotted are −log 10 p-values from a joint regression analysis in which each gene set is an independent and competing predictive factor. See also Supplementary Note. b, Relationship of donors’ SNAP expression (quantile-normalized) to donors’ schizophrenia polygenic risk scores (Spearman’s ρ; n = 180 donors; PGC3 GWAS from ). Shaded regions represent 95% confidence intervals. c, NRXN1 expression (per 105 detected nuclear transcripts) in each cell type in individual donors (n = 93 controls, 87 cases). P-values are from a two-sided Wilcoxon rank-sum test. Box plots show interquartile ranges; whiskers, 1.5x the interquartile interval; central lines, medians; notches, confidence intervals around medians. d, Left, NRXN1 expression in individual astrocytes (using the same projection as in Fig. 3a–c). Values represent Pearson residuals from variance stabilizing transformation. Right, relationship of the 180 donors’ NRXN1 expression in astrocytes to SNAP-a expression (Spearman’s ρ). e-f, Similar plots as in c-d, here for complement component 4 (C4).

References

    1. McCutcheon R. A., Keefe R. S. E. & McGuire P. K. Cognitive impairment in schizophrenia: aetiology, pathophysiology, and treatment. Mol. Psychiatry 28, 1902–1918 (2023). - PMC - PubMed
    1. Harada C. N., Natelson Love M. C. & Triebel K. L. Normal cognitive aging. Clin. Geriatr. Med. 29, 737–752 (2013). - PMC - PubMed
    1. Mackay T. F. C., Stone E. A. & Ayroles J. F. The genetics of quantitative traits: challenges and prospects. Nat. Rev. Genet. 10, 565–577 (2009). - PubMed
    1. Makowski C. et al. Discovery of genomic loci of the human cerebral cortex using genetically informed brain atlases. Science 375, 522–528 (2022). - PMC - PubMed
    1. Eling N., Morgan M. D. & Marioni J. C. Challenges in measuring and understanding biological noise. Nat. Rev. Genet. 20, 536–548 (2019). - PMC - PubMed
METHODS REFERENCES
    1. Sullivan K. et al. What can we learn about brain donors? Use of clinical information in human postmortem brain research. Handb. Clin. Neurol. 150, 181–196 (2018). - PMC - PubMed
    1. Weinberger D. R., Berman K. F. & Zec R. F. Physiologic dysfunction of dorsolateral prefrontal cortex in schizophrenia. I. Regional cerebral blood flow evidence. Arch. Gen. Psychiatry 43, 114–124 (1986). - PubMed
    1. Perlstein W. M., Carter C. S., Noll D. C. & Cohen J. D. Relation of prefrontal cortex dysfunction to working memory and symptoms in schizophrenia. Am. J. Psychiatry 158, 1105–1113 (2001). - PubMed
    1. Macosko E. Z. et al. Highly Parallel Genome-wide Expression Profiling of Individual Cells Using Nanoliter Droplets. Cell 161, 1202–1214 (2015). - PMC - PubMed
    1. Fleming S. J. et al. Unsupervised removal of systematic background noise from droplet-based single-cell experiments using CellBender. Nat. Methods (2023) doi:10.1038/s41592-023-01943-7. - DOI - PubMed

Publication types