[Preprint]. 2024 Jan 9:2024.01.09.574739.
doi: 10.1101/2024.01.09.574739.

Lupus-associated innate receptors drive extrafollicular evolution of autoreactive B cells

Affiliations

Lupus-associated innate receptors drive extrafollicular evolution of autoreactive B cells

Danni Yi-Dan Zhu et al. bioRxiv. .

Abstract

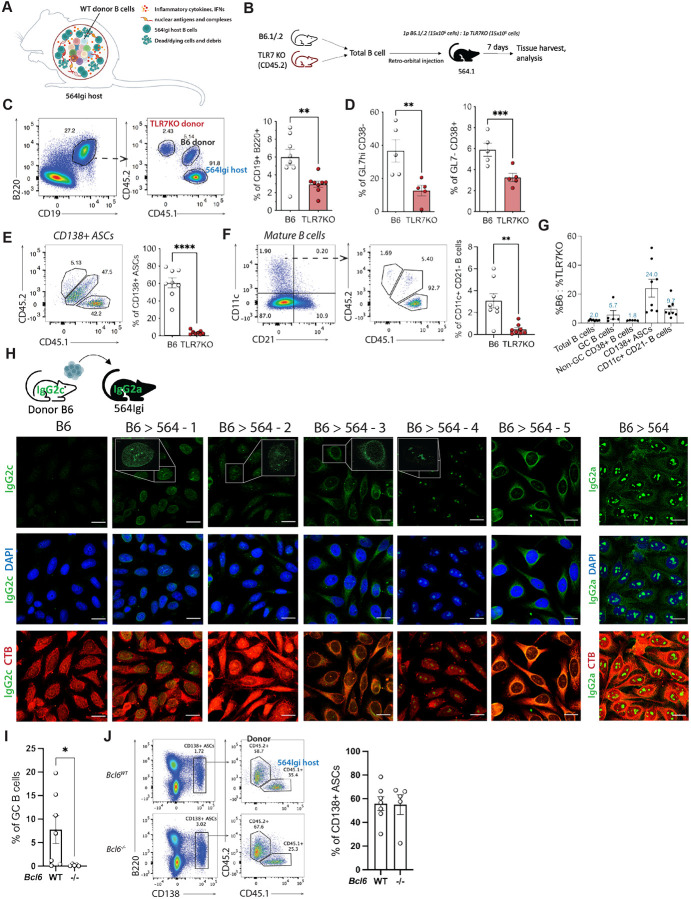
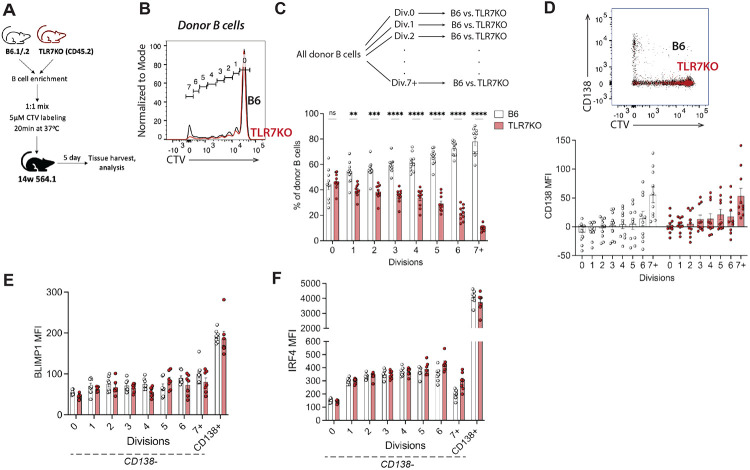
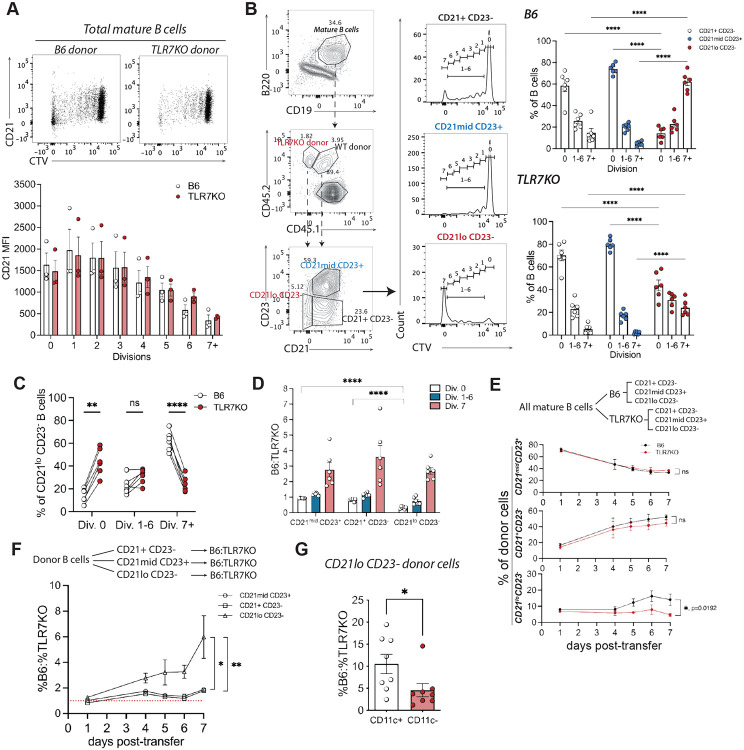
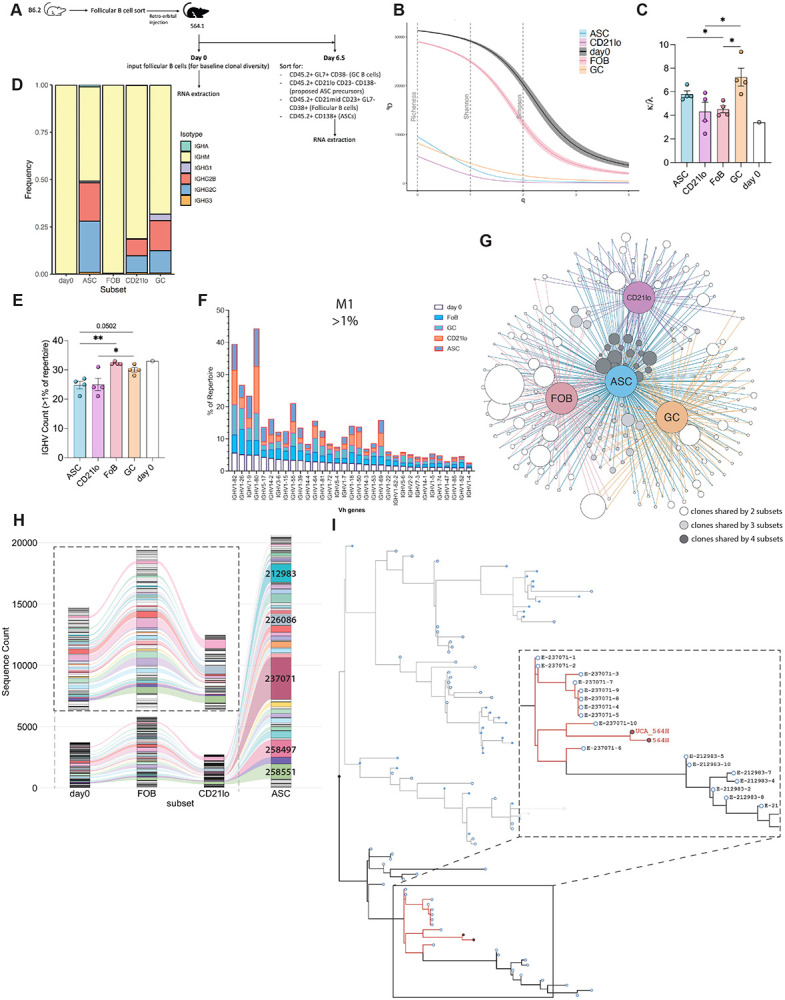
In systemic lupus erythematosus, recent findings highlight the extrafollicular (EF) pathway as prominent origin of autoantibody-secreting cells (ASCs). CD21loCD11c+ B cells, associated with aging, infection, and autoimmunity, are contributors to autoreactive EF ASCs but have an obscure developmental trajectory. To study EF kinetics of autoreactive B cell in tissue, we adoptively transferred WT and gene knockout B cell populations into the 564Igi mice - an autoreactive host enriched with autoantigens and T cell help. Time-stamped analyses revealed TLR7 dependence in early escape of peripheral B cell tolerance and establishment of a pre-ASC division program. We propose CD21lo cells as precursors to EF ASCs due to their elevated TLR7 sensitivity and proliferative nature. Blocking receptor function reversed CD21 loss and reduced effector cell generation, portraying CD21 as a differentiation initiator and a possible target for autoreactive B cell suppression. Repertoire analysis further delineated proto-autoreactive B cell selection and receptor evolution toward self-reactivity. This work elucidates receptor and clonal dynamics in EF development of autoreactive B cells, and establishes modular, native systems to probe mechanisms of autoreactivity.


Figures

Figure 1.
Figure 1.. TLR7 drives efficient development of autoreactive B cells and EF ASCs with a DN2-like phenotype.
(A) Schematic illustration of the adoptive transfer model. (B) Experimental set up of competitive WT/TLR7KO B cell adoptive transfer. (C) Representative flow cytometry plots and quantification of donor cell frequencies among total mature B cell compartment (CD19+ B220+) within competitive transfer 564Igi host (n=8). (D) Quantification of donor cell frequencies among GC (GL7hi CD38−) and non-GC mature (GL7− CD38+) B cells; gated from CD19+ B220+ B cells (n=5). (E, F) Representative flow cytometry plots and quantification of donor cell frequencies among CD138+ ASCs and CD11c+ CD21− CD138− B cells (n=8). (G) Ratio of %B6 to %TLR7KO cells across different B cell compartments from 7 days of transfer. (H) Representative images of HEp-2 cell immunofluorescence (IF) staining with adoptive transfer sera from 5 recipients and naive B6; CTB = cholera toxin B, cytoplasm; DAPI = nucleus. B6>564-1: nuclear dense fine speckled; B6>564-2: cytoplasmic/Golgi-like, B6>564-3: cytoplasmic discrete dots/GW body-like, B6>564-4: punctate nucleolar; B6>564-5: fine-speckled cytoplasmic. Images taken at 100x magnification, scale bars = 20 μm. (I) Quantification of Mb1cre+/−, (Bcl6WT, n=5) and Mb1cre−/−, Bcl6fl/fl (Bcl6−/−, n=7) donor GC B cells (CD45.2+ GL7hi CD38−) among total GC B cells in 564Igi host at 7 days post-transfer. (J) Representative flow cytometry plots and quantification of Mb1cre+/−, and Mb1cre−/−, Bcl6fl/fl donor CD138+ ASCs. Statistical analysis with paired t test (competitive transfers) or Student’s t test; *=p<0.05, **=p<0.01; ***=p<0.001; ****=p<0.0001.
Figure 2.
Figure 2.. WT and TLR7-KO donor B cells occupy distinct splenic follicular niches and have divergent outcomes.
(A) Experimental set up of competitive transfer time course. (B, C) Respective total mature and CD11c+ CD21− CD138− B cell time course plots from flow cytometry analysis at 1- (n=2), 4- (n=3), 5- (n=4), 6- (n=3), 7- (n=8) days post-transfer from at least 2 independent cohorts. Statistical analyses with Šidák’s multiple comparisons test. (D) IF imaging of host splenic white pulp at various days post-transfer. B220 and CD169 composite images show CD169+ MZ borders around B cell follicles; insets show composite of CD45.1 and CD45.2 near MZ-follicular borders. Fo=follicle, MZ=marginal zone. Scale bars = 100 μm. (E) Workflow of CD45.1 (channel 2) and CD45.2 (channel 1) co-localization analysis (Fiji Coloc 2 plugin) in transfer host spleens and tM1 quantification of MZ and follicular space. Representative follicle selections and MZ/Follicular outlines demonstrated on IF images. Analysis completed on 32 white pulps from two spleens at 5 days post-transfer. Statistical analyses with paired t test. (F, G) Respective PC (CD138+ B220−) and PB (CD138+ B220+) time course plots from flow cytometry analysis over 7 days of transfer. Statistical analyses with Šidák’s multiple comparisons test. (H) IF images of whole spleens from 564Igi transfer recipients at one (left) and five (right) days post-transfer at 30x magnification. Scale bars = 1mm. *=p<0.05, ***=p<0.001; ****=p<0.0001.
Figure 3.
Figure 3.. At 5 days post-transfer, donor B cells exhibit a fixed division program and require at least 7 divisions for ASC differentiation.
(A) Experimental set up of donor B cell labeling with Cell Trace Violet (CTV) and competitive transfer. (B) Representative cytometry plot showing donor B6 and TLR7KO CTV histograms at 5 days post-transfer. (C) Gating strategy flow chart and frequencies of donor WT and TLR7KO B cells at every division (n=10). Statistical analysis with two-way ANOVA and multiple comparisons. (D) Representative flow cytometry plot of CD138 versus CTV and CD138 MFI at every division for B6 and TLR7KO donor cells. (E, F) BLIMP1 and IRF4 MFI of WT and TLR7KO donor B cells at every division (n=7). Statistical analysis with two-way ANOVA and multiple comparisons. *=p<0.05, **=p<0.01, ***=p<0.001, ****=p<0.0001.
Figure 4.
Figure 4.. CD21lo B cells exhibit rapid proliferation and demonstrate increased sensitivity to TLR7 deficiency.
(A) Representative flow cytometry plots of CTV versus CD21 for B6 and TLR7KO donor cells at 5 d.p.t. to 564Igi and corresponding quantification of CD21 MFI at each division (n=3). (B) Representative flow cytometry plots showing CTV histograms of CD21lo CD23−, CD21mid CD23+, and CD21+ CD23− donor subsets, and corresponding quantification of B6 and TLR7KO subset frequencies at 0, 1-6, and 7+ divisions (n=6). (C) Frequencies of B6 and TLR7KO donor CD21lo CD23− B cells with 0, 1-6, and 7+ divisions at 5 d.p.t. (D) B6-to-TLR7KO ratio of CD21lo CD23−, CD21mid CD23+, and CD21+ CD23− donor subset frequencies with 0, 1-6, and 7+ divisions at 5 d.p.t. (B, C, D) statistical analyses with paired t test. (E) Time course plot showing frequency changes of CD21lo CD23−, CD21mid CD23+, and CD21+ CD23− B6 and TLR7KO donor B cells over 7 days of transfer. Flow chart shows gating strategy used for quantification. (F) Time course plot showing changes in %B6 to %TLR7KO ratio within CD21lo CD23−, CD21mid CD23+, and CD21+ CD23− donor subsets over 7 days of transfer. (E, F) Area under the curve calculated for each subset between B6 and TLR7KO for Welch’s t-test analysis. ns=not significant. (G) %B6 to %TLR7KO ratio of CD11c+ and CD11c− CD21lo CD23− donor B cells at 7 days post-transfer. Statistical analysis with paired t test. *=p<0.05, **=p<0.01, ****=p<0.0001.
Figure 5.
Figure 5.. CD21 downregulation during proliferation is reversible and can be restored by functional blockade of the receptor.
(A) Experimental set up of CTV-labeled WT and mCD21−/− B cell competitive transfer. (B) Representative CTV histograms of WT and mCD21−/− donor B cells and frequencies at every division. Statistical analysis with two-way ANOVA multiple comparisons. n=12 from at 3 independent cohorts. (C, D) Frequencies of WT and mCD21−/− mature B cells and ASCs (CD138+). Statistical analysis with paired t test and p values indicated on plots. (E) Diagram showing hypothesized mechanism of action of anti-hCD21 blocking antibody on target B cells. (F) Experimental set up of 7-day hCD21+ B cell blockade adoptive transfer. hCD21+ B cells were enriched, labeled with CTV, and transferred into 564.1 recipients, which received 2 doses of blocking antibodies. (G), (H), (I) Respective frequencies of total mature donor B cells (CD19+ B220+), donor B cells at each division, and donor ASCs as percent of total ASCs (left) or total live cells (right) with blocking antibody (n=10) or PBS (n=4) treatment from flow cytometry analysis of two independent cohorts. Statistical analysis with Welch’s t test (g, i) and two-way ANOVA multiple comparisons (h). ns = not significant. (J) Representative IF images of fresh frozen spleen cryosections from transfer recipient mice receiving PBS (top) or blocking antibody (bottom) at 30x magnification. Selected area of red pulp outlined with white box. RP = red pulp; Fo = follicle. Scale bars = 200 μm. (K) Mean CD138 intensity of spleen IF images from transfer recipient mice receiving PBS or blocking antibody per field of view. Each data point represents one field of view, and each unique color represents a different animal. (L, M) Respective hCD21 MFI quantification of total donor B cells and donor B cells at every division with blocking antibody or PBS treatment from flow cytometry analysis. Statistical analysis with area under the curve (l) and Welch’s t test (l, m). (N) Representative flow cytometry plots and relative frequencies of CD21lo CD23−, CD21+ CD23−, and CD21mid CD23+ donor B cells receiving blocking antibody or PBS treatment. Statistical analysis with Welch’s t test. (O) Representative CTV histograms of CD21lo CD23− B cells treated with blocking antibody or PBS. (P) Experimental schematic of in vitro hCD21 blockade assay. (Q) B cell surface hCD21 and CD19 MFI plots showing naive hCD21+ B cells treated with anti-hCD21 blocking antibody or PBS for 0, 1, 3, 6 hr in presence of Zymosan (Zy) or Zy-iC3b/C3d particles. Statistical analysis with area under the curve and Welch’s t test. *=p<0.05, **=p<0.01, ***=p<0.001; ****=p<0.0001.
Figure 6.
Figure 6.. Follicular B cell derived CD21lo B cells are immediate precursors to autoreactive EF ASCs
(A) Experimental set up and gating strategy of MZB / follicular B cell (FoB) transfers to 564.2 recipients. (B) Representative flow cytometry plots of donor B cells following FoB (n=5) and MZB (n=4) transfers showing follicular (CD21 versus CD23) and MZ (CD21 versus CD1d) B cell phenotypes. Populations sorted and transferred are indicated on respective plots. (C) Representative flow cytometry plots showing donor cell frequencies within ASC compartment from MZB / FoB cell transfers. (D) Experimental set up and gating strategy of T1B / FoB transfers to 564.2 recipients. (E) Representative flow cytometry plots of donor B cells following T1B (n=2) and FoB (n=3) transfers showing FoB (CD21 versus CD23) and T1B (CD21 versus CD93) phenotypes. Populations sorted and transferred are indicated on respective plots. (F) Representative flow cytometry plots showing frequencies of donor within ASC compartment from T1B / FoB transfers. (G) Experimental set up showing FoB sort, labeling and transfer to 564.2 recipients. (H) Representative flow cytometry plots showing frequencies of CD21lo CD23−, CD21mid CD23+, and CD23+ CD23− donor B cell subsets in 564.2 recipients following FoB transfer (n=4). (I) Representative flow cytometry plots of CTV versus CD138 and quanti_cation of FoB derived CD138+ cells within each division. Statistical analysis with two-way ANOVA multiple comparisons. ****=p<0.0001. (J) Representative flow cytometry plots and quantification of donor B cell subset frequencies post FoB transfer at divisions 0, 1-6, or 7+. (K) Representative flow cytometry plots and quantification of donor and host ASC frequencies post FoB transfer.
Figure 7.
Figure 7.. B cell repertoire sequencing reveals developmental trajectories of follicular B cells toward autoreactivity
(A) Experimental set up of follicular B cell sort and transfer timeline; sorted donor populations are indicated with respective surface markers. (B) Repertoire diversity curve with Hill’s diversity index (qD) versus diversity orders (q). Subsets are colored respectively, with 95% confidence interval (CI) for each subset represented as shadowed areas of lines. ASC = ASCs, CD21lo = CD21lo cells, day0 = day 0 follicular B cells, FOB = day 6.5 follicular B cells, GC = GC B cells. (C) κ to λ light chain ratio for each subset. Ratio calculated from total number of unique sequences expressing Igκ divided by those expressing Igκ. Statistical analysis with Welch’s t test. *=p<0.05. (D) Plot of Ig isotype frequencies for each donor subset from four mice combined. (E) Counts of unique IGHV families for each donor subset contributing to more than 1% of subset repertoire. Statistical analysis with Welch’s t test. *=p<0.05, **=p<0.01. p value indicated on plot. (F) Vh gene repertoire frequencies of selected IGHV families from mouse 1 (M1) making up more than 1% of the input day 0 repertoire; stacked columns represent donor cell subsets at 6.5 d.p.t. with respective colors. (G) Qgraph illustrating shared clones between follicular B cells, CD21lo cells, ASCs, and GC B cells at 6.5 days post-transfer. Grey-scale circles represent individual clones, and colored circles represent subsets. Size of circles (in greyscale) is proportional to clone sizes. Connectors represent sharing of clones between different subsets. (H) Alluvial plot illustrating changes in clone sizes between subsets. Clones are pre-selected to only those shared by all four subsets. Thickness of bars with distinct colors represents absolute sequence counts within the clone. 5 most expanded ASC clones are annotated with their corresponding clone IDs. Inset illustrates enlarged region of plot showing only day 0 and 6.5 follicular B cells, and CD21lo cells. (I) Phylogenetic tree showing evolutionary relationships between selected donor ASC heavy chain sequences from 5 most expanded clones and 5 most restricted clones. Blue filled circles: sequences from restricted clones; blue empty circles: sequences from expanded clones. Inset shows clade including 564Igi, and 564Igi UCA heavy chain sequences and ASC sequences from two most expanded clones (#237071 and #212983). E = expanded, R = restricted.

Similar articles

References

    1. Rahman A. & Isenberg D. A. Systemic lupus erythematosus. N. Engl. J. Med. 358, 929–939 (2008). - PubMed
    1. Tsokos G. C. Autoimmunity and organ damage in systemic lupus erythematosus. Nat. Immunol. 21, 605–614 (2020). - PMC - PubMed
    1. Shlomchik M. J. Sites and Stages of Autoreactive B Cell Activation and Regulation. Immunity 28, 18–28 (2008). - PubMed
    1. Degn S. E. et al. Clonal Evolution of Autoreactive Germinal Centers. Cell 170, 913–926.e19 (2017). - PMC - PubMed
    1. Malkiel S., Barlev A. N., Atisha-Fregoso Y., Suurmond J. & Diamond B. Plasma cell differentiation pathways in systemic lupus erythematosus. Front. Immunol. 9, (2018). - PMC - PubMed

Publication types