[Preprint]. 2024 Jan 13:2024.01.12.575075.
doi: 10.1101/2024.01.12.575075.

Mitochondrial membrane potential regulates nuclear DNA methylation and gene expression through phospholipid remodeling

Affiliations

Mitochondrial membrane potential regulates nuclear DNA methylation and gene expression through phospholipid remodeling

Mateus Prates Mori et al. bioRxiv. .

Update in

Abstract

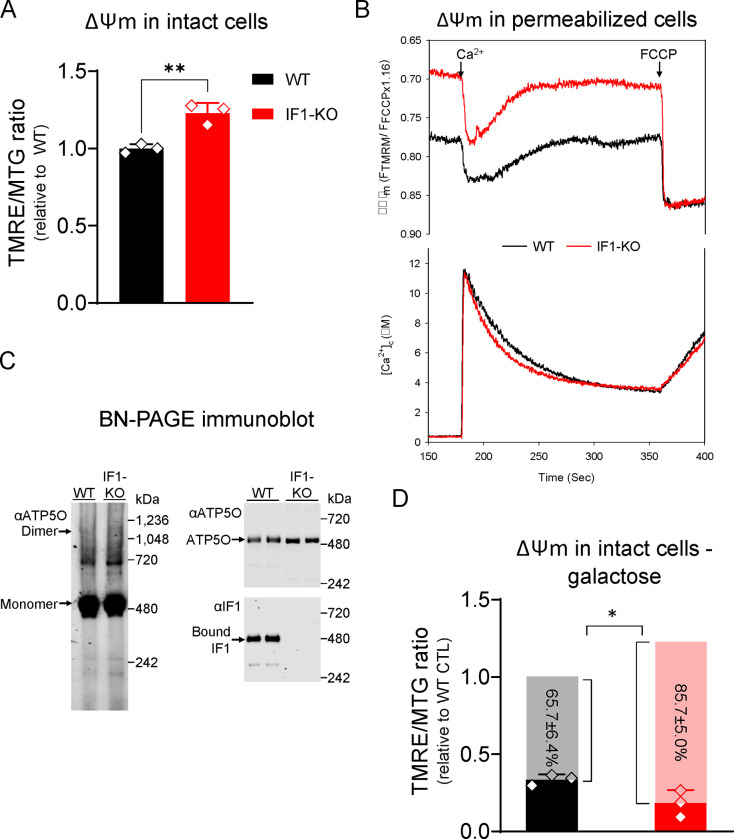
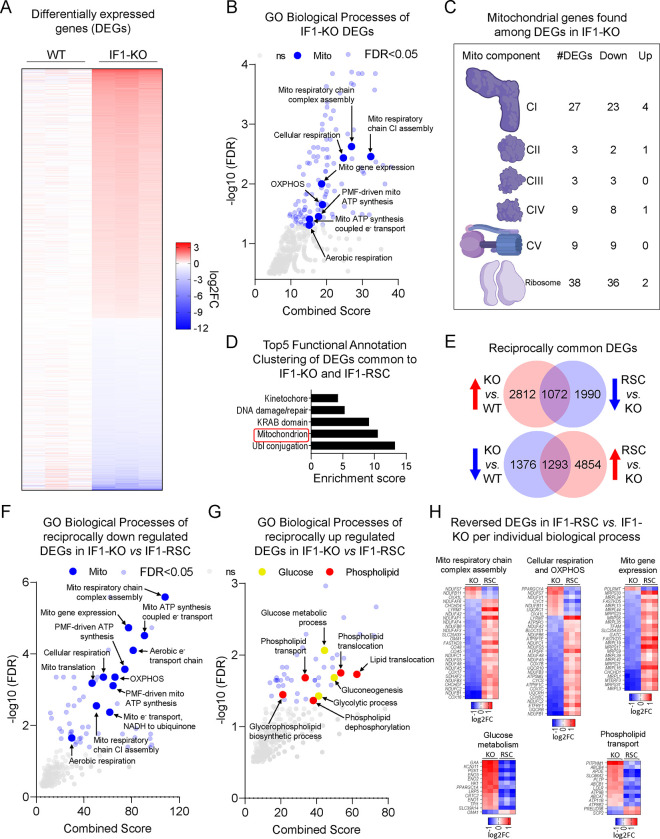
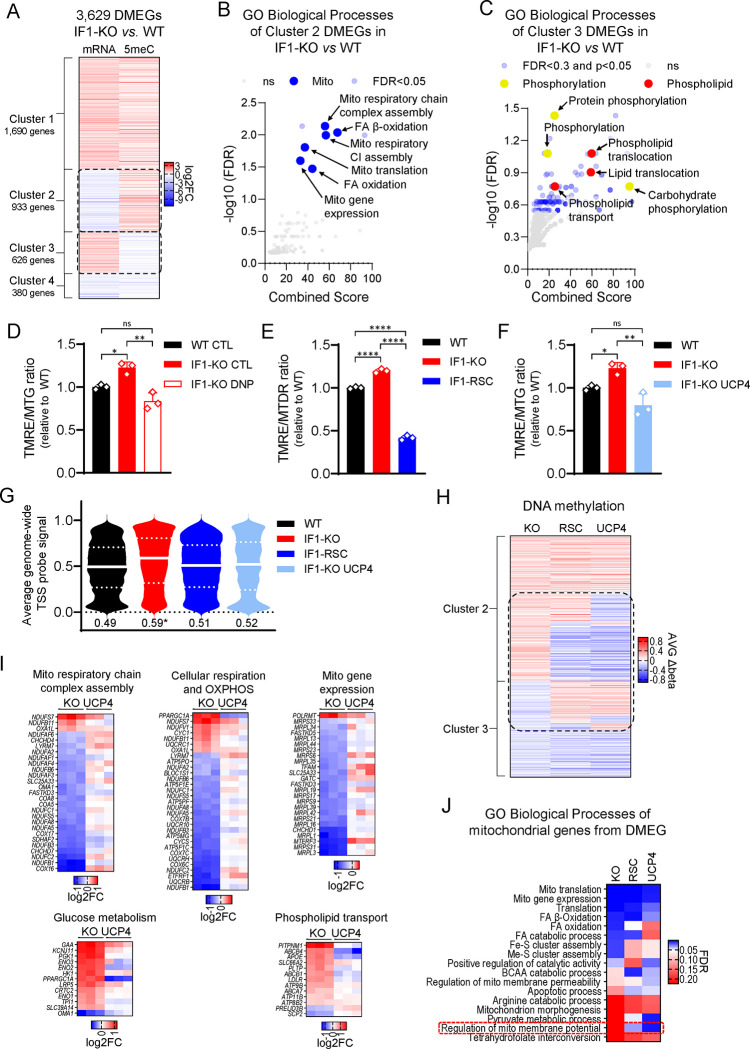
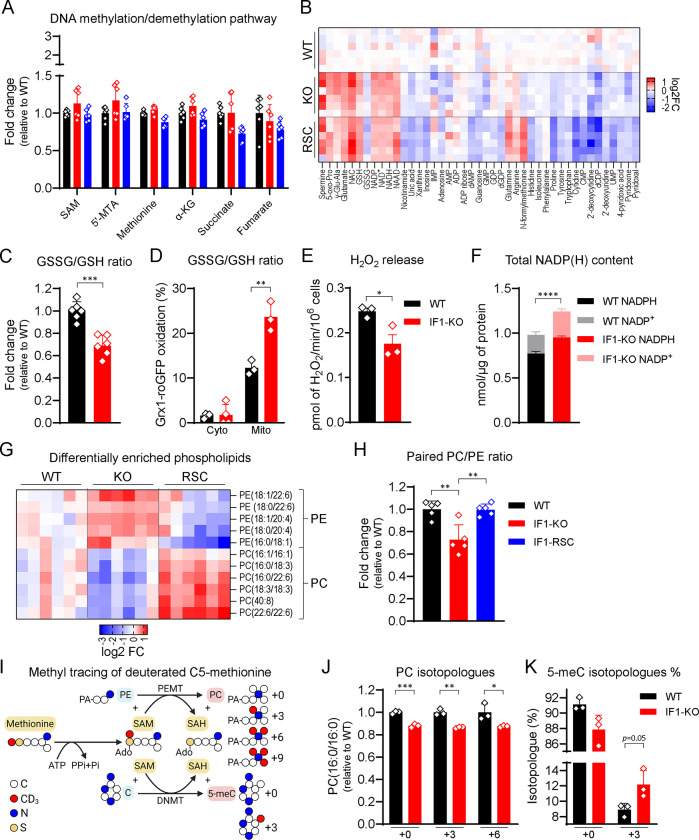
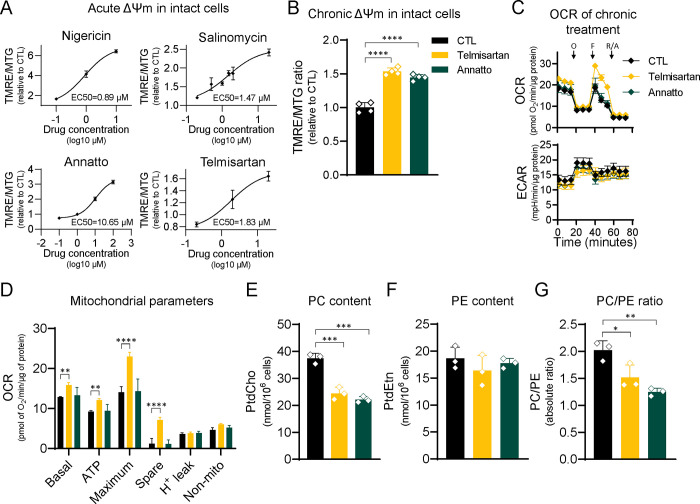
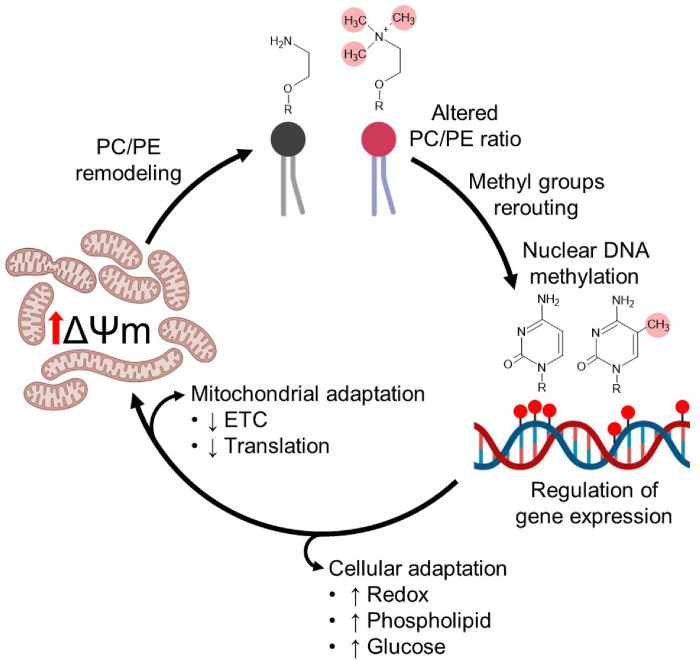
Maintenance of the mitochondrial inner membrane potential (ΔΨM) is critical for many aspects of mitochondrial function, including mitochondrial protein import and ion homeostasis. While ΔΨM loss and its consequences are well studied, little is known about the effects of increased ΔΨM. In this study, we used cells deleted of ATPIF1, a natural inhibitor of the hydrolytic activity of the ATP synthase, as a genetic model of mitochondrial hyperpolarization. Our data show that chronic ΔΨM increase leads to nuclear DNA hypermethylation, regulating transcription of mitochondria, carbohydrate and lipid metabolism genes. Surprisingly, remodeling of phospholipids, but not metabolites or redox changes, mechanistically links the ΔΨM to the epigenome. These changes were also observed upon chemical exposures and reversed by decreasing the ΔΨM, highlighting them as hallmark adaptations to chronic mitochondrial hyperpolarization. Our results reveal the ΔΨM as the upstream signal conveying the mitochondrial status to the epigenome to regulate cellular biology, providing a new framework for how mitochondria can influence health outcomes in the absence of canonical dysfunction.

Keywords: DNA hypermethylation; Mitochondria; epigenome; gene expression; mitochondrial membrane potential; phospholipid rewiring.


Conflict of interest statement

Declaration of Interests The authors declare no conflict of interest.

Figures

Figure 1.
Figure 1.. Ablation of IF1 increases resting ΔΨM via ATP synthase hydrolytic activity.
A) ΔΨM measured in intact cells using the ΔΨM-sensitive dye TMRE; data were normalized to mitochondrial content using the ΔΨM-insensitive dye MitoTracker® Green (MTG). On y-axis, TMRE/MTG ratio, black bar, ΔΨM in WT cells, and red bar, ΔΨM in IF1-KO cells (n = 3, ** p < 0.01). Statistical difference by Student’s t test. B) Representative trace of concomitant ΔΨM and Ca2+ buffering measurements in permeabilized cells energized with succinate. The black line represents WT cells and the red line IF1-KO cells. FCCP was added at the end of the experiment to fully depolarize the ΔΨM and release the intramitochondrial pool of Ca2+. C) Representative immunoblots of blue native (BN)-PAGE. Left panel, digitonin-permeabilized WT and IF1-KO mitochondria blotted with ATP synthase peripheral stalk subunit OSCP antibody (αATP5O). Complex V monomer and dimer are pointed by the arrows. Right upper panel, WT and IF1-KO mitochondria blotted with αATP5O. Right lower panel, WT and IF1-KO mitochondria blotted with IF1 antibody (αIF1). D) Bar graph of ΔΨM as measured in A in cells grown in galactose 5 mM. Y axis depicts the TMRE/MTG ratio, black bar ΔΨM in WT cells, and red bar, ΔΨM in IF1-KO cells. Grey and pink bars represent the ΔΨM difference between WT and IF1-KO grown in high glucose vs. in galactose (n = 3, * p < 0.05). Statistical difference by Student’s t test.
Figure 2.
Figure 2.. IF1-KO cells with increased ΔΨM engage in a transcriptional feedback loop repressing mitochondrial genetic program.
A) Heatmap of differentially expressed genes (DEGs) in IF1-KO vs. WT (False Discovery Rate, FDR < 0.05). The color scheme is presented as a log2 fold change (log2FC). Shades of red represent upregulated genes (log2FC > 0) and shades of blue represent downregulated genes (log2FC < 0). B) Gene Ontology (GO) analysis of DEGs in IF1-KO vs. WT cells. −Log10 FDR values on the y-axis, and combined score on the x-axis. In bigger blue circles, significantly enriched pathways (FDR < 0.05) related to mitochondria. In smaller translucid blue and grey circles, other significantly enriched pathways (FDR < 0.05) and non-significant pathways (FDR > 0.05), respectively. C) Structural depiction of individual complexes of the electron transport chain and mitochondrial ribosomes. The number of DEGs associated with these broad complexes and their transcriptional directionality are also depicted. D) Functional Annotation Clustering of common DEGs reciprocally changed in the inverse direction between IF1-KO vs. WT and IF1-RSC vs. IF1-KO. Keywords and terms found in each cluster are shown on the y-axis and the Enrichment score is on the x-axis. E) Venn diagrams shown the intersection between reciprocally regulated DEGs in IF1-KO vs. WT and IF1-RSC vs IF1-KO. Upper circles: upregulated DEGs based on IF1-KO vs. WT comparison, lower circles represent the downregulated counterparts. F and G) GO analysis of reciprocally regulated DEGs in IF1-KO cells, as depicted and described in B. H) Heatmap of representative pathways reversed in IF1-RSC vs. IF1-KO as identified by GO analysis. Color scheme as described in A. KO is IF1-KO vs. WT, and RSC is IF1-RSC vs. IF1-KO.
Figure 3.
Figure 3.. Nuclear DNA is hypermethylated in IF1-KO cells regulating a mitochondrial gene expression program.
A) Heatmap of commonly differentially methylated and expressed genes (DMEGs). The color scheme is presented as a log2 fold change (log2FC). Shades of red represent upregulated and hypermethylated genes (log2FC > 0) and shades of blue represent downregulated and hypomethylated genes (log2FC < 0). Left track (mRNA) is gene expression from RNA-seq and right track (5meC) is IF1-KO UCP4 vs. IF1-KO. DMEGs were grouped in 4 clusters based on promoter methylation and gene expression change, respectively: 1) hypermethylated and upregulated, 2) hypermethylated and downregulated, 3) hypomethylated and upregulated, and 4) hypomethylated and downregulated. B and C) GO analysis of DMEG of clusters 2 and 3, respectively. −Log10 FDR values on the y-axis, and combined score on the x-axis. D-F) Bar graph of ΔΨM as measured by ΔΨM-dependent dye TMRE normalized to the ΔΨM-independent dye MTG. Y axis depicts the TMRE/MTG ratio, black bar ΔΨM in WT cells, and red bar, ΔΨM in IF1-KO cells. D) Red-bordered bar, ΔΨM in IF1-KO cells treated for 3 days with DNP 25 μM. E) Blue bar, ΔΨM in IF1-RSC cells. F) Light blue bar, ΔΨM in IF1-KO UCP4 expressing cells. Statistical difference by One-way ANOVA with Tukey’s post-test. G) Violin plot showing DNA methylation status across the entire genome in all 4 genotypes; the Y-axis depicts probe values; white lines indicate the median and dotted lines the quartiles. Numerical values below the violin plot are the median for each genotype. H) Heatmap of DMEGs in clusters 2 and 3 from A. The color scheme is presented as average delta beta (AVGΔbeta, see methods). Shades of red represent hypermethylated genes (AVGΔbeta > 0) and shades of blue represent hypomethylated genes (AVGΔbeta < 0). The left track (KO) is IF1-KO vs. WT, the middle track (RSC) is IF1-RSC vs. IF1-KO, and the right track (UCP4) is IF1-KO UCP4 vs. IF1-KO. I) Heatmap of representative pathways as in Fig. 2H. KO is IF1-KO vs. WT, and UCP4 is IF1-KO UCP4 vs. IF1-KO. J) Heatmap of biological processes (as per Gene Ontology analysis) of mitochondrial genes from DMEG of each paired comparison. The color scheme is presented False Discovery Rate (FDR). Left track (KO) is IF1-KO vs. WT, middle track (RSC) is IF1-RSC vs. IF1-KO, and right track (UCP4) is IF1-KO UCP4 vs. IF1-KO.
Figure 4.
Figure 4.. Heads of phospholipids (PC/PE ratio), but not canonical metabolites involved in DNA (de)methylation reactions, better correlate with DNA hypermethylation.
A) Measurement of metabolites involved in DNA (de)methylation reactions. Mean WT was set as 1 (n = 6). On the y-axis, fold changes (FC) of metabolites relative to WT. On the x-axis, metabolites. B) Heatmap of differentially enriched metabolites (FDR > 0.05) from steady-state untargeted metabolomics grouped by metabolic pathway. Shades of red represent increased metabolite levels (log2FC > 0) and shades of blue decreased metabolite levels (log2FC < 0). C) Oxidized/reduced glutathione (GSSG/GSH) ratio. On the y-axis, GSSG/GSH ratio relative to WT, n = 6, *** p < 0.001. Statistical difference by Student’s t-test. D) GSSG/GSH accessed by Grx1-roGFP probe ratio in the cytosol (cyto, untargeted) and mitochondria (mito, MTS-containing). On the y-axis, GSSG/GSH ratio relative to WT; n = 3, except IF1-KO, n = 4, ** p < 0.01. Statistical difference by Student’s t-test. E) H2O2 release accessed by Amplex® Red. On the y-axis, pmol of H2O2/min/106 cells; n = 3, * p < 0.05. Statistical difference by Student’s t-test. F) Total NADP(H) content. On the y-axis, nmol NADPH or NADP+ per μg protein, black and grey bars, NADPH and NADP+ in WT cells, respectively, red and pink bars, NADPH and NADP+ in IF1-KO cells, respectively (n = 3, ** p < 0.01). Statistical difference by Student’s t-test. G) Heatmap of differentially enriched phospholipids (FDR > 0.05) grouped by head groups. Shades of red represent increased metabolite levels (log2FC > 0) and shades of blue decreased metabolite levels (log2FC < 0). H) PC/PE ratio of paired phospholipids. Four PC/PE pairs (16:0/18:2, 16:0/22:6, 18:0/22:6, and 18:2/18:2) found in metabolomics data were pooled and ratios determined for each sample. Mean WT was set as 1. On the y-axis, fold changes (FC) of metabolites relative to WT; n = 5, ** p < 0.01. Statistical difference by One-way ANOVA with Tukey’s post-test. I) Schematic diagram for tracing methyl group using deuterated C5-methionine. Carbon (C) is depicted in white circles, nitrogen (N) in blue, sulfur (S) in yellow, and deuterated methyl group (CD3) in red. Condensation of deuterated C5-methionine with ATP forms deuterated SAM at the methyl-donating position (CD3-SAM). Up to three methyl groups of CD3-SAM are transferred to PE to form PC by PEMT giving rise to +3, +6, or +9 isotopologues. One methyl group of CD3-SAM is transferred to C to form 5meC giving rise to +3 isotopologue. J) Measurement of PC(16:0/16:0) isotopologues. Mean WT was set as 1. On the y-axis, fold changes (FC) of PC(16:0/16:0) relative to WT. On the x-axis, isotopologues (+0, +3, and +6). Black bars FC of PC(16:0/16:0) in WT, red bar, in IF1-KO (n = 3, * p < 0.05, ** p < 0.01, and *** p < 0.001). Statistical difference by Student’s t-test for each isotopologue. K) Percentage (%) of 5meC isotopologues. Total 5meC was set as 100% for each sample and isotopologues +0 and +3 were calculated as % from total. On the y-axis, relative abundance of each isotopologue. On the x-axis, isotopologues (+0 and +3). Black bars FC of 5meC in WT, red bar, in IF1-KO (n = 3, p = 0.0505). Statistical difference by Student’s t-test for each isotopologue.
Figure 5.
Figure 5.. Chronic drug-induced ΔΨM hyperpolarization recapitulates IF1-KO PC/PE shift.
A) Dose-response Hill slope was used to determine EC50 of drugs tested. On the y-axis, the TMRE/MTG ratio, and on the x-axis drug concentration in log10 μM. B) Drug-induced ΔΨM hyperpolarization in cells treated for 10 days; n = 4, **** p < 0.0001. C) Upper graph, oxygen consumption rate (OCR) on the y-axis in pmol O2/min/μg protein. Lower graph, extracellular acidification rate (ECAR) on the y-axis in mpH/min/ μg protein. Arrows indicate injection of mitochondrial inhibitors: oligomycin A 1 μM (O), FCCP 1 μM (F), and rotenone and antimycin A 1 μM (R/A) (n = 3). D) Mitochondrial parameters: Basal mitochondrial respiration, ATP-linked respiration, maximum respiration, spare respiratory capacity, H+ leak, and non-mitochondrial respiration; n = 3, ** p < 0.01, **** p < 0.0001. E and F) PC and PE content in cells chronically treated with ΔΨM hyperpolarizing drugs; n = 3, *** p < 0.01. G) Absolute PC/PE ratio in cells chronically treated with ΔΨM hyperpolarizing drugs; n = 3, *** p < 0.01. In all panels, statistical difference was tested by one-way ANOVA with Dunnett’s post-test.
Figure 6.
Figure 6.. Cellular and mitochondrial adaptations to a chronic state of mitochondrial hyperpolarization.
Chronic ΔΨM hyperpolarization leads to mitochondrial membrane phospholipid remodeling with increased PE, which can broadly help regulate proton flux and thus the ΔΨM. This increased membrane PE derives from its decreased methylation into PC, not only impacting PC levels but the PC/PE cellular ratio. Methyl groups from SAM not used to generate PC are then re-routed to the nuclear DNA, including over the promoter regions of thousands of genes. The differentially methylated loci in the nucleus regulate an adaptive gene expression program that involve both inhibition of mitochondrial genes, likely to further help regulate proton flux and the ΔΨM, as well as other broader cellular adaptations involving redox homeostasis and glucose/lipid metabolism.

Similar articles

References

    1. Di Lisa F., Blank P.S., Collona R., Gambassi G., Silverman H.S., Stern M.S., and Hansford R.G. (1995). Mitochondrial membrane potential in single living adult rat cardiac myocytes exposed to anoxia or metabolic inhibition. The Journal of Physiology 486, 1–13. 10.1113/jphysiol.1995.sp020786. - DOI - PMC - PubMed
    1. Kulawiak B., Hopker J., Gebert M., Guiard B., Wiedemann N., and Gebert N. (2013). The mitochondrial protein import machinery has multiple connections to the respiratory chain. Biochim Biophys Acta 1827, 612–626. 10.1016/j.bbabio.2012.12.004. - DOI - PubMed
    1. Neupert W., and Herrmann J.M. (2007). Translocation of proteins into mitochondria. Annu Rev Biochem 76, 723–749. 10.1146/annurev.biochem.76.052705.163409. - DOI - PubMed
    1. Gunter T.E., Yule D.I., Gunter K.K., Eliseev R.A., and Salter J.D. (2004). Calcium and mitochondria. FEBS Lett 567, 96–102. 10.1016/j.febslet.2004.03.071. - DOI - PubMed
    1. Pak O., Sommer N., Hoeres T., Bakr A., Waisbrod S., Sydykov A., Haag D., Esfandiary A., Kojonazarov B., Veit F., et al. (2013). Mitochondrial hyperpolarization in pulmonary vascular remodeling. Mitochondrial uncoupling protein deficiency as disease model. Am J Respir Cell Mol Biol 49, 358–367. 10.1165/rcmb.2012-0361OC. - DOI - PubMed

Publication types