[Preprint]. 2024 Jan 12:rs.3.rs-3830704.
doi: 10.21203/rs.3.rs-3830704/v1.

HIF1α-glycolysis engages activation-induced cell death to drive IFN-γ induction in hypoxic T cells

Affiliations

HIF1α-glycolysis engages activation-induced cell death to drive IFN-γ induction in hypoxic T cells

Hongxing Shen et al. Res Sq. .

Update in

Abstract

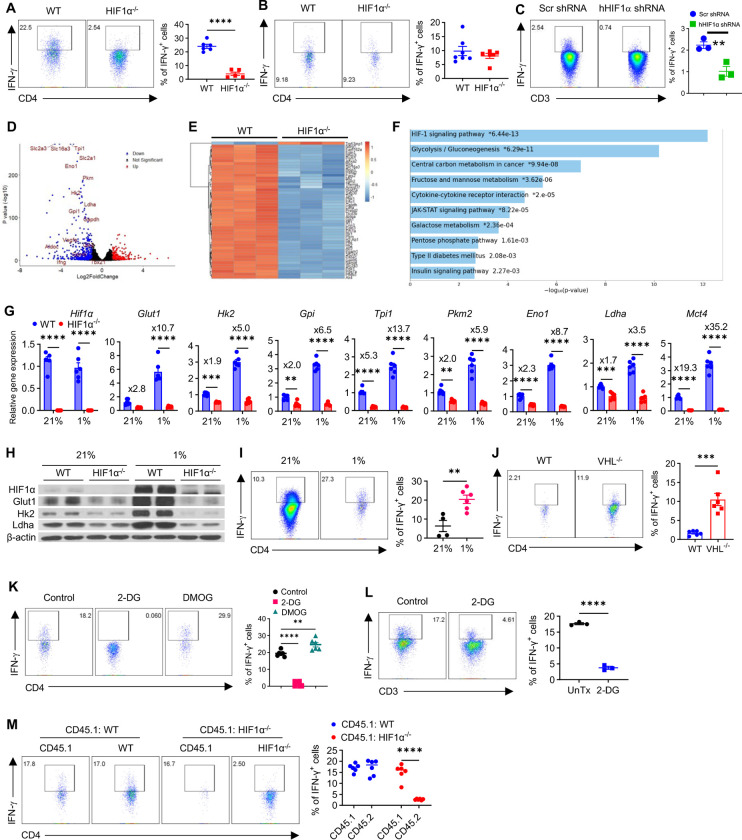
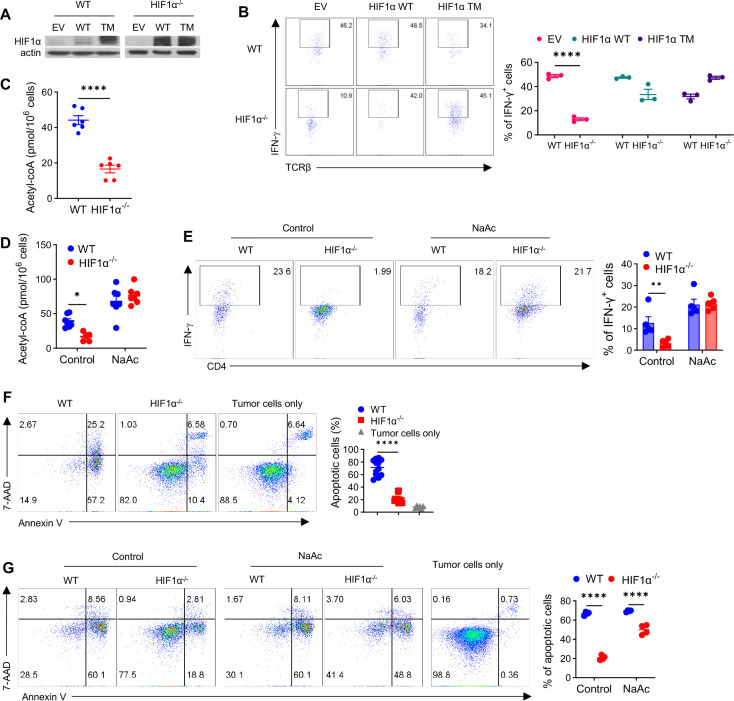
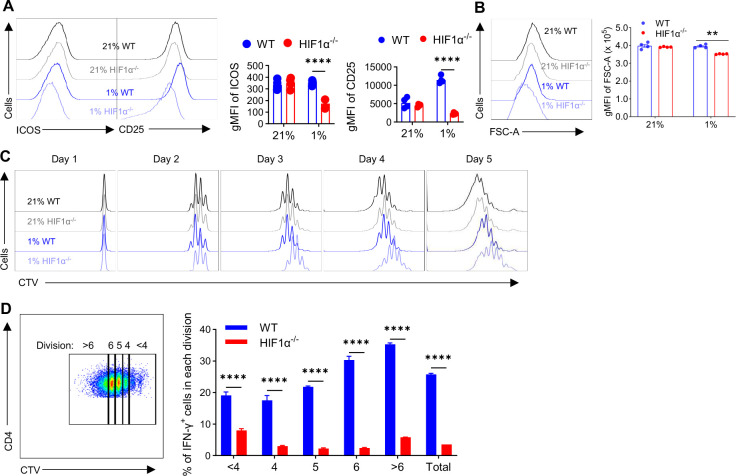
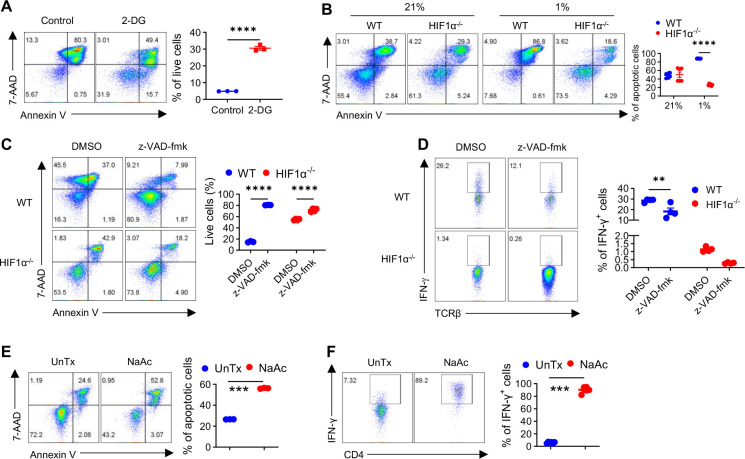
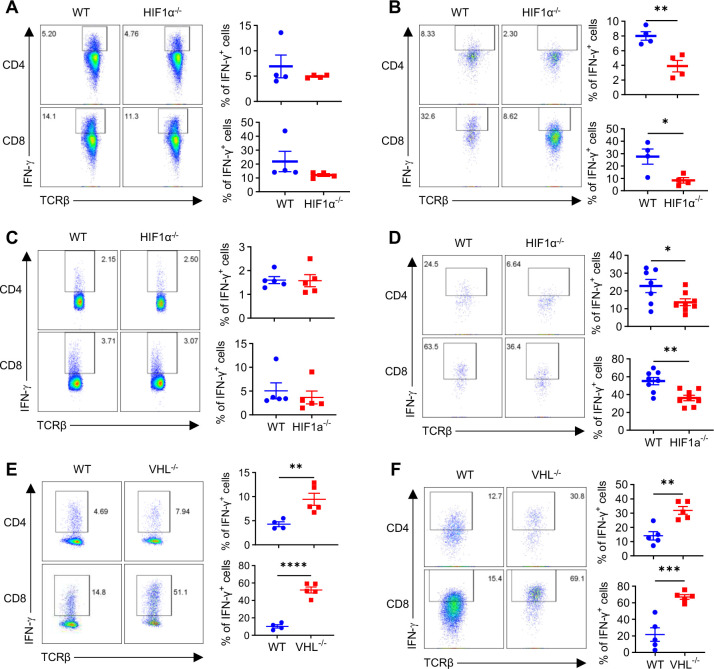
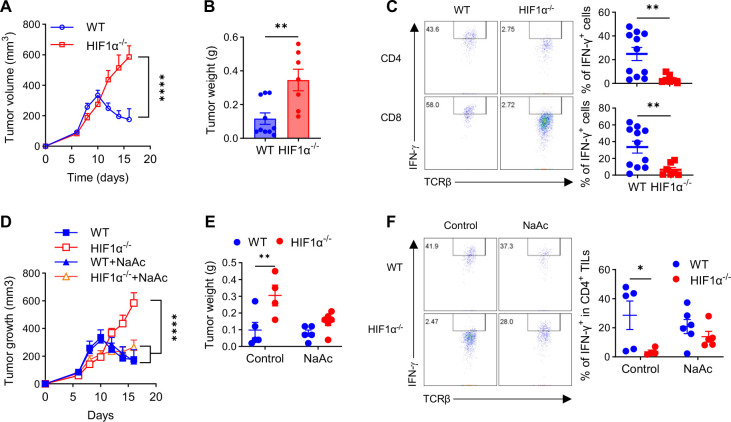
The role of HIF1α-glycolysis in regulating IFN-γ induction in hypoxic T cells is unknown. Given that hypoxia is a common feature in a wide array of pathophysiological contexts such as tumor and that IFN-γ is instrumental for protective immunity, it is of great significance to gain a clear idea on this. Combining pharmacological and genetic gain-of-function and loss-of-function approaches, we find that HIF1α-glycolysis controls IFN-γ induction in both human and mouse T cells activated under hypoxia. Specific deletion of HIF1α in T cells (HIF1α-/-) and glycolytic inhibition significantly abrogate IFN-γ induction. Conversely, HIF1α stabilization in T cells by hypoxia and VHL deletion (VHL-/-) promotes IFN-γ production. Mechanistically, reduced IFN-γ production in hypoxic HIF1α-/- T cells is due to attenuated activation-induced cell death but not proliferative defect. We further show that depletion of intracellular acetyl-CoA is a key metabolic underlying mechanism. Hypoxic HIF1α-/- T cells are less able to kill tumor cells, and HIF1α-/- tumor-bearing mice are not responsive to immune checkpoint blockade (ICB) therapy, indicating loss of HIF1α in T cells is a major mechanism of therapeutic resistance to ICBs. Importantly, acetate supplementation restores IFN-γ production in hypoxic HIF1α-/- T cells and re-sensitizes HIF1α-/- tumor-bearing mice to ICBs, providing an effective strategy to overcome ICB resistance. Taken together, our results highlight T cell HIF1α-anaerobic glycolysis as a principal mediator of IFN-γ induction and anti-tumor immunity. Considering that acetate supplementation (i.e., glycerol triacetate (GTA)) is approved to treat infants with Canavan disease, we envision a rapid translation of our findings, justifying further testing of GTA as a repurposed medicine for ICB resistance, a pressing unmet medical need.

Keywords: HIF1α; ICB; IFN-γ; T cell; acetate supplementation; anaerobic glycolysis; hypoxia.


Conflict of interest statement

Additional Declarations: There is NO Competing Interest.

Figures

Figure 1.
Figure 1.. HIF1α-glycolysis controls IFN-γ induction in hypoxic T cells, in vitro.
A-B. Naïve CD4+ T cells isolated from WT and HIF1α−/− mice were activated under hypoxia (A) and normoxia (B) for 5.5 days, followed by detection of IFN-γ. C. Naive human CD4+ T cells isolated from PBMCs of healthy donors were activated, transduced with retroviruses expressing scrambled shRNAs (Scr shRNA) or shRNAs against human HIF1α (hHIF1α shRNA), and cultured under hypoxia for 5.5 days, followed by detection of IFN-γ. D-F. Total RNAs extracted from WT and HIF1α−/− CD4+ naïve T cells activated under hypoxia for 48h were subjected to RNA-Seq. The gene expression analyses were performed using DESeq2 (version 1.34.0). The Wald test was used to calculate the p values and log2 fold changes. Genes with an adjusted p value < 0.05 and absolute log2 fold change > 1 were considered as differentially expressed genes (DEGs). A volcano plot was used to show all upregulated and downregulated DEGs using the ggplot2 R packagew (D), with top 50 identified DEGs shown as a heatmap (E). Top 10 enriched signaling pathways (downregulated) from Enriched Kyoto Encyclopedia of Genes and Genomes (KEGG) analyses of DEGs were shown in F. Significant terms of the KEGG pathways were selected with p value <0.05. G. mRNA expression of glycolytic genes was evaluated by real-time RT-PCR in T cells activated and cultured under normoxia (21%) and hypoxia (1%) for 48h. H. Protein expression of HIF1α, Glut1, Hk2, and Ldha was analyzed using cell lysates prepared using cells similarly activated as in G; β-actin was used as a loading control. I. WT naïve CD4+ T cells were similarly activated under normoxia and hypoxia as in A for 5.5 days -and analyzed for IFN-γ production. J. IFN-γ production by WT or VHL CD4+ T cells activated under hypoxia for 2.5 days. K. Naïve WT CD4+ T cells were similarly activated under hypoxia, in the presence of solvent (Control), 0.5 μM of 2-DG, or 0.2μM of DMOG, for 5.5 days, followed by analysis of IFN-γ production. L. Naive human CD4+ T cells isolated from PBMCs of healthy donors were activated under hypoxia for 5.5 days, with or without 0.5 μM 2-DG, followed by detection of IFN-γ. M. Equally mixed naïve CD45.1+ CD4+ T cells with naïve CD45.2+ CD4+ T cells from WT or HIF1α−/− mice were activated under hypoxia for 5.5 days and detected for IFN-γ production. All the experiments were repeated at least twice. Pooled results shown in the dot plots and bar graphs depicted means ± SEM for all samples in each group, with each dot denoting an independent sample. **, p<0.01; ***, p<0.001; ****, p<0.0001. Source data were provided in the Source Data file.
Figure 2.
Figure 2.. Direct regulation of IFN-γ induction in hypoxic T cells by HIF1α and [acetyl-CoA], in vitro.
A-B. Protein expression of HIF1α in WT and HIF1α−/− CD4+ T cells successfully transduced (GFP+) with empty retroviruses (EV) or retroviruses expressing WT or triple-mutant HIF1α (TM) (A). GFP+ T cells were activated under hypoxia and analyzed for IFN-γ production (B). C. [Acetyl-CoA] in activated WT and HIF1α−/− CD4+ T cells. D-E. [Acetyl-CoA] (D) and IFN-γ production (E) by activated WT and HIF1α−/− CD4+ T cells, with or without 20 mM sodium acetate (NaAc) added on Day 2 post-activation. F. Cell death of MB49 cells cultured alone (tumor cells only) or with activated WT and HIF1α−/− CD4+ T cells at the ratio of 1:2 for 48h was measured by 7-AAD/Annexin V staining. G. Cell death of MB49 cells co-cultured with activated WT and HIF1α−/− CD4+ T cells pretreated with or without NaAc for 48h was analyzed by 7-AAD/Annexin V staining. All experiments were repeated at least twice. Pooled results shown in the dot/bar graphs depicted means ± SEM for all the samples in each group, with each dot denoting an independent sample. **, p<0.01; ****, p<0.0001. Source data were provided in the Source Data file.
Figure 3.
Figure 3.. Reduced IFN-γ production in HIF1α−/− T cells is not due to proliferative defect.
A-B. Naïve WT and HIF1α−/− CD4+ T cells were activated under normoxia (21% O2) and hypoxia (1% O2) for 5.5 days. Gated live cells were analyzed for the expression of ICOS and CD25 (A), depicted as geometric mean fluorescence intensity (gMFI), and area of forward scatter (FSC) (B). C-D. Naïve WT and HIF1α−/− CD4+ T cells were labeled with CellTrace Violet (CTV) and activated under normoxia (21% O2) and hypoxia (1% O2). CTV dilution was monitored daily to assess cell proliferation. Gating strategy on defining cell division by CTV dilution was shown for WT T cells (left) and IFN-γ production by activated WT and HIF1α−/− CD4+ T cells within indicated cell divisions was shown by the bar graph on the right (D). All the experiments were repeated at least twice. Pooled results shown in the dot plots and bar graphs depicted means ± SEM for all the samples in each group, with each dot denoting an independent sample. **, p<0.01; ****, p<0.0001. Source data were provided in the Source Data file.
Figure 4.
Figure 4.. HIF1α-glycolysis-driven AICD governs IFN-γ production in hypoxic T cells.
A. Cell death of naïve WT CD4+ T cells activated under hypoxia for 3 days, with or without with 2-DG was measured by 7-AAD/Annexin V staining. B. Cell death of naïve WT and HIF1α−/− CD4+ T cells activated under normoxia (21% O2) and hypoxia (1% O2) for 3 days was detected by 7-AAD/Annexin V staining. C-D. Naïve WT and HIF1α−/− CD4+ T cells were activated under hypoxia, with z-VAD-fmk or without (DMSO); on day 3, cells were stained for 7-AAD/Annexin V to assess cell death (C), and on day 5, IFN-γ production was determined (D). E-F. Naïve HIF1α−/− CD4+ T cells were activated under hypoxia, with or without 20mM sodium acetate (NaAc) added on day 0; on day 3, cells were stained for7-AAD and Annexin V to assess cell death (E), and IFN-γ production was determined on day 5 (F). All the experiments were repeated at least twice. Pooled results shown in the dot plots depicted means ± SEM for all the samples in each group, with each dot denoting an independent sample. **, p<0.01; ***, p<0.001; ****, p<0.0001. Source data were provided in the Source Data file.
Figure 5.
Figure 5.. HIF1α regulates IFN-γ production in tumor-infiltrating T cells (TILs).
A-B. T cells isolated from WT or HIF1α−/− mice bearing established MB49 bladder tumor were analyzed for IFN-γ production by CD4+ and CD8+ splenocytes (A) or TILs (B). C-D. T cells isolated from WT or HIF1α−/− mice bearing established orthotopic B16-BL6 melanoma were analyzed for IFN-γ production by CD4+ and CD8+ splenocytes (C) or TILs (D). E-F. T cells isolated from WT or VHL−/− mice bearing established MB49 bladder tumor were analyzed for IFN-γ production by CD4+ and CD8+ splenocytes (E) or TILs (F). All the experiments were repeated 2–5 times. Pooled results shown in the dot plots depicted means ± SEM for all the mice in each group, with each dot denoting an independent sample. **, p<0.01; ***, p<0.001; ****, p<0.0001. Source data were provided in the Source Data file.
Figure 6.
Figure 6.. HIF1α in T cells governs therapeutic effects of ICBs.
A-B. WT and HIF1α−/− mice bearing palpable MB49 bladder tumor were treated with combined anti-CTLA-4+anti-PD-1 therapy, followed by periodic measurement of tumor volume (A); upon euthanization, tumors were weighed (B). C. IFN-γ production by CD4+ and CD8+ TILs isolated from tumor-bearing mice in A-B. D-E. WT and HIF1α−/− mice bearing palpable MB49 bladder tumor were treated with combined anti-CTLA-4+anti-PD-1 alone or in conjunction with administration of sodium acetate (NaAc), followed by periodic measurement of tumor volume (D); upon euthanization, tumors were weighed (E). F. IFN-γ production by CD4+ TILs from tumor-bearing mice in D-E. All the experiments were repeated 2–5 times. Pooled results shown in the dot plots depicted means ± SEM for all the mice in each group, with each dot denoting a mouse. *, p<0.05; **, p<0.01; ****, p<0.0001. Source data were provided in the Source Data file.

References

    1. Mosmann T. R., Cherwinski H., Bond M. W., Giedlin M. A. & Coffman R. L. Two types of murine helper T cell clone. I. Definition according to profiles of lymphokine activities and secreted proteins. J Immunol 136, 2348–2357 (1986). - PubMed
    1. Harrington L. E. et al. Interleukin 17-producing CD4+ effector T cells develop via a lineage distinct from the T helper type 1 and 2 lineages. Nat Immunol 6, 1123–1132, doi:10.1038/ni1254 (2005). - DOI - PubMed
    1. Sakaguchi S., Sakaguchi N., Asano M., Itoh M. & Toda M. Immunologic self-tolerance maintained by activated T cells expressing IL-2 receptor alpha-chains (CD25). Breakdown of a single mechanism of self-tolerance causes various autoimmune diseases. J Immunol 155, 1151–1164 (1995). - PubMed
    1. Shen H. & Shi L. Z. Metabolic regulation of TH17 cells. Mol Immunol 109, 81–87, doi:10.1016/j.molimm.2019.03.005 (2019). - DOI - PMC - PubMed
    1. Chang C. H. et al. Posttranscriptional control of T cell effector function by aerobic glycolysis. Cell 153, 1239–1251, doi:10.1016/j.cell.2013.05.016 (2013). - DOI - PMC - PubMed

Publication types

LinkOut - more resources