

This is a preprint.
Climate warming is expanding dengue burden in the Americas and Asia
- PMID: 38260629
- PMCID: PMC10802639
- DOI: 10.1101/2024.01.08.24301015
Climate warming is expanding dengue burden in the Americas and Asia
Abstract
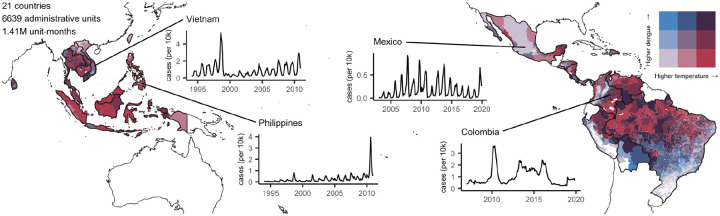
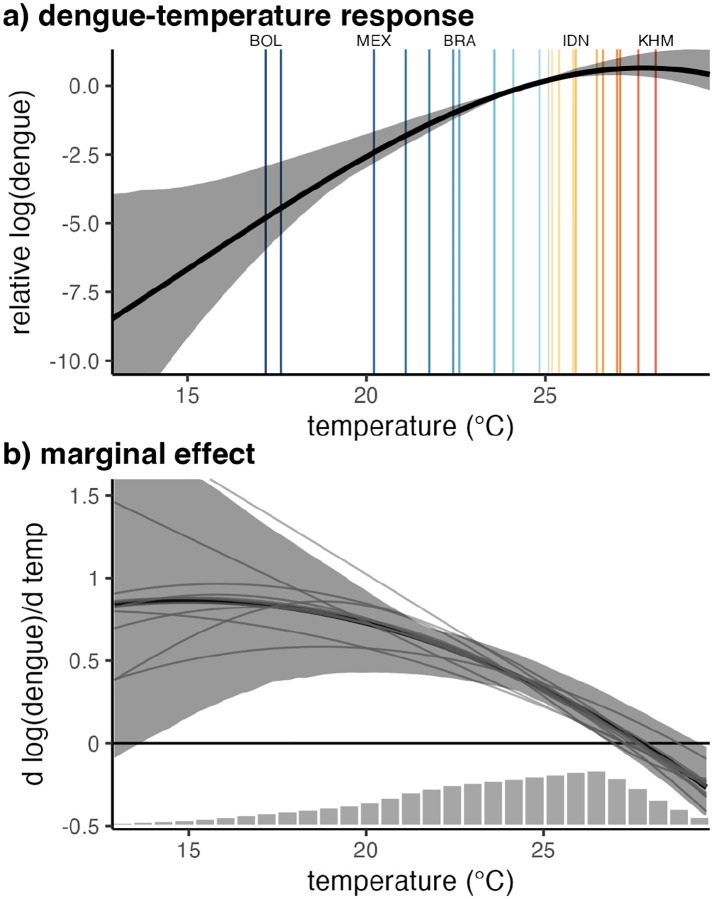
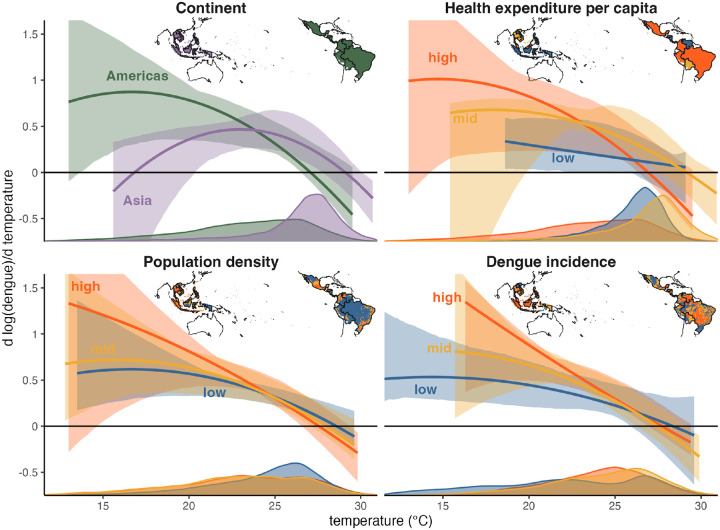
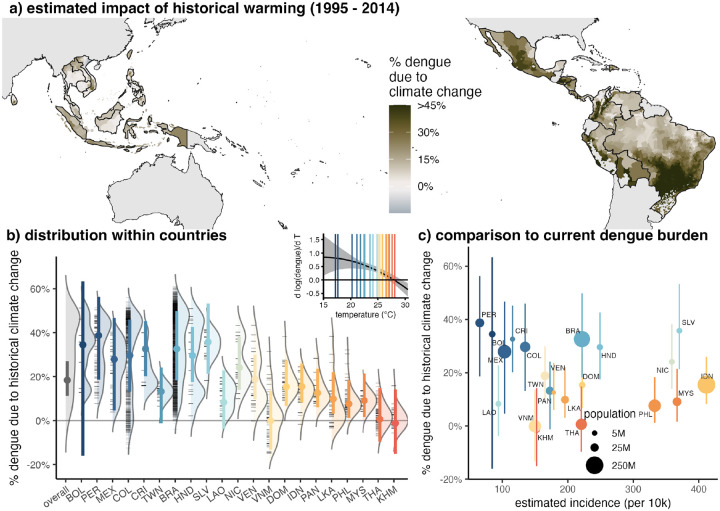
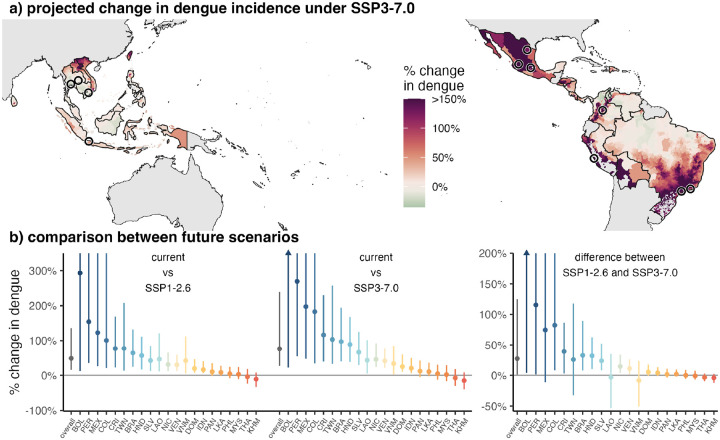
Climate change is expected to pose significant threats to public health, particularly including vector-borne diseases. Despite dramatic recent increases in the burden of dengue that many anecdotally connect with climate change, the effect of past and future anthropogenic climate change on dengue remains poorly quantified. To assess the link between climate warming and dengue we assembled a dataset covering 21 countries in Asia and the Americas, and found a nonlinear relationship between temperature and dengue incidence with the largest impact of warming at lower temperatures (below about 20°C), peak incidence at 27.8°C, and subsequent declines at higher temperatures. Using this inferred temperature response, we estimate that historical climate change has increased dengue incidence by 18% (11 - 27%) on average across our study countries, and that future warming could further increase it by 49% (16 - 136%) to 76% (27 - 239%) by mid-century for low or high emissions scenarios, respectively, with some cooler regions projected to see dengue doubling due to warming and other currently hot regions seeing no impact or even small declines. Under the highest emissions scenario, we estimate that 262 million people are currently living in places in these 21 countries where dengue incidence is expected to more than double due to climate change by mid-century. These insights highlight the major impacts of anthropogenic warming on dengue burden across most of its endemic range, providing a foundation for public health planning and the development of strategies to mitigate future risks due to climate change.
Conflict of interest statement
Competing Interests: We declare no competing interests.
Figures
Similar articles
-
Limiting global-mean temperature increase to 1.5-2 °C could reduce the incidence and spatial spread of dengue fever in Latin America.Proc Natl Acad Sci U S A. 2018 Jun 12;115(24):6243-6248. doi: 10.1073/pnas.1718945115. Epub 2018 May 29. Proc Natl Acad Sci U S A. 2018. PMID: 29844166 Free PMC article.
-
Projecting temperature-related dengue burden in the Philippines under various socioeconomic pathway scenarios.Front Public Health. 2024 Dec 23;12:1420457. doi: 10.3389/fpubh.2024.1420457. eCollection 2024. Front Public Health. 2024. PMID: 39764196 Free PMC article.
-
The effects of weather and climate change on dengue.PLoS Negl Trop Dis. 2013 Nov 14;7(11):e2503. doi: 10.1371/journal.pntd.0002503. eCollection 2013 Nov. PLoS Negl Trop Dis. 2013. PMID: 24244765 Free PMC article.
-
A Review of Dengue's Historical and Future Health Risk from a Changing Climate.Curr Environ Health Rep. 2021 Sep;8(3):245-265. doi: 10.1007/s40572-021-00322-8. Epub 2021 Jul 16. Curr Environ Health Rep. 2021. PMID: 34269994 Free PMC article. Review.
-
Global warming 2007. An update to global warming: the balance of evidence and its policy implications.ScientificWorldJournal. 2007 Mar 9;7:381-99. doi: 10.1100/tsw.2007.91. ScientificWorldJournal. 2007. PMID: 17370024 Free PMC article. Review.
References
-
- Knowlton Kim, Miriam Rotkin-Ellman Linda Geballe, Max Wendy, and Solomon Gina M.. Six Climate Change–Related Events In The United States Accounted For About $14 Billion In Lost Lives And Health Costs. Health Affairs, 30(11):2167–2176, November 2011. ISSN 0278-2715, 1544-5208. doi: 10.1377/hlthaff.2011.0229. URL http://www.healthaffairs.org/doi/10.1377/hlthaff.2011.0229. - DOI - DOI - PubMed
-
- Watts Nick, Adger W. Neil, Agnolucci Paolo, Blackstock Jason, Byass Peter, Cai Wenjia, Chaytor Sarah, Colbourn Tim, Collins Mat, Cooper Adam, Cox Peter M., Depledge Joanna, Drummond Paul, Ekins Paul, Galaz Victor, Grace Delia, Graham Hilary, Grubb Michael, Haines Andy, Hamilton Ian, Hunter Alasdair, Jiang Xujia, Li Moxuan, Kelman Ilan, Liang Lu, Lott Melissa, Lowe Robert, Luo Yong, Mace Georgina, Maslin Mark, Nilsson Maria, Oreszczyn Tadj, Pye Steve, Quinn Tara, Svensdotter My, Venevsky Sergey, Warner Koko, Xu Bing, Yang Jun, Yin Yongyuan, Yu Chaoqing, Zhang Qiang, Gong Peng, Montgomery Hugh, and Costello Anthony. Health and climate change: policy responses to protect public health. The Lancet, 386(10006):1861–1914, November 2015. ISSN 0140-6736, 1474-547X. doi: 10.1016/S0140-6736(15)60854-6. URL https://www.thelancet.com/journals/lancet/article/PIIS0140-6736(15)60854.... Publisher: Elsevier. - DOI - PubMed
-
- Limaye Vijay S., Max Wendy, Constible Juanita, and Knowlton Kim. Estimating The Costs Of Inaction And The Economic Benefits Of Addressing The Health Harms Of Climate Change: Commentary describes illuminates the costs of inaction on the climate crisis and the economic savings of addressing this problem. Health Affairs, 39(12):2098–2104, December 2020. ISSN 0278-2715, 1544-5208. doi: 10.1377/hlthaff.2020.01109. URL http://www.healthaffairs.org/doi/10.1377/hlthaff.2020.01109. - DOI - DOI - PubMed
-
- Patz Jonathan A., Gibbs Holly K., Foley Jonathan A., Rogers Jamesine V., and Smith Kirk R.. Climate Change and Global Health: Quantifying a Growing Ethical Crisis. EcoHealth, 4(4):397–405, December 2007. ISSN 1612-9202, 1612-9210. doi: 10.1007/s10393-007-0141-1. URL http://link.springer.com/10.1007/s10393-007-0141-1. - DOI - DOI
-
- Ebi Kristie L., Christofer Åström Christopher J. Boyer, Harrington Luke J., Hess Jeremy J., Honda Yasushi, Kazura Eileen, Stuart-Smith Rupert F., and Otto Friederike E. L.. Using Detection And Attribution To Quantify How Climate Change Is Affecting Health. Health Affairs, 39(12):2168–2174, December 2020. ISSN 0278-2715. doi: 10.1377/hlthaff.2020.01004. URL https://www.healthaffairs.org/doi/full/10.1377/hlthaff.2020.01004. Publisher: Health Affairs. - DOI - DOI - PubMed
Publication types
Grants and funding
LinkOut - more resources
Full Text Sources
Miscellaneous