[Preprint]. 2024 Jun 1:2023.09.14.557689.
doi: 10.1101/2023.09.14.557689.

A hierarchical atlas of the human cerebellum for functional precision mapping

Affiliations

A hierarchical atlas of the human cerebellum for functional precision mapping

Caroline Nettekoven et al. bioRxiv. .

Update in

Abstract

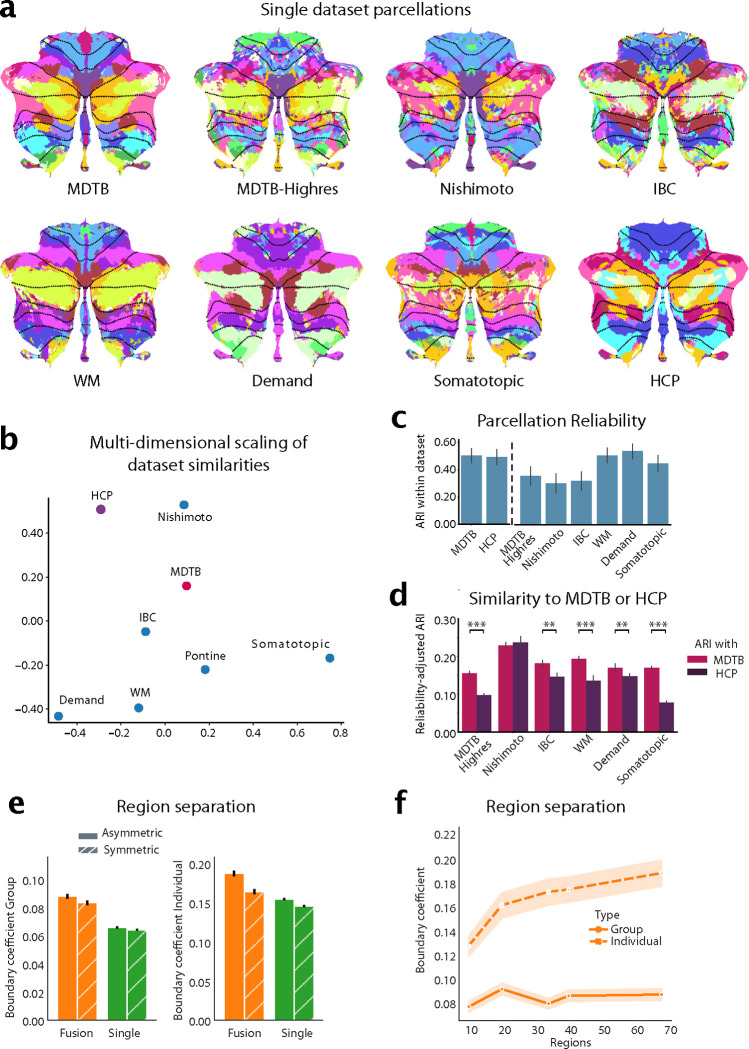
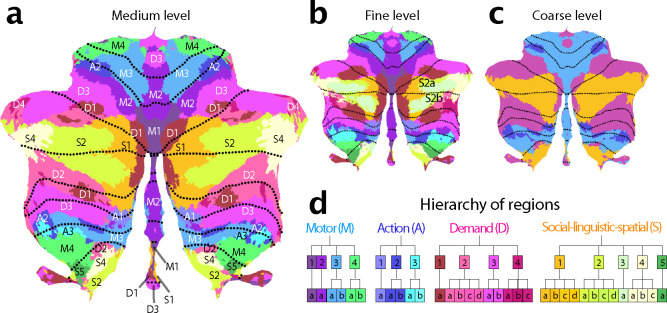
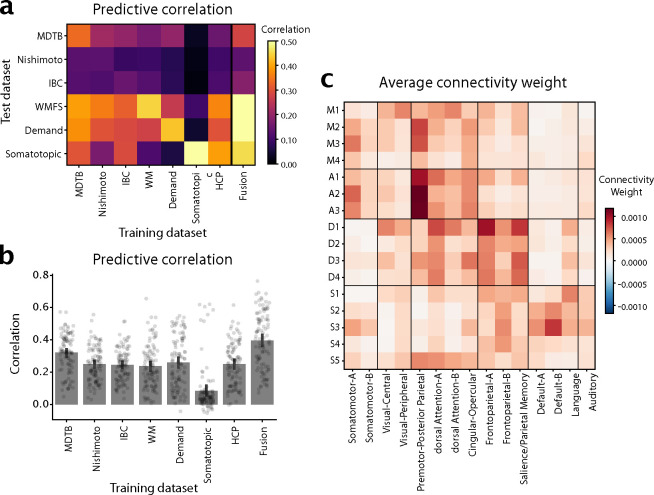
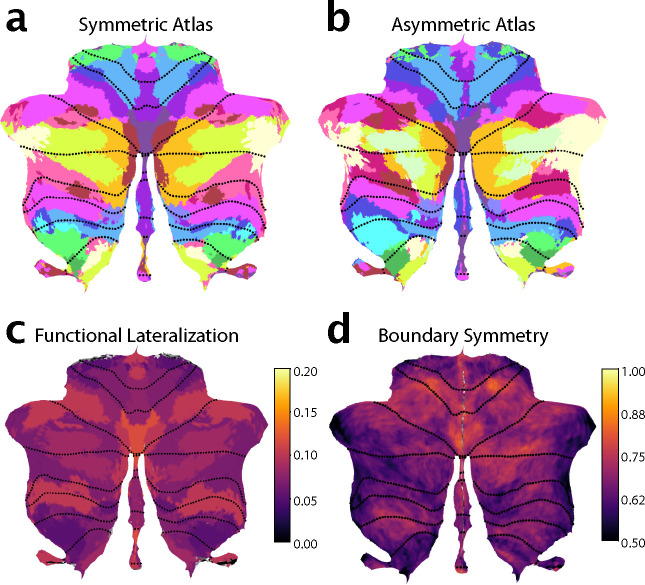
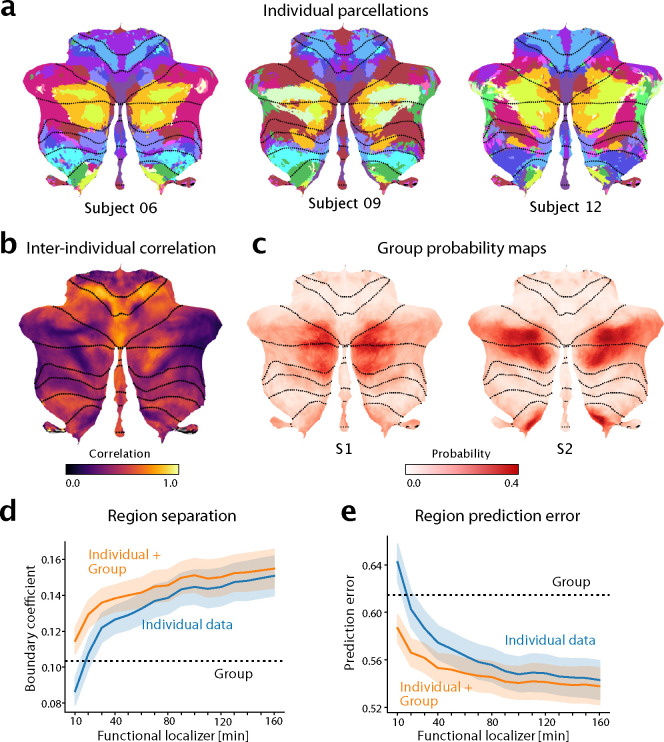
The human cerebellum is activated by a wide variety of cognitive and motor tasks. Previous functional atlases have relied on single task-based or resting-state fMRI datasets. Here, we present a functional atlas that integrates information from 7 large-scale datasets, outperforming existing group atlasses. The new atlas has three further advantages: First, the atlas allows for precision mapping in individuals: The integration of the probabilistic group atlas with an individual localizer scan results in a marked improvement in prediction of individual boundaries. Second, we provide both asymmetric and symmetric versions of the atlas. The symmetric version, which is obtained by constraining the boundaries to be the same across hemispheres, is especially useful in studying functional lateralization. Finally, the regions are hierarchically organized across 3 levels, allowing analyses at the appropriate level of granularity. Overall, the new atlas is an important resource for the study of the interdigitated functional organization of the human cerebellum in health and disease.

Keywords: Brain Atlassing; Cerebellum; Functional brain parcellation; Hierarchical Bayesian model; resting-state fMRI; task-based fMRI.


Conflict of interest statement

COMPETING INTERESTS The authors declare no competing interests.

Figures

Figure 1.
Figure 1.. Building a functional atlas of the cerebellum across datasets.
a, Parcellations (K=68) derived from each single dataset. The probabilistic parcellation is shown as a winner-take-all projection onto a flattened representation of the cerebellum [19]. Functionally similar regions are colored similarly within a parcellation (see methods: parcel similarity) and spatially similar parcels are assigned similar colors across parcellations. Dotted lines indicate lobular boundaries. b, Projection of the between-dataset adjusted Rand Index (ARI) of single-dataset parcellations into a 2d-space through multi-dimensional scaling (see methods: Single-dataset parcellations and similarity analysis of parcellations). c, Within-dataset reliability of parcellation, calculated as the mean ARI across the 5 levels of granularity (10, 20, 34, 40 and 68 regions). Errobars indicate SE of the mean across granularity pairs). d, Reliability-adjusted ARI between each single-dataset parcellations and the MDTB (task-based) and HCP (resting parcellation) parcellation. Errorbars indicate standard error of the mean across levels of granularity, ** p < 0.01, *** p < 0.0001. e, DCBC evaluation of the symmetric and asymmetric atlas averaged across granularities evaluated on the group map (left) or on individual maps derived with that atlas (right). f, DCBC evaluation of the symmetric group map and of individual maps derived from the model with 10, 20, 34, 40, and 68 regions.
Figure 2.
Figure 2.. Cerebellar functional atlas at three levels of granularity.
a, Medium granularity with 32 regions; 16 per hemisphere. The colormap represents the functional similarity of different regions (see methods: parcel similarity and clustering). b, Fine granularity with 68 regions; 34 per hemisphere. c, Coarse granularity with 4 functional domains. The symmetric version of the atlas is shown, for the asymmetric version, see Fig. 4. d, Hierarchical organization based on the functional similarity of regions, depicted as a dendrogram. The label of each region indicates the functional domain (M,A,D,S), followed by a region number (1–4), and a lower-case letter for the subregion (a-d).
Figure 3.
Figure 3.. Cerebro-cerebellar connectivity models.
a, Matrix shows the correlation between observed and predicted cerebellar activity patterns for each test dataset (rows). Connectivity models were trained on each training datasets (columns) separately. Evaluation was cross-validated across subjects when training- and test-dataset were identical. b, Correlation between observed and predicted activity patterns, averaged across test-datasets. The Fusion model used the average connectivity weights across all task-based datasets (excluding the HCP resting-state data). c, Average connectivity weights between each cerebellar region (row), and each of the 15 resting-state networks as described in [29].
Figure 4.
Figure 4.. Functional lateralization and Boundary asymmetry in the cerebellum.
a, Symmetric atlas winner-take-all map; b, Asymmetric atlas winner-take-all map; c, Functional lateralization quantified as the correlations of the functional responses of anatomically corresponding voxel of the left and right hemisphere, averaged across subjects and within each functional region. d, Boundary symmetry calculated as the correlations of the probabilistic voxel assignments between the symmetric and asymmetric version of the atlas.
Figure 5.
Figure 5.. The functional atlas improves individual precision mapping.
a, Individual parcellations from three participants, using 320min of individual data. The region colors correspond to the atlas at medium granularity (32 regions). b, Map of the average inter-subject correlations of functional profiles. Correlations are calculated between any pair of subjects in the MDTB dataset, corrected for the reliability of the data (see methods: Inter-individual variability). c, Group probability map for regions S1 and S2 (left and right combined) show the overlap of regions. d, DCBC evaluation (higher values indicate better performance) on individual parcellations (blue line) derived on 10–160min of individual functional localizing data, compared to group parcellation (dashed line) or the combination of group map and individual data (orange line). e, Equivalent analysis using prediction error (see methods, lower is better).

References

    1. Strick Peter L, Dum Richard P, and Fiez Julie A. Cerebellum and nonmotor function. Annu. Rev. Neurosci., 32:413–434, 2009. - PubMed
    1. Schmahmann Jeremy D. Disorders of the cerebellum: Ataxia, dysmetria of thought, and the cerebellar cognitive affective syndrome. J. Nurse Pract., 16(3):367–378, August 2004. - PubMed
    1. King Maedbh, Hernandez-Castillo Carlos R, Poldrack Russell A, Ivry Richard B, and Diedrichsen Jörn. Functional boundaries in the human cerebellum revealed by a multi-domain task battery. Nature neuroscience, 22(8):1371–1378, 2019. - PMC - PubMed
    1. J D Schmahmann, Doyon J, McDonald D, Holmes C, Lavoie K, Hurwitz A S, Kabani N, Toga A, Evans A, and Petrides M. Three-dimensional MRI atlas of the human cerebellum in proportional stereotaxic space. Neuroimage, 10(3 Pt 1):233–260, 1999. - PubMed
    1. J Diedrichsen, Balsters J H H, Flavell J, Cussans E, and Ramnani N. A probabilistic MR atlas of the human cerebellum. Neuroimage, 46(1):39–46, 2009. - PubMed

Publication types