. 2024 Jan 23;87(1):34.
doi: 10.1007/s00248-024-02347-6.

Effect of CO2 Concentrations on Entomopathogen Fitness and Insect-Pathogen Interactions

Affiliations

Effect of CO2 Concentrations on Entomopathogen Fitness and Insect-Pathogen Interactions

Pascal Herren et al. Microb Ecol. .

Abstract

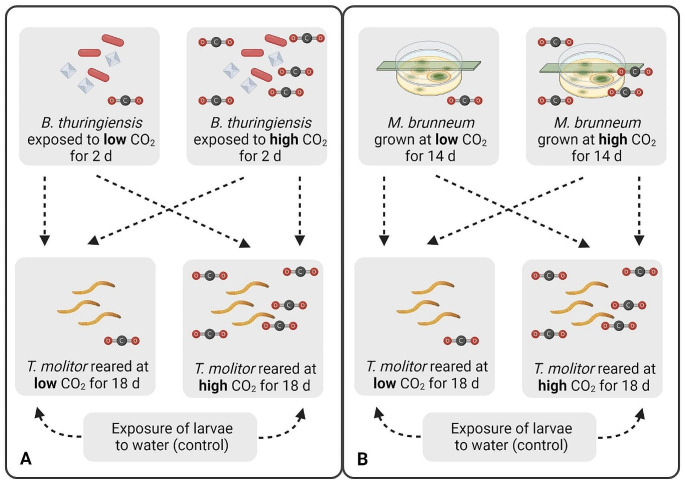
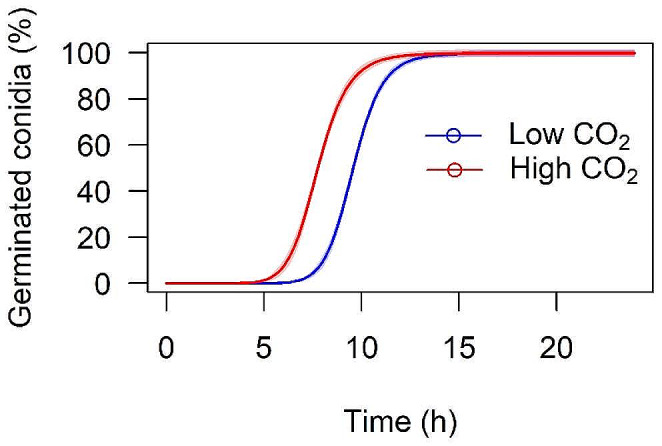
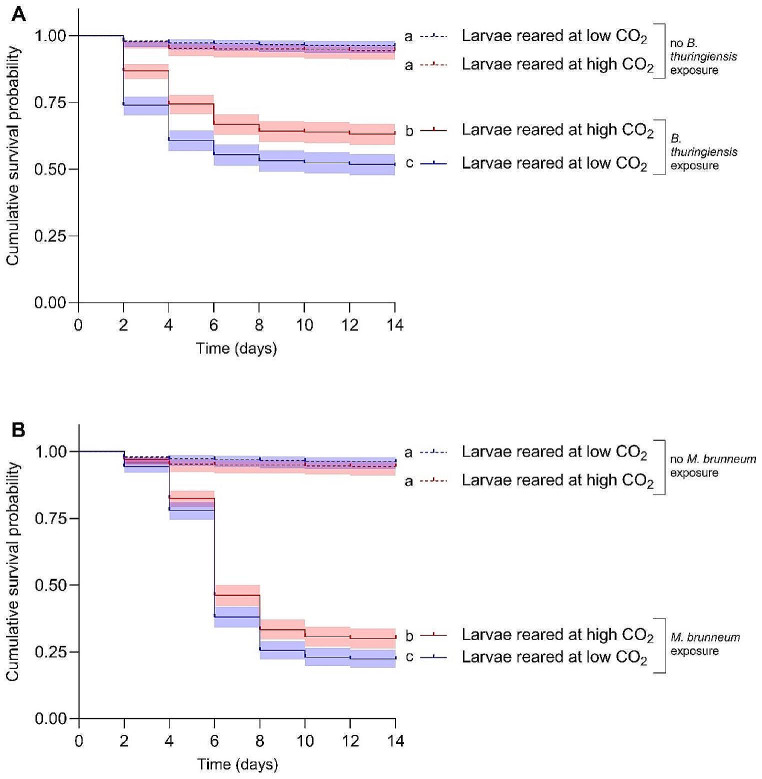
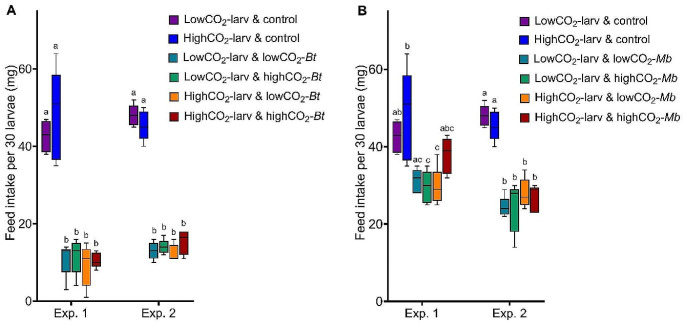
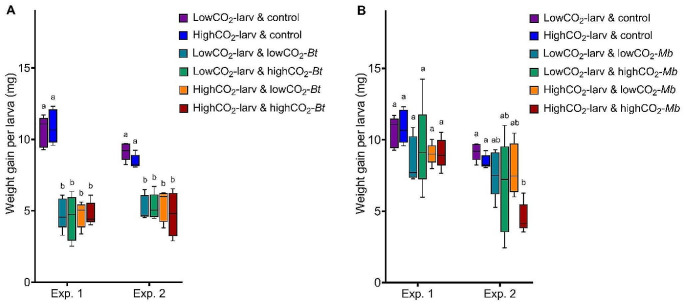
Numerous insect species and their associated microbial pathogens are exposed to elevated CO2 concentrations in both artificial and natural environments. However, the impacts of elevated CO2 on the fitness of these pathogens and the susceptibility of insects to pathogen infections are not well understood. The yellow mealworm, Tenebrio molitor, is commonly produced for food and feed purposes in mass-rearing systems, which increases risk of pathogen infections. Additionally, entomopathogens are used to control T. molitor, which is also a pest of stored grains. It is therefore important to understand how elevated CO2 may affect both the pathogen directly and impact on host-pathogen interactions. We demonstrate that elevated CO2 concentrations reduced the viability and persistence of the spores of the bacterial pathogen Bacillus thuringiensis. In contrast, conidia of the fungal pathogen Metarhizium brunneum germinated faster under elevated CO2. Pre-exposure of the two pathogens to elevated CO2 prior to host infection did not affect the survival probability of T. molitor larvae. However, larvae reared at elevated CO2 concentrations were less susceptible to both pathogens compared to larvae reared at ambient CO2 concentrations. Our findings indicate that whilst elevated CO2 concentrations may be beneficial in reducing host susceptibility in mass-rearing systems, they may potentially reduce the efficacy of the tested entomopathogens when used as biological control agents of T. molitor larvae. We conclude that CO2 concentrations should be carefully selected and monitored as an additional environmental factor in laboratory experiments investigating insect-pathogen interactions.

Keywords: Bacillus thuringiensis; Biocontrol; Host-pathogen Interactions; Insect Culture; Metarhizium brunneum; Tenebrio molitor.


Conflict of interest statement

The authors declare no competing interests.

Figures

Fig. 1
Fig. 1
Schematic representation of the experimental design. A Larvae reared at either low or high CO2 for 18 days were exposed to B. thuringiensis previously exposed to either low or high CO2 for two days or to water as a control. B Larvae reared at either low or high CO2 for 18 days were exposed to M. brunneum grown at low or high CO2 for 14 days. The lids of the Petri dishes were elevated by adding a 2 cm wide plastic strip between the lower dish and the lid. A, B Each arrow represents one treatment (12 treatments in total, n = 5, 30 larvae per cup, two experimental repetitions). The survival, feed intake and weight of the larvae were assessed every second day for a period of 14 days after pathogen exposure. Figure created with BioRender (www.biorender.com)
Fig. 2
Fig. 2
Three-parameter log-logistic models for germination of M. brunneum conidia over time (hours) at either low (e = 9.58 (confidence limits = 9.49 and 9.66); b = -12.74; d = 99.83) or high (e = 7.77 (confidence limits = 7.66 and 7.87); b = -9.83; d = 99.90) CO2 concentrations. The shaded areas represent the 95% confidence intervals
Fig. 3
Fig. 3
Survival of T. molitor larvae reared at either low (blue) or high (red) CO2 concentrations after exposure to pathogens for a period of 14 days. A Cumulative survival probability of larvae exposed to either low or high CO2 without (dotted survival curves) and with B. thuringiensis exposure (continuous survival curves). B Cumulative survival probabilities of larvae exposed to either low or high CO2 without (dotted survival curves) and with M. brunneum exposure (continuous survival curves). A, B Different letters to the right of the survival curves indicate statistical differences among treatments at p < 0.05. The shaded areas represent the 95% confidence intervals. Hazard ratios and p-values of fixed and random effects of the mixed effects cox proportional hazards models are displayed in Table 2. Figure created with GraphPad Prism version 9.3.1
Fig. 4
Fig. 4
Feed intake per 30 larvae during exposure (two days) to the pathogens. A Feed intake during exposure to B. thuringiensis in Exp. (experiment) 1 and 2: control (no exposure to B. thuringiensis), lowCO2-larv (larvae exposed to low CO2), highCO2-larv (larvae exposed to high CO2), lowCO2-Bt (B. thuringiensis exposed to low CO2), highCO2-Bt (B. thuringiensis exposed to high CO2). B Feed intake during exposure to M. brunneum in Exp. (experiment) 1 and 2: control (no exposure to M. brunneum), lowCO2-larv (larvae exposed to low CO2), highCO2-larv (larvae exposed to high CO2), lowCO2-Mb (M. brunneum grown at low CO2), highCO2-Mb (M. brunneum grown at high CO2). A, B Boxplots show median, interquartile range, and minimum and maximum. Different letters above boxplots indicate statistical differences among treatments at p < 0.05 for each experiment separately. Degrees of freedom, F-values and p-values of the two-way ANOVAs are displayed in Table 3. Figure created with GraphPad Prism version 9.3.1
Fig. 5
Fig. 5
Weight gain per larva (mg) during 14 days after exposure to the pathogens. A Weight gain after exposure to B. thuringiensis in Exp. (experiment) 1 and 2: control (no exposure to B. thuringiensis), lowCO2-larv (larvae exposed to low CO2), highCO2-larv (larvae exposed to high CO2), lowCO2-Bt (B. thuringiensis exposed to low CO2), highCO2-Bt (B. thuringiensis exposed to high CO2). B Weight gain after exposure to M. brunneum in Exp. (experiment) 1 and 2: control (no exposure to M. brunneum), lowCO2-larv (larvae exposed to low CO2), highCO2-larv (larvae exposed to high CO2), lowCO2-Mb (M. brunneum grown at low CO2), highCO2-Mb (M. brunneum grown at high CO2). A, B Boxplots show median, interquartile range, and minimum and maximum. Different letters above boxplots indicate statistical differences among treatments at p < 0.05 for each experiment separately. Degrees of freedom, F-values and p-values of the two-way ANOVAs are displayed in Table 3. Figure created with GraphPad Prism version 9.3.1

Similar articles

References

    1. Keeling RF, Keeling CD. 2017. Scripps CO2 Program Data UC San. - DOI
    1. Oonincx D, van Itterbeeck J, Heetkamp MJW, van den Brand H, van Loon JJA, van Huis A. An exploration on greenhouse gas and ammonia production by insect species suitable for animal or human consumption. PLoS ONE. 2010;5:1–7. doi: 10.1371/journal.pone.0014445. - DOI - PMC - PubMed
    1. Gorres CM, Kammann C. First field estimation of greenhouse gas release from European soil-dwelling Scarabaeidae larvae targeting the genus Melolontha. PLoS ONE. 2020;15:1–14. doi: 10.1371/journal.pone.0238057. - DOI - PMC - PubMed
    1. Howe JA, Smith AP. The soil habitat. In: Gentry TJ, Fuhrmann JJ, Zuberer DA, editors. Principles and applications of soil microbiology. 3. Amsterdam: Elsevier; 2021. pp. 23–55.
    1. Bollazzi M, Forti LC, Roces F. Ventilation of the giant nests of Atta leaf-cutting ants: does underground circulating air enter the fungus chambers? Insectes Sociaux. 2012;59:487–498. doi: 10.1007/s00040-012-0243-9. - DOI