. 2024 Feb 5;223(2):e202301062.
doi: 10.1083/jcb.202301062. Epub 2024 Jan 23.

PIGB maintains nuclear lamina organization in skeletal muscle of Drosophila

Affiliations

PIGB maintains nuclear lamina organization in skeletal muscle of Drosophila

Miki Yamamoto-Hino et al. J Cell Biol. .

Abstract

The nuclear lamina (NL) plays various roles and participates in nuclear integrity, chromatin organization, and transcriptional regulation. Lamin proteins, the main components of the NL, form a homogeneous meshwork structure under the nuclear envelope. Lamins are essential, but it is unknown whether their homogeneous distribution is important for nuclear function. Here, we found that PIGB, an enzyme involved in glycosylphosphatidylinositol (GPI) synthesis, is responsible for the homogeneous lamin meshwork in Drosophila. Loss of PIGB resulted in heterogeneous distributions of B-type lamin and lamin-binding proteins in larval muscles. These phenotypes were rescued by expression of PIGB lacking GPI synthesis activity. The PIGB mutant exhibited changes in lamina-associated domains that are large heterochromatic genomic regions in the NL, reduction of nuclear stiffness, and deformation of muscle fibers. These results suggest that PIGB maintains the homogeneous meshwork of the NL, which may be essential for chromatin distribution and nuclear mechanical properties.


Conflict of interest statement

Disclosures: The authors declare no competing interests exist.

Figures

None
Graphical abstract
Figure 1.
Figure 1.
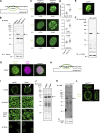
PIGB overexpression leads to mislocalization of Lamin Dm0. (A and B) WT (Mef2>lacZ) and WT PIGB-overexpressing (Mef2>wtPIGBmyc) larval wall skeletal muscle (VL3 and VL4) stained for Lamin Dm0 (green) and PIGB (magenta) at low magnification (A; bar, 50 μm) and 3D high magnification (B; bar, 10 μm). White arrowheads indicate colocalization of Lamin Dm0 and PIGB in the nucleoplasm. Actin was stained with phalloidin (blue). (C) Enlarged view of the area enclosed by the dotted box in B. White arrows indicate colocalization of Lamin Dm0 and PIGB in the cytoplasm. Bar, 1 μm. (D) Colocalization of Calr-GFP (ER marker, green, stained with an anti-GFP antibody) and overexpressed wtPIGBmyc (magenta, stained with an anti-PIGB antibody) using Mef2-Gal4. Bar, 10 μm.
Figure S1.
Figure S1.
Related to Fig. 2. (A) Schematic image of a muscle nucleus with the focal plane. Green indicates the nuclear membrane, and the dotted line indicates the focal plane. (B) Immunoblot analysis of PIGB in larval carcasses of PIGBCRP2 and PIGBCRP5. The arrow indicates PIGB. α-Tubulin was used as a loading control. (C) Distributions of Lamin Dm0, NPCs, and Lamin C in a nucleus of larval wall skeletal muscle in PIGBCRP2 (control) and PIGBCRP5 (mutant). The number at the bottom of the image is the D.I. Bar, 10 μm. (D) Quantification of the distributions of Lamin Dm0, NPCs, and Lamin C in a nucleus of larval wall skeletal muscle in the PIGBCRP2 and PIGBCRP5 larvae shown in C. 10–12 nuclei per individual were measured and the average value was plotted for six individuals (white circle). The thick black horizontal bar and thin gray horizontal bar show the mean and SD of six biological replicates, respectively; >60 nuclei analyzed per strain. The superimposed violin plot shows the distribution of the D.I. The number at the top of the graph is the P value (biological replicates = 6) calculated using the unpaired two-tailed t test. (E) Distribution of NPCs (green) in the Lamin Dm0 mutant (LamK2). Bar, 10 μm. (F) Immunoblot analysis of Lamin Dm0 in larval carcasses of CS (WT) and LamK2. The arrow indicates Lamin Dm0. α-Tubulin was used as a loading control. (G) Complementary distributions of Nup107-GFP (green) and Lamin Dm0 (magenta) in PIGB13. Bar, 10 μm. (H) Schematic image of a muscle nucleus with the focal plane for observation in I. Green indicates the nuclear membrane, and the dotted line indicates the focal plane. (I) Distributions of Lamin Dm0 (green) in nuclei of muscle, a wing disc, a ventral nerve cord, and a fat body. In the nuclear membrane of PIGB13 muscle cells, both dense regions (indicated by thick arrows) and sparse regions (indicated by thin arrows) of Lamin Dm0 are observed, while the distribution of Lamin Dm0 remains unchanged compared with the WT in other tissues. Bar, 10 μm. (J) Long-exposed and uncropped immunoblot image of Lamin Dm0 is shown in Fig. 2 D. The arrow indicates Lamin Dm0. (K) Immunoblot analysis of LBR in larval carcasses of the WT (CS) and LBR−/− (LBR31805). The arrow indicates LBR. α-Tubulin was used as a loading control. (L) 3D observation of Lamin Dm0 in the washΔ185 mutant. The surface of the nucleus is wrinkled, but Lamin Dm0 is distributed uniformly. Bar, 10 μm. Source data are available for this figure: SourceData FS1.
Figure 2.
Figure 2.
Loss of PIGB leads to disorganization of the NL. (A) Distributions of Lamin Dm0, NPCs, Lamin C, and Ote in a nucleus of larval wall skeletal muscle in PIGB27 (WT) and PIGB13 (mutant). The number at the bottom of the image is the D.I., which was obtained by normalizing the SD of intensity by the mean intensity value. Bar, 10 μm. (B) Quantification of the distributions of Lamin Dm0, NPCs, Lamin C, and Ote in a nucleus of larval wall skeletal muscle in the PIGB27 and PIGB13 larvae shown in A. 10–12 nuclei per individual were measured and the average value was plotted for six individuals (white circle). The thick black horizontal bar and thin gray horizontal bar show the mean and SD of six biological replicates, respectively; >60 nuclei analyzed per strain. The superimposed violin plot shows the distribution of the D.I. The number at the top of the graph is the P value (biological replicates = 6) calculated using the unpaired two-tailed t test. (C) 3D view of a nucleus stained with an anti-Lamin C antibody in PIGB27 and PIGB13. The white arrow indicates the ectopic lamina in the nucleoplasm of PIGB13. Bar, 10 μm. (D) Immunoblot analysis of Lamin Dm0, Lamin C, Ote, Bocks, and LBR in larval carcasses of PIGB27 and PIGB13. α-Tubulin was used as a loading control. (E) Quantification of the immunoblot analyses is shown in D. Lysates from 10 carcasses of PIGB27 and PIGB13 larvae were subjected to three independent experiments. The intensity of each band was normalized against that of α-tubulin. Normalized values in PIGB13 were compared with those in PIGB27 as a control. The thick black horizontal bar and thin gray horizontal bar show the mean and SD, respectively. White, gray, and black circles correspond to each pair in the three experiments. The number at the top of the graph is the P value (experimental replicates = 3) calculated using the paired two-tailed t test. (F) Distributions of Lamin Dm0 in larval wall skeletal muscle in mutants of the lamin-binding proteins Ote, Bocks, Koi, LBR, and wash. The number at the bottom of the image is the D.I. Bar, 10 μm. (G) Quantification of the distributions of Lamin Dm0 in mutants of the lamin-binding proteins shown in F. 10–12 nuclei per individual were measured and the average value was plotted for six individuals (white circle). The thick black horizontal bar and thin gray horizontal bar show the mean and SD of six biological replicates, respectively; >60 nuclei analyzed per strain. The superimposed violin plot shows the distribution of the D.I. The number at the top of the graph is the P value versus PIGB27 (biological replicates = 6) calculated using a one-way ANOVA with Tukey’s multiple comparison test. Source data are available for this figure: SourceData F2.
Figure 3.
Figure 3.
Abnormal localization of actin fibers in the nucleoplasm and defects of the NE. (A) Phalloidin staining (magenta) of larval wall skeletal muscle in PIGB27 within 12 h of the wandering stage (PIGB27 [<12 h]) and PIGB13 2 d later (PIGB13 [>2 d]) at low magnification. Arrows indicate actin polymerization in nuclei. Nuclei were stained with DAPI (cyan). Bar, 50 μm. (B) Percentage of larvae with nuclear actin in wall skeletal muscle in PIGB27 [<12 h], PIGB13 [<12 h], PIGB13 [>2 d], PIGBCRP2 [<12 h], PIGBCRP5 [<12 h], and PIGBCRP5 [>2 d]. 12 individuals per strain were observed. Normal (gray): individuals with no actin in the nucleus. Abnormal (black): individuals with actin in the nucleus. (C) Nuclei in A at high magnification. Bar, 10 μm. (D) 3D observation of actin (magenta) in PIGB13[>2 d]. The NE was labeled with Lamin C (green). Actin filaments localized to the nucleoplasm surrounded by Lamin C. Bar, 10 μm. (E) Nuclear membrane observed by transmission electron microscopy. White thin arrows indicate the width of the perinuclear space. White thick arrows indicate typical examples of irregularly shaped dense structures observed in the nucleoplasm of PIGB13 [<12 h] and PIGB13 [>2 d] larvae. Black arrows indicate the dense layer around nuclei in PIGB13 [>2 d]) larvae. Nuc; nucleus, rER; rough endoplasmic reticulum, Mt; mitochondria. Bar, 500 nm. (F) Dot blot of the width of the perinuclear space in PIGB27 [<12 h], PIGB13 [<12 h], and PIGB13 [>2 d] larvae. The thickness was measured at four to five locations per nucleus and the average value was plotted for five images (white circle). The thick black horizontal bar and thin gray horizontal bar show the mean and SD of five biological replicates, respectively. The superimposed violin plot shows the distribution of the thickness of the perinuclear space (n = 25 for PIGB27 [<12 h], n = 24 for PIGB13 [<12 h], and n = 23 for PIGB13 [>2 d]). The number at the top of the graph is the P value (biological replicates = 5) calculated using a one-way ANOVA with Tukey’s multiple comparison test.
Figure S2.
Figure S2.
Related to Fig. 4. (A) Membrane topology model of PIGB and the mutations in ΔactPIGB. (B) P values (biological replicates = 6) were calculated using a one-way ANOVA with Tukey’s multiple comparison test of the distributions of Lamin Dm0 and NPCs upon expression of wtPIGBmyc and PIGBmyc variants using Mef2-Gal4 shown in Fig. 4 E.
Figure 4.
Figure 4.
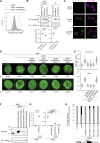
The GPI synthesis activity of PIGB is not required for the organization of the NL. (A) Surface expression of uPAR in class B mutant CHO cells transfected with wtPIGBmyc and ΔactPIGBmyc cDNA determined by flow cytometry. The PIGBmyc expression plasmid was transiently co-transfected with the EGFP expression plasmid (molecular ratio was 4:1). A total of 1 × 10⁴ GFP-positive cells, which were considered to be transfected with PIGBmyc, were evaluated. Black dotted line, class B mutant cells; red dotted line, class B mutant cells expressing wtPIGBmyc; gray line, class B mutant cells expressing ΔactPIGBmyc. (B) Immunoblot analysis of CHO class B (left) and S2 (right) cells expressing wtPIGBmyc and ΔactPIGBmyc. Proteins were detected with anti-myc and anti-α−tubulin (loading control) antibodies. The bottom graph shows the quantification of expressed PIGBmyc. The transfection experiment was performed three times (biological replicates = 3). For each transfection, the immunoblot experiment was performed three times (experimental replicates = 3). From the three experiments, the amounts of α-tubulin and PIGBmyc expressed were calculated, and the amount of PIGBmyc normalized by the amount of α-tubulin was averaged. The average value normalized by wtPIGBmyc as a control was plotted for each transfection (white circle). The thick black horizontal bar and thin gray horizontal bar show the mean and SD of three biological replicates, respectively. The number at the top of the graph is the P value (biological replicates = 3) calculated using the unpaired two-tailed t test. (C) Immunofluorescence analysis of S2 cells expressing wtPIGBmyc and ΔactPIGBmyc. Cells were stained with anti-myc (green) and anti-Lamin Dm0 (magenta) antibodies. Bar, 10 μm. (D) Rescue of the heterogeneous distributions of Lamin Dm0 (upper panel) and NPCs (lower panel) upon expression of wtPIGBmyc and PIGBmyc variants using Mef2-Gal4. The numbers and letters in parentheses indicate the position of the chromosome in which the transgene was inserted. The number at the bottom of the image is the D.I. Bar, 10 μm. (E) Quantification of the distributions of Lamin Dm0 and NPCs in a nucleus of larval wall skeletal muscle upon expression of wtPIGBmyc and PIGBmyc variants using Mef2-Gal4 shown in D. 10–12 nuclei per individual were measured and the average value was plotted for six individuals (white circle). The thick black horizontal bar and thin gray horizontal bar show the mean and SD of six biological replicates, respectively; >60 nuclei analyzed per strain. The violin plot shows the distribution of the D.I. P values (biological replicates = 3) calculated using a one-way ANOVA with Tukey’s multiple comparison test are shown in Fig. S2 B. (F) Immunoblot analysis of larval body wall muscle of Mef2-Gal4 only and PIGB13 expressing wtPIGBmyc and PIGBmyc variants using Mef2-Gal4. Proteins were detected with anti-PIGB and anti-α−tubulin (loading control) antibodies. (G) Quantification of immunoblot analyses shown in F. 3 lysates from 10 carcasses of (Mef2), (Mef2, PIGB13), and (Mef2, PIGB13 expressing wtPIGBmyc and PIGBmyc variants) larvae were prepared (biological replicates = 3). These lysates were subjected to the immunoblot experiment three times (experimental replicates = 3). From the three experiments, the amounts of α-tubulin and PIGBmyc expressed were calculated, and the amount of PIGBmyc normalized by the amount of α-tubulin was averaged. The average value was plotted for each biological replicate (white circle) normalized by Mef2 as a control. The thick black horizontal bar and thin gray horizontal bar show the mean and SD of three biological replicates, respectively. The number at the top of the graph is the P value (biological replicates = 3) calculated using the unpaired two-tailed t test for (Mef2) versus (Mef2, PIGB13 expressing 3UAS-wtPIGBmyc [68A4]) and a one-way ANOVA with Tukey’s multiple comparison test for (Mef2) versus ([Mef2, PIGB13 expressing 3UAS-ΔactPIGBmyc [68A4], 20UAS-ΔactPIGBmyc[55C4], and 3UAS-ERPIGBmyc [68A4]). (H) Percentage of larvae with nuclear actin in wall skeletal muscle for Mef2-Gal4 only (Mef2, –, [<12 h]), Mef2-Gal4, PIGB13 (Mef2, PIGB13 -, [>2 d]), and PIGB13 expressing wtPIGBmyc (Mef2, PIGB13, wt (68A4) [<12 h]), 3UAS-ΔactPIGBmyc (68A4) (Mef2, PIGB13, Δact (68A4) [>2 d]), 20UAS-ΔactPIGBmyc(55C4) ([Mef2, PIGB13, Δact [55C4] [>2 d]), and 3UAS-ERPIGBmyc (68A4) ([Mef2, PIGB13, ER [68A4] [<12 h]) using Mef2-Gal4. 36 individuals per strain were observed. Normal (gray): individuals with no actin in the nucleus. Abnormal (black): individuals with actin in the nucleus. Source data are available for this figure: SourceData F4.
Figure S3.
Figure S3.
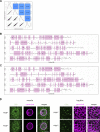
Related to Fig. 5. (A) Correlation of DamID scores between two samples for the WT and mutant when scored using 100 kb bins. (B and C) Genome-NL interaction maps for the WT (B) and PIGB13 (C) when scored using 100 kb bins. Data were obtained for 100 kb bins, and then the log2 (Dam-Lam/Dam) was averaged across biological replicates to calculate the DamID score (Y-axis) for each sample. LADs shown in pink rectangles were defined by running a hidden Markov model over the normalized values (using the R-package HMMt; https://github.com/gui11aume/HMMt; Filion et al., 2010; Leemans et al., 2019). (D) Distributions of centromeres (green) in nuclei of muscle and leg discs. The NE was labeled with Lamin Dm0 (magenta). Bar, 10 μm.
Figure 5.
Figure 5.
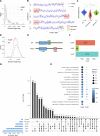
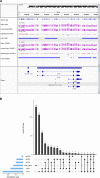
Loss of PIGB affects formation of LADs. (A) Distribution of LAD sizes in the WT (blue) and PIGB13 (red) using 100 kb bins. (B) Line plots of DamID scores only in the WT (blue) and PIGB13 (red). The DamID score was calculated by averaging the log2 (Dam-Lam/Dam) across biological replicates for each sample. Pink and green rectangles represent centromeres and telomeres, respectively. Peri-centromere and telomere regions were obtained by referring to the cytoband definition from the UCSC genome browser (Kent et al., 2002). (C) Violin plots comparing the frequency of contacts of arms, centromeres, and telomeres (log2[Dam-Lam/Dam]) in the WT versus PIGB13. ***, P < 0.001; ****, P < 0.0001 by the Wilcoxon rank sum test. ns, not significant. (D) Distribution of LAD sizes in the WT (blue) and PIGB13 (red) scored without using bins. (E) Diagram of cLADs, fLADs, and fiLADs as defined in this study. (F) Counts of cLADs, fLADs, and fiLADs. (G) Upset plot of fiLADs annotated as intron, CDS, 3UTR, 5UTR, inter_gene, and no CDS. (H) GO analysis of fiLADs and fLADs.
Figure S4.
Figure S4.
Related to Fig. 5. (A) Correlation of DamID scores between two samples for the WT and mutant when scored without using bins. (B and C) Genome-NL interaction maps for the WT (B) and PIGB13 (C) when scored without using bins. Binless data were obtained and then the log2 (Dam-Lam/Dam) was averaged across biological replicates to calculate the DamID score (Y-axis) for each sample. LADs shown in pink rectangles were defined by running a hidden Markov model over the normalized values (using the R-package HMMt; https://github.com/gui11aume/HMMt; Filion et al., 2010; Leemans et al., 2019).
Figure S5.
Figure S5.
Related to Fig. 5. (A) Genome browser results for larval wall skeletal muscle nuclei of the WT and PIGB13 along a 79 kb region of chromosome 3R. Y-axes depict the log2-transformed Dam-Lam to Dam-only methylation ratio. Rectangles below each map represent calculated LADs. (B) Upset plot of the number of fLADs annotated as intron, CDS, 3UTR, 5UTR, inter_gene, and no CDS.
Figure 6.
Figure 6.
Expression levels of genes in fiLADs in WT and PIGB-deficient larvae. mRNA levels of genes linked with muscle structure development (GO0061061) in fiLADs with high expression levels in WT (PIGB27 and PIGBCRP2) and PIGB-deficient (PIGB13 and PIGBCRP5) larvae. The genes analyzed were Z band alternatively spliced PDZ-motif protein 66 (Zasp66), Paramyosin (Prm), broad (br), cheerio (cher), thin (tn), αactinin (actn), held out wings (how), akirin, coracle (cora), and ensconsin (ens) as well as ribosomal protein L32 (rpl32) as an internal control. Three batches of mRNA from 20 carcasses of each type of larvae were prepared (biological replicates = 3). These mRNA samples were subjected to the qPCR experiment three times (experimental replicates = 3). From the three experiments, the amounts of rpl32 and each gene were calculated, and the amount of each gene normalized by that of rpl32 was averaged. The average value was plotted for each biological replicate (white circle) normalized by WT as a control. The thick black horizontal bar and thin gray horizontal bar show the mean and SD (biological replicates = 3), respectively. The number at the top of the graph is the P value (biological replicates = 3) calculated using the unpaired two-tailed t test. The actual values, means, and SD are shown in Table S1.
Figure 7.
Figure 7.
PIGB is required to maintain nuclear stiffness. (A) Schematic showing the microneedle-based setup used to analyze nuclear stiffness. A single nucleus of a fly larva muscle cell (VO4 or VO5) is captured and compressed using a pair of glass microneedles. One microneedle is rigid and used to apply controlled deformation to the nucleus (black arrow). The other microneedle is flexible and stiffness-calibrated such that the force that acts on the nucleus can be measured. (B–I) Deformability of nuclei in WT and mutant larvae. Measurements were performed with Mef2>mcherryNLS, PIGB13 (PIGB13) (B–E) or Mef2>mcherryNLS, LamK2 (LamK2) (F–I), along with the Mef2>mcherryNLS (WT) strain prepared on the same day in each experiment. (B and F) Representative time-lapse images. Nuclei (red, mCherry) were pressed by moving the stiff microneedle (upper white dots) while the flexible, force-calibrated microneedle was displaced from the equilibrium point (lower white dots). Timestamps are in seconds. Scale bars, 10 µm. (C, D, G, and H) The force-deformation plots in the WT (n = 13 in C and 15 in G), PIGB13 (n = 14) (D), and LamK2 (n = 16) (H). Measurements were first performed by pressing the nucleus via cell membrane structures (circles; labeled “nucleus + cell”) and then at locations lacking nuclei to estimate the non-nuclear contribution (squares; labeled “cell only”). Gray plots are data from individual nuclei. Colored plots are mean ± SD at each 2 µm bin. Slopes were determined by linear regression (R2 > 0.96). (E and I) Comparison of nuclear stiffness between the WT and either PIGB13 (E) or LamK2 (I). Red, WT (n = 13 and 15 in E and I, respectively); blue, PIGB13 (n = 14) (E) or LamK2 (n = 16) (I). The two right-most columns are the values after subtracting the non-nuclear contribution. Bars are SD. P values were determined by the Mann–Whitney U-test.
Figure 8.
Figure 8.
PIGB affects muscle structure independently of GPI synthesis. (A) Phalloidin staining of larval wall muscle in PIGB27 [<12 h] (upper), PIGB13 [<12 h] (middle), and PIGB13 [>2 d] (lower). Arrows indicate cracks in VL1 in PIGB13 [>2 d]. Bar, 500 μm. (B) Percentage of larvae showing cracks in skeletal wall muscle in PIGB27 [<12 h], PIGB13 [<12 h], PIGB13 [>2 d], PIGBCRP2 [<12 h], PIGBCRP5 [<12 h], and PIGBCRP5 [>2 d]. 12 individuals per strain were observed. Normal (gray): individuals with typical striated muscle. Abnormal (black): individuals with a disrupted actin pattern at the muscle cell surface. (C) Percentage of larvae showing cracks in wall skeletal muscle in Mef2-Gal4 only (Mef2, –, [<12 h]), Mef2-Gal4, PIGB13 (Mef2, PIGB13 -, [>2 d]), and PIGB13 expressing wtPIGBmyc (Mef2, PIGB13, wt (68A4) [<12 h]), 3UAS-ΔactPIGBmyc (68A4) ([Mef2, PIGB13, Δact [68A4] [>2 d]), 20UAS-ΔactPIGBmyc(55C4) ([Mef2, PIGB13, Δact [55C4] [>2 d]), and 3UAS-ERPIGBmyc (68A4) ([Mef2, PIGB13, ER [68A4] [<12 h]) using Mef2-Gal4. 36 individuals per strain were observed. Normal (gray): individuals with typical striated muscle. Abnormal (black): individuals with a disrupted actin pattern at the muscle cell surface.
Figure S6.
Figure S6.
Related to Fig. 8. Typical images of phalloidin-stained larval wall muscle in PIGB27 [<12 h] (top left three images), PIGB13 [>2 d] (top right three images), PIGBCRP2 [<12 h] (bottom left three images), and PIGBCRP5 [>2 d] (bottom right three images). Arrows indicate cracks in VL1 in PIGB-deficient larva. Bar, 500 μm.
Figure 9.
Figure 9.
Schema of the NL in PIGB-deficient nuclei. WT nuclei. Lamin Dm0, NPCs, and lamin-binding proteins are homogenously distributed and well-organized at the nuclear periphery. By contrast, in PIGB-deficient nuclei, Lamin Dm0 and lamin-binding proteins are irregularly accumulated, and NPCs are clustered. In addition, small LADs are increased, and centromeres may migrate away from the nuclear periphery.

Similar articles

Cited by

References

    1. Albuquerque-Wendt, A., Hütte H.J., Buettner F.F.R., Routier F.H., and Bakker H.. 2019. Membrane topological model of glycosyltransferases of the GT-C superfamily. Int. J. Mol. Sci. 20:20. 10.3390/ijms20194842 - DOI - PMC - PubMed
    1. Amendola, M., and van Steensel B.. 2015. Nuclear lamins are not required for lamina-associated domain organization in mouse embryonic stem cells. EMBO Rep. 16:610–617. 10.15252/embr.201439789 - DOI - PMC - PubMed
    1. Ashery-Padan, R., Ulitzur N., Arbel A., Goldberg M., Weiss A.M., Maus N., Fisher P.A., and Gruenbaum Y.. 1997. Localization and posttranslational modifications of otefin, a protein required for vesicle attachment to chromatin, during Drosophila melanogaster development. Mol. Cell. Biol. 17:4114–4123. 10.1128/MCB.17.7.4114 - DOI - PMC - PubMed
    1. Barton, L.J., Wilmington S.R., Martin M.J., Skopec H.M., Lovander K.E., Pinto B.S., and Geyer P.K.. 2014. Unique and shared functions of nuclear lamina LEM domain proteins in Drosophila. Genetics. 197:653–665. 10.1534/genetics.114.162941 - DOI - PMC - PubMed
    1. Ben-Harush, K., Wiesel N., Frenkiel-Krispin D., Moeller D., Soreq E., Aebi U., Herrmann H., Gruenbaum Y., and Medalia O.. 2009. The supramolecular organization of the C. elegans nuclear lamin filament. J. Mol. Biol. 386:1392–1402. 10.1016/j.jmb.2008.12.024 - DOI - PubMed

Publication types

MeSH terms

LinkOut - more resources