Intratumor injected gold molecular clusters for NIR-II imaging and cancer therapy
- PMID: 38261618
- PMCID: PMC10835035
- DOI: 10.1073/pnas.2318265121
Intratumor injected gold molecular clusters for NIR-II imaging and cancer therapy
Abstract
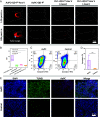
Surgical resections of solid tumors guided by visual inspection of tumor margins have been performed for over a century to treat cancer. Near-infrared (NIR) fluorescence labeling/imaging of tumor in the NIR-I (800 to 900 nm) range with systemically administrated fluorophore/tumor-targeting antibody conjugates have been introduced to improve tumor margin delineation, tumor removal accuracy, and patient survival. Here, we show Au25 molecular clusters functionalized with phosphorylcholine ligands (AuPC, ~2 nm in size) as a preclinical intratumorally injectable agent for NIR-II/SWIR (1,000 to 3,000 nm) fluorescence imaging-guided tumor resection. The AuPC clusters were found to be uniformly distributed in the 4T1 murine breast cancer tumor upon intratumor (i.t.) injection. The phosphocholine coating afforded highly stealth clusters, allowing a high percentage of AuPC to fill the tumor interstitial fluid space homogeneously. Intra-operative surgical navigation guided by imaging of the NIR-II fluorescence of AuPC allowed for complete and non-excessive tumor resection. The AuPC in tumors were also employed as a photothermal therapy (PTT) agent to uniformly heat up and eradicate tumors. Further, we performed in vivo NIR-IIb (1,500 to 1,700 nm) molecular imaging of the treated tumor using a quantum dot-Annexin V (QD-P3-Anx V) conjugate, revealing cancer cell apoptosis following PTT. The therapeutic functionalities of AuPC clusters combined with rapid renal excretion, high biocompatibility, and safety make them promising for clinical translation.
Keywords: NIR-II imaging; gold nanoclusters; imaging-guided surgery; molecular imaging of apoptosis; photothermal therapy.
Conflict of interest statement
Competing interests statement:The authors declare no competing interest.
Figures


Similar articles
-
Molecular Gold Nanoclusters for Advanced NIR-II Bioimaging and Therapy.Chem Rev. 2025 Jun 11;125(11):5195-5227. doi: 10.1021/acs.chemrev.4c00835. Epub 2025 May 28. Chem Rev. 2025. PMID: 40435324 Free PMC article. Review.
-
Phosphorylcholine-conjugated gold-molecular clusters improve signal for Lymph Node NIR-II fluorescence imaging in preclinical cancer models.Nat Commun. 2022 Sep 24;13(1):5613. doi: 10.1038/s41467-022-33341-6. Nat Commun. 2022. PMID: 36153336 Free PMC article.
-
High-precision tumor resection down to few-cell level guided by NIR-IIb molecular fluorescence imaging.Proc Natl Acad Sci U S A. 2022 Apr 12;119(15):e2123111119. doi: 10.1073/pnas.2123111119. Epub 2022 Apr 5. Proc Natl Acad Sci U S A. 2022. PMID: 35380898 Free PMC article.
-
Polydopamine coated multifunctional lanthanide theranostic agent for vascular malformation and tumor vessel imaging beyond 1500 nm and imaging-guided photothermal therapy.Theranostics. 2019 May 31;9(13):3866-3878. doi: 10.7150/thno.31864. eCollection 2019. Theranostics. 2019. PMID: 31281519 Free PMC article.
-
Recent advances in fluorescence imaging-guided photothermal therapy and photodynamic therapy for cancer: From near-infrared-I to near-infrared-II.J Control Release. 2023 Oct;362:425-445. doi: 10.1016/j.jconrel.2023.08.056. Epub 2023 Sep 8. J Control Release. 2023. PMID: 37660989 Review.
Cited by
-
Gold Nanoclusters as High Resolution NIR-II Theranostic Agents.Chem Biomed Imaging. 2024 Jun 18;2(7):462-480. doi: 10.1021/cbmi.4c00021. eCollection 2024 Jul 22. Chem Biomed Imaging. 2024. PMID: 39473532 Free PMC article. Review.
-
Luminescence Fingerprint of Intracellular NIR-II Gold Nanocluster Transformation: Implications for Sensing and Imaging.ACS Nano. 2025 Mar 4;19(8):7821-7834. doi: 10.1021/acsnano.4c13955. Epub 2025 Feb 24. ACS Nano. 2025. PMID: 39989214 Free PMC article.
-
Advancing Medical Applications of Cancer Nanotechnology: Highlighting Two Decades of the NCI'S Nanotechnology Characterization Laboratory Service to the Research Community.Wiley Interdiscip Rev Nanomed Nanobiotechnol. 2025 May-Jun;17(3):e70020. doi: 10.1002/wnan.70020. Wiley Interdiscip Rev Nanomed Nanobiotechnol. 2025. PMID: 40458962 Free PMC article. Review.
-
Intraoperative fluorescence redefining neurosurgical precision.Int J Surg. 2025 Jan 1;111(1):998-1013. doi: 10.1097/JS9.0000000000001847. Int J Surg. 2025. PMID: 38913424 Free PMC article. Review.
-
Molecular Gold Nanoclusters for Advanced NIR-II Bioimaging and Therapy.Chem Rev. 2025 Jun 11;125(11):5195-5227. doi: 10.1021/acs.chemrev.4c00835. Epub 2025 May 28. Chem Rev. 2025. PMID: 40435324 Free PMC article. Review.
References
-
- Rizzo M., et al. , The effects of additional tumor cavity sampling at the time of breast-conserving surgery on final margin status, volume of resection, and pathologist workload. Ann. Surg. Oncol. 17, 228–234 (2010). - PubMed
MeSH terms
Substances
Grants and funding
LinkOut - more resources
Full Text Sources
Medical
Miscellaneous

