. 2024 Jul 15;210(2):186-200.
doi: 10.1164/rccm.202303-0489OC.

Loss of Airway Phylogenetic Diversity Is Associated with Clinical and Pathobiological Markers of Disease Development in Chronic Obstructive Pulmonary Disease

Collaborators, Affiliations

Loss of Airway Phylogenetic Diversity Is Associated with Clinical and Pathobiological Markers of Disease Development in Chronic Obstructive Pulmonary Disease

Kristopher Opron et al. Am J Respir Crit Care Med. .

Abstract

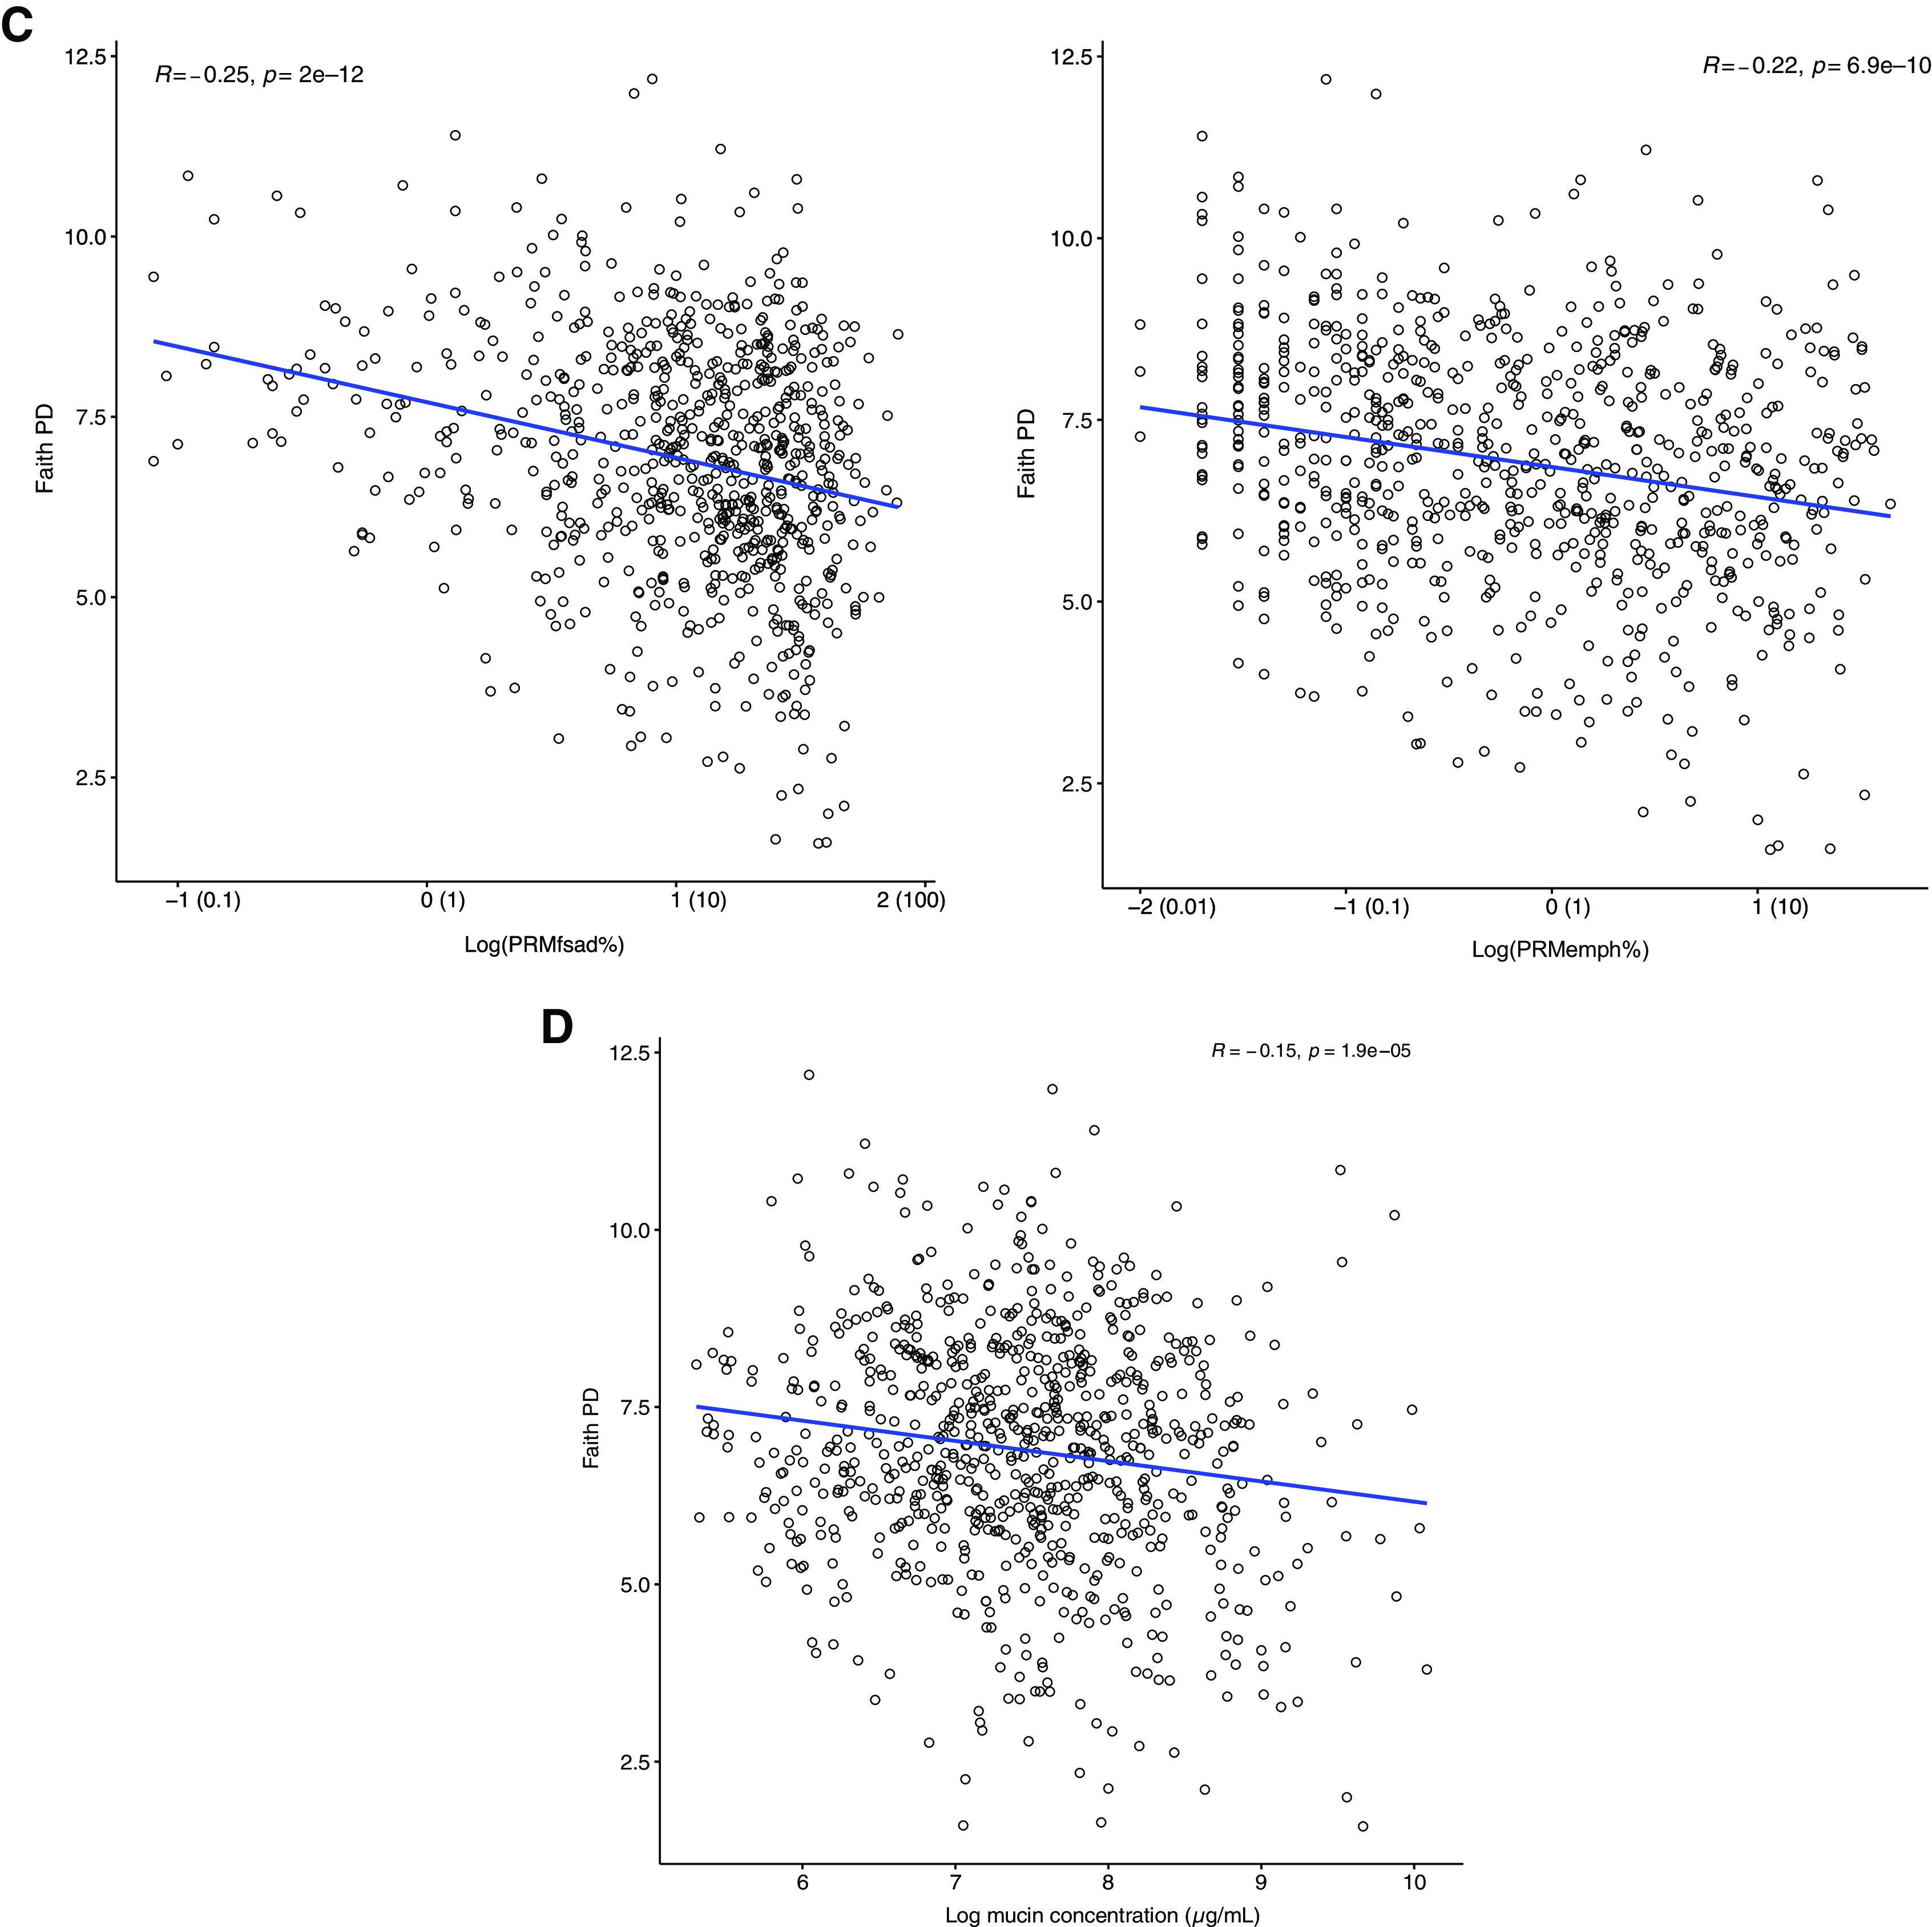
Rationale: The airway microbiome has the potential to shape chronic obstructive pulmonary disease (COPD) pathogenesis, but its relationship to outcomes in milder disease is unestablished. Objectives: To identify sputum microbiome characteristics associated with markers of COPD in participants of the Subpopulations and Intermediate Outcome Measures of COPD Study (SPIROMICS). Methods: Sputum DNA from 877 participants was analyzed using 16S ribosomal RNA gene sequencing. Relationships between baseline airway microbiota composition and clinical, radiographic, and mucoinflammatory markers, including longitudinal lung function trajectory, were examined. Measurements and Main Results: Participant data represented predominantly milder disease (Global Initiative for Chronic Obstructive Lung Disease stage 0-2 obstruction in 732 of 877 participants). Phylogenetic diversity (i.e., range of different species within a sample) correlated positively with baseline lung function, decreased with higher Global Initiative for Chronic Obstructive Lung Disease stage, and correlated negatively with symptom burden, radiographic markers of airway disease, and total mucin concentrations (P < 0.001). In covariate-adjusted regression models, organisms robustly associated with better lung function included Alloprevotella, Oribacterium, and Veillonella species. Conversely, lower lung function, greater symptoms, and radiographic measures of small airway disease were associated with enrichment in members of Streptococcus, Actinobacillus, Actinomyces, and other genera. Baseline sputum microbiota features were also associated with lung function trajectory during SPIROMICS follow-up (stable/improved, decline, or rapid decline groups). The stable/improved group (slope of FEV1 regression ⩾66th percentile) had greater bacterial diversity at baseline associated with enrichment in Prevotella, Leptotrichia, and Neisseria species. In contrast, the rapid decline group (FEV1 slope ⩽33rd percentile) had significantly lower baseline diversity associated with enrichment in Streptococcus species. Conclusions: In SPIROMICS, baseline airway microbiota features demonstrate divergent associations with better or worse COPD-related outcomes.

Keywords: lung function; microbiome; microbiota; mucin; sputum.


Figures

Figure 1.
Figure 1.
Airway bacteria phylogenetic diversity differs by (A) GOLDstage and (B) presence of chronic bronchitis in SPIROMICS (Subpopulations and Intermediate Outcome Measures of COPD Study) participants. P values calculated by ANOVA. GOLD = Global Initiative for Chronic Obstructive Lung Disease; PD = phylogenetic diversity (per Faith [22]).
Figure 2.
Figure 2.
Relationships of sputum bacterial phylogenetic diversity with (A) lung function, (B) symptom burden and 6-minute-walk distance, (C) functional small airway disease and emphysema by parametric response mapping, and (D) total mucin protein concentrations. BD = bronchodilator; CAT = Chronic Obstructive Pulmonary Disease Assessment Test; PD = phylogenetic diversity (per Faith [22]); PRMemph = parametric response mapping of emphysema; PRMfSAD = parametric response mapping of functional small airway disease; SGR = St. George’s Respiratory Questionnaire.
Figure 2.
Figure 2.
Relationships of sputum bacterial phylogenetic diversity with (A) lung function, (B) symptom burden and 6-minute-walk distance, (C) functional small airway disease and emphysema by parametric response mapping, and (D) total mucin protein concentrations. BD = bronchodilator; CAT = Chronic Obstructive Pulmonary Disease Assessment Test; PD = phylogenetic diversity (per Faith [22]); PRMemph = parametric response mapping of emphysema; PRMfSAD = parametric response mapping of functional small airway disease; SGR = St. George’s Respiratory Questionnaire.
Figure 3.
Figure 3.
Box plots of PRMfSAD in relation to phylogenetic diversity (Faith [22]) and airway total mucin concentrations by quartile (Q) (Q1, lowest; Q4, highest). Difference in Faith PD across the quartiles are based on an ANOVA (P < 0.001) with a Tukey post hoc test. PD = phylogenetic diversity; PRMfSAD = parametric response mapping of functional small airway disease.
Figure 4.
Figure 4.
Specific airway bacteria (genus, amplicon sequence variant [ASV] number) associated with each outcome in multivariable, covariate-adjusted Least Absolute Shrinkage and Selection Operator regression models. All models included as covariates age, sex, smoking status at enrollment, inhaled corticosteroid use, Faith phylogenetic diversity, and total mucin concentration. Legend coloring indicates the percentage of iterative models (out of 100) in which the ASV was selected in the outcome associations. Gray boxes indicate that the feature was not associated with the outcome. Plus or minus signs within the boxes indicate the direction of association for ASVs selected in ⩾50% of models for the outcome. Panels display the results for: (A) lung function, (B) Global Initiative for Chronic Obstructive Lung Disease (GOLD) stage at baseline (GOLD stage 0 vs. stage 1, 399 total participants; GOLD stage 0 vs. stage 2, 501 total participants; and evidence of GOLD stage progression defined by presence/absence of higher GOLD stage at follow-up [visit 5 (V5)], 365 participants). Among the 59 participants with a higher GOLD stage at V5, 24 went from GOLD stage 0 to stage 1/2; 16 from stage 1 to stage 2; 17 from stage 2 to stage 3; and 2 from stage 3 to stage 4. (C) Parametric response mapping measures of functional small airway disease, emphysema, and normal lung: baseline cohort (n = 666) and those with follow-up data analyzed from V5 scans (n = 323). (D) Symptoms by St. George’s Respiratory Questionnaire (total score) and Chronic Obstructive Pulmonary Disease Assessment Test. (E) Total mucin concentration (n = 769) and mucin subtypes (n = 275). CAT = Chronic Obstructive Pulmonary Disease Assessment Test; FEF25-75 = maximum midexpiratory forced flow; PRMemph = parametric response mapping of emphysema; PRMfSAD = parametric response mapping of functional small airway disease; SGRQ = St. George’s Respiratory Questionnaire.
Figure 5.
Figure 5.
Baseline airway microbiome features associated with longitudinal lung function outcome. (A) Baseline sputum α-diversity between the trajectory groups: stable/improved, decline, and rapid decline. (B) Bacterial genera associated with categorical FEV1 trajectory using linear discriminant analysis effect size (27). LDA = linear discriminant analysis score from linear discriminant effect size analysis (LEfSe).
Figure 6.
Figure 6.
Airway microbial ecological networks in the stable/improved versus rapid decline lung function groups in SPIROMICS (Subpopulations and Intermediate Outcome Measures of COPD Study). Inferred bacterial interactions were determined within each group using Sparse Inverse Covariance Estimation for Ecological Association Inference. The node color reflects the cluster membership of each bacterial ASV, and node size is scaled to the number of connections for each node (assigned node number for visual purposes only). The top 10 hub ASVs were identified using Kleinberg’s hub centrality scores. Values closer to 1 are indicative of greater importance in the network. Hub nodes are indicated by a heavy black border and in red text for the corresponding ASV. Box-outlined hubs in the chart are unique to that group. For visual clarity, only nodes with at least two connections are shown in the network. ASVs in blue text indicate organisms also identified by LEfSe analysis to associate with lung function trajectory (cross-hatch mark denotes a hub ASV also identified by LEfSe; see Figure E4). ASV = amplicon sequence variant; LEfSe = linear discriminant analysis effect size.

Comment in

References

    1. Mammen MJ, Sethi S. COPD and the microbiome. Respirology . 2016;21:590–599. - PubMed
    1. Huang YJ, Erb-Downward JR, Dickson RP, Curtis JL, Huffnagle GB, Han MK. Understanding the role of the microbiome in chronic obstructive pulmonary disease: principles, challenges, and future directions. Transl Res . 2017;179:71–83. - PMC - PubMed
    1. Wang Z, Locantore N, Haldar K, Ramsheh MY, Beech AS, Ma W, et al. Inflammatory endotype-associated airway microbiome in chronic obstructive pulmonary disease clinical stability and exacerbations: a multicohort longitudinal analysis. Am J Respir Crit Care Med . 2021;203:1488–1502. - PMC - PubMed
    1. Mayhew D, Devos N, Lambert C, Brown JR, Clarke SC, Kim VL, et al. AERIS Study Group Longitudinal profiling of the lung microbiome in the AERIS study demonstrates repeatability of bacterial and eosinophilic COPD exacerbations. Thorax . 2018;73:422–430. - PMC - PubMed
    1. Garcia-Nuñez M, Millares L, Pomares X, Ferrari R, Pérez-Brocal V, Gallego M, et al. Severity-related changes of bronchial microbiome in chronic obstructive pulmonary disease. J Clin Microbiol . 2014;52:4217–4223. - PMC - PubMed

Publication types