. 2024 Jun;20(6):1418-1441.
doi: 10.1080/15548627.2024.2307224. Epub 2024 Feb 25.

A novel MTORC2-AKT-ROS axis triggers mitofission and mitophagy-associated execution of colorectal cancer cells upon drug-induced activation of mutant KRAS

Affiliations

A novel MTORC2-AKT-ROS axis triggers mitofission and mitophagy-associated execution of colorectal cancer cells upon drug-induced activation of mutant KRAS

Kartini Iskandar et al. Autophagy. 2024 Jun.

Abstract

RAS is one of the most commonly mutated oncogenes associated with multiple cancer hallmarks. Notably, RAS activation induces intracellular reactive oxygen species (ROS) generation, which we previously demonstrated as a trigger for autophagy-associated execution of mutant KRAS-expressing cancer cells. Here we report that drug (merodantoin; C1)-induced activation of mutant KRAS promotes phospho-AKT S473-dependent ROS-mediated S616 phosphorylation and mitochondrial localization of DNM1L/DRP1 (dynamin 1 like) and cleavage of the fusion-associated protein OPA1 (OPA1 mitochondrial dynamin like GTPase). Interestingly, accumulation of the outer mitochondrial membrane protein VDAC1 (voltage dependent anion channel 1) is observed in mutant KRAS-expressing cells upon exposure to C1. Conversely, silencing VDAC1 abolishes C1-induced mitophagy, and gene knockdown of either KRAS, AKT or DNM1L rescues ROS-dependent VDAC1 accumulation and stability, thus suggesting an axis of mutant active KRAS-phospho-AKT S473-ROS-DNM1L-VDAC1 in mitochondrial morphology change and cancer cell execution. Importantly, we identified MTOR (mechanistic target of rapamycin kinsase) complex 2 (MTORC2) as the upstream mediator of AKT phosphorylation at S473 in our model. Pharmacological or genetic inhibition of MTORC2 abrogated C1-induced phosphorylation of AKT S473, ROS generation and mitophagy induction, as well as rescued tumor colony forming ability and migratory capacity. Finally, increase in thermal stability of KRAS, AKT and DNM1L were observed upon exposure to C1 only in mutant KRAS-expressing cells. Taken together, our work has unraveled a novel mechanism of selective targeting of mutant KRAS-expressing cancers via MTORC2-mediated AKT activation and ROS-dependent mitofission, which could have potential therapeutic implications given the relative lack of direct RAS-targeting strategies in cancer.Abbreviations: ACTB/ß-actin: actin beta; AKT: AKT serine/threonine kinase; C1/merodantoin: 1,3-dibutyl-2-thiooxo-imidazoldine-4,5-dione; CAT: catalase; CETSA: cellular thermal shift assay; CHX: cycloheximide; DKO: double knockout; DNM1L/DRP1: dynamin 1 like; GAPDH: glyceraldehyde-3-phosphate dehydrogenase; H2O2: hydrogen peroxide; HSPA1A/HSP70-1: heat shock protein family A (Hsp70) member 1A; HSP90AA1/HSP90: heat shock protein 90 alpha family class A member 1; KRAS: KRAS proto-oncogene, GTPase; MAP1LC3B/LC3B, microtubule associated protein 1 light chain 3 beta; LC3B-I: unlipidated form of LC3B; LC3B-II: phosphatidylethanolamine-conjugated form of LC3B; MAPKAP1/SIN1: MAPK associated protein 1; MAPK1/ERK2: mitogen-activated protein kinase 1; MAPK3/ERK1: mitogen-activated protein kinase 3; MFI: mean fluorescence intensity; MiNA: Mitochondrial Network Analysis; MTOR: mechanistic target of rapamycin kinase; MTORC1: mechanistic target of rapamycin kinase complex 1; MTORC2: mechanistic target of rapamycin kinase complex 2; O2.-: superoxide; OMA1: OMA1 zinc metallopeptidase; OPA1: OPA1 mitochondrial dynamin like GTPase; RICTOR: RPTOR independent companion of MTOR complex 2; ROS: reactive oxygen species; RPTOR/raptor: regulatory associated protein of MTOR complex 1; SOD1: superoxide dismutase 1; SOD2: superoxide dismutase 2; SQSTM1/p62: sequestosome 1; VDAC1: voltage dependent anion channel 1; VDAC2: voltage dependent anion channel 2.

Keywords: AKT; DNM1L; KRAS; MTORC2; ROS; mitofission.


Conflict of interest statement

Some of the data presented in the manuscript are part of the doctoral thesis of Jonathan Foo, NUS Graduate School and Department of Physiology, YLL School of Medicine, National University of Singapore, Singapore.

Figures
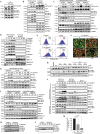
Figure 1.
Figure 1.
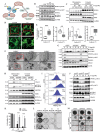
Elevated VDAC levels upon KRAS induction leads to LC3B-II accumulation in the mitochondria. Western blot analysis of indicated proteins in HCT116 cells treated with 50 μg/mL of C1 for 3 and 6 h (A) for cell lysates and (B) for cytosolic and mitochondrial fractions. GAPDH (glyceraldehyde-3-phosphate dehydrogenase), HSPA1A (heat shock protein family a (Hsp70) member 1A) and HSP90AA1 (heat shock protein 90 alpha family class a member 1) were used as loading controls. SOD2 and SOD1 (superoxide dismutase 1) were used as mitochondria and cytosolic specific controls, respectively. (C) Immunoblotting analysis of mitochondria and cytosolic fractions from HCT116 cells transfected with siKRAS or non-targeting negative siRNA control (50 nM for 48 h) and treated with C1 50 μg/mL for 3 and 6 h. GAPDH, HSPA1A and HSP90AA1 were used as loading controls. (D) Western blot analysis of indicated proteins in the mitochondria and cytosolic fractions of HCT116 cells treated with C1 (25–100 μg/mL) for 18 h. GAPDH, HSPA1A and HSP90AA1 were used as loading controls. (E) Flow cytometric analysis of mitophagy via Mtphagy Dye. HCT116 cells were pre-stained for 30 min with 1 µM Mtphagy Dye and then treated with C1 (25 and 50 μg/mL) or carbonyl cyanide m-chlorophenyl hydrazone (CCCP; 100 µM) for 12 h. MFI = mean fluorescence intensity. For flow analysis, at least 10,000 cells were analyzed by flow cytometry as described in materials and methods. (F) Confocal analysis of mitophagy via the use of Mtphagy Dye and Lyso Dye. HCT116 cells were pre-stained for 30 min with Mtphagy Dye (1 µM) before treated with C1 25–100 µg/mL for 12 h and then added Lyso Dye (1 µM for 15 min) before viewing under a confocal microscope. Red fluorescence denotes mitophagy staining, green fluorescence denotes lysosomal staining and yellow punctate staining symbolizes colocalization of both compartments. White arrows point to colocalization. Scale bar: 20 µm. (G) cells were pre-incubated for 1 h with act D (1 µM) or CHX (25 µg/mL) before treatment with C1 (50 µg/mL and 100 µg/mL) for 18 h. Lysates from mitochondrial fractions were subjected to western blot analysis using antibodies against VDAC1, VDAC2, KRAS and LC3B-II. GAPDH and HSPA1A were used as loading controls. (H) HCT116 cells were pre-treated with 25 µg/mL CHX for 1 h and then treated with C1 (100 µg/mL) for 12, 18 and 24 h. Whole cell lysates were immunoblotted for VDAC1 and LC3B-II. ACTB (actin beta) was used as the loading control. (I) HCT116 cells were transfected with siKRAS or non-targeting siRNA control (50 nM for 48 h) followed by exposure to 25–50 μg/mL of C1 for 18 h. Cytosolic and mitochondrial fractions were obtained as described in materials and methods and protein levels of VDAC1, VDAC2, SQSTM1 and KRAS were assessed by western blotting. GAPDH, HSPA1A, HSP90AA1, SOD2 and SOD1 were used as loading controls. (J) HCT116 cells (parental and AKT DKO) and HT29 cells were treated with 25–100 µg/mL of C1 for 18 h and protein levels of VDAC1, VDAC2, AKT, KRAS, LC3B-II were assessed in the mitochondrial and cytosolic fractions using western blotting. HSPA1A and GAPDH were used as loading controls. (K and L) HCT116 cells were transfected with (K) siVDAC1 or (L) siVDAC2 or non-targeting control siRNA (50 nM) for 48 h followed by incubation with 50 μg/mL of C1 for 18 h. Mitochondria fractions were immunoblotted for VDAC1, VDAC2 and LC3B-II. GAPDH was used as the loading control. (M) HCT116 cells were either treated with 50 µg/mL of C1 for 12 or 18 h and proteasomal activity was determined according to the protocol in the Biovision’s 26S proteasomal activity fluorometric assay as described in materials and methods. All data are representative of at least 3 independent experiments and shown as mean ± SD of biological triplicates. One-way ANOVA was employed for statistical analysis (**** = p < 0.0001).
Figure 2.
Figure 2.
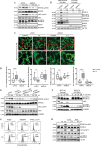
DNM1L-mediated mitofission is KRAS dependent. (A) Schematic diagram summarizing the effects of DNM1L and OPA1 on mitochondrial morphology. Shown are the phosphorylation sites on DNM1L (S616 and S637) as well as cleavage of OPA1 (S-OPA1) and their functional consequences on mitochondrial fusion and fission processes. Image created with BioRender.com. (B) HCT116 cells were treated with 50 μg/mL of C1 for 1, 3 and 6 h or forskolin (FSK, 25 µM; positive control for DNM1L p-S637 for 1 h) and expression levels of DNM1L p-S616, DNM1L p-S637, total DNM1L and OPA1 (L and S forms) were assessed in whole cell lysates using western blot analysis. GAPDH was used as the loading control. (C) HCT116 cells were treated with C1 (50–100 μg/mL for 3 and 6 h) before mitochondria and cytosolic isolation were performed. Lysates from the fractions were immunoblotted for DNM1L, SOD1 and SOD2. GAPDH was used as the loading control. (D) Representative image of HCT116 cells treated with C1 (50 μg/mL for 6 h) before staining with MitoTracker™ green FM and then viewed via confocal imaging under 200 X magnification Area demarcated by red are zoomed in as shown by the image below each respective column. Scale bar: 10 µm (E) for each sample, 30 cell images were analyzed and number of mitochondria individuals, network, network size and branch length were assessed by MiNA, an ImageJ based analysis used for studying morphological changes in mitochondria. Data were plotted on GraphPad prism V 8.0. C1-treated group were compared against control group using paired t-test (** = p < 0.01, *** = p < 0.001 and **** = p < 0.0001). (F) Representative electron microscopy images (10,000 X, 25,000 X and 50,000 X) of HCT116 cells treated with C1 (50 µg/mL for 6 h). Red box indicative of zoomed area. Scale bar: 0.5 µm, 0.2 µm and 0.1 µm respectively. (G) HCT116 cells were transfected with siDNM1L or siOMA1 or non-targeting control siRNA (50 nM for 48 h) before incubation with 25–100 μg/mL of C1 for 18 h. Lysates were analyzed by western blotting for expression levels of LC3B-II, DNM1L p-S616, DNM1L p-S637, total DNM1L, and OMA1. ACTB was used as the loading control. (H) Mitochondrial and cytosolic fractionation was carried out in HCT116 cells transfected with siDNM1L or non-targeting control siRNA (50 nM for 48 h) before incubation with 50 μg/mL of C1 for 6 h and fractions were subjected to western blot analysis for the detection of VDAC1, LC3B-II and SQSTM1. GAPDH, HSPA1A, HSP90AA1 and SOD1 were used as loading controls. (I) Flow cytometric analysis of mitophagy via Mtphagy Dye. HCT116 cells were transfected with siDNM1L or non-targeting control siRNA (50 nM for 48 h) and pre-stained for 30 min with 1 µM Mtphagy Dye before exposure to C1 (50 μg/mL for 12 h). MFI = mean fluorescence intensity. For flow analysis, at least 10,000 cells were analyzed by flow cytometry as described in materials and methods. (J) Immunoblotting analysis of DNM1L p-S616, total DNM1L, AKT p-S473, total AKT, OPA1 (L and S forms) and VDAC1 in lysates of HCT116 cells transfected with siDNM1L or siVDAC1 or non-targeting control siRNA (50 nM for 48 h) and treated with 50 μg/mL of C1 for 6 h. GAPDH was used as the loading control. (K, L and M) HCT116 cells transiently transfected with siDNM1L or non-targeting control siRNA (50 nM for 48 h) followed by treatment with C1 (25 µg/mL, 50 µg/mL or 100 µg/mL) for 18 h and (K) trypan blue dye exclusion assay was carried out to assess viability. Data shown are mean ± SD of percentage cell viability from at least 3 independent experiments. Two-way ANOVA was employed for statistical analysis. (*** = p < 0.001). (L) Effects on tumor long term colony formation and (M) tumorsphere formation was also assessed in the samples from (K). 2000 cells were reseeded on 6-well plates or low attachment spheroid plates and left for 7–10 days before staining with crystal violet or viewing under microscope under 10 X magnification respectively. Results shown are representative of 3 independent experiments. Scale bar: 200 µm.
Figure 3.
Figure 3.
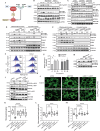
Phospho-activation of DNM1L is mutant KRAS-dependent. (A) HCT116 cells were transiently transfected with siKRAS or non-targeting control siRNA (10 nM for 48 h) and treated with 50 μg/mL of C1 for 3 and 6 h and lysates were probed for DNM1L p-S616, total DNM1L, AKT p-S473, total AKT, OPA1 (L and S forms) and KRAS. GAPDH was used as the loading control. (B) HCT116 cells were transfected as in (A) and treated with C1 for 6 h followed by the isolation of cytosolic and mitochondrial fractions. Lysates from the fractions were immunoblotted for DNM1L, KRAS, TIMM23 (translocase of inner mitochondrial membrane 23), LC3B-II, SQSTM1 and SOD1. TIMM23 and SOD1 were used as fraction-specific controls, respectively, and ACTB was used as loading control (C) HCT116 cells were transiently transfected with siKRAS or non-targeting control siRNA (10 nM for 48 h) and treated with 50 μg/mL of C1 for 6 h. Cells were then stained with MitoTracker™ green FM before confocal imaging under 200 X magnification Area demarcated with red highlight are zoomed in as shown by the image below each respective column. Scale bar: 10 µm. (D) 30 cells from 3 independent experiments were analyzed and number of mitochondria individuals, networks, network size and branch length were assessed by MiNA, an ImageJ based analysis used for studying morphological changes in mitochondria. One-way ANOVA was employed for statistical analysis. (** = p < 0.01, *** = p < 0.001, **** = p < 0.0001). (E) HCT116 cells were simultaneously transfected with siAKT1 and siAKT2 or non-targeting siRNA control (50 nM for 48 h) or pre-treated for 2 h with AKT inhibitor VIII (10 µM) or LY294002 (25 µM) followed by treatment with 50 μg/mL of C1 for 3 and 6 h. Lysates were immunoblotted for DNM1L p-S616, total DNM1L, AKT p-S473 and total AKT. GAPDH was used as the loading control. (F) HCT116 parental or AKT DKO cells were treated with C1 (25–100 μg/mL for 18 h) and whole cell lysate were immunoblotted for OPA1 (L and S forms), AKT and LC3B-II. GAPDH was used as the loading control. (G) HCT116 cells were transfected with siDNM1L (50 nM for 48 h) or non-targeting siRNA control before exposure to 100 µg/mL of C1 for 1 h. siRNA control cells were pre-treated with CAT (5000 units/mL) overnight and before the addition of C1. Cells were then loaded with CM-H2DCFDA and at least 10,000 cells were analyzed by flow cytometry as described in materials and methods. MFI = mean fluorescence intensity. Flow histogram is representative of 3 independent flow cytometry analyses. (H) HCT116 cells were pre-treated with NAC (5 mM) or CAT (5000 units/mL) for overnight followed by incubation with C1 (50 µg/mL for 3 h and 6 h). Lysates were then immunoblotted for DNM1L p-S616, total DNM1L, AKT p-S473, total AKT and OPA1 (L and S forms). ACTB was used as the loading control.
Figure 4.
Figure 4.
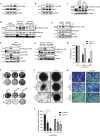
MTORC2 mediates phosphorylation of AKT S473 that triggers intracellular ROS. (A) Schematic diagram of the crosstalk between MTORC1, MTORC2 and AKT phosphorylation. Image created with BioRender.com. (B) HCT116 cells were pre-treated for 2 h with rapamycin or torin 1 (both 250 nM) followed by incubation with C1 (50 μg/mL for 3 h and 6 h) and lysates were immunoblotted for AKT p-S473, total AKT, LC3B-II, SQSTM1 and OPA1 (L and S forms). GAPDH was used as the loading control. (C) HCT116 cells were transfected with siRPTOR or siRICTOR or non-targeting siRNA control (10 nM for 48 h) and exposed to 50 μg/mL of C1 for 3 h and 6 h. Lysates were immunoblotted for AKT p-S473, total AKT, LC3B-II, SQSTM1, OPA1 (L and S forms), RPTOR and RICTOR. GAPDH was used as the loading control. (D and E) Immunoblotting analysis of mitochondria and cytosolic fractions from HCT116 cells pre-treated with rapamycin (250 nM) or torin 1 (100 nM) (D) or transfected with siRPTOR, siRICTOR or non-targeting negative siRNA control (50 nM for 48 h) (E) and then treated with C1 (50 μg/mL) for 6 h. GAPDH, HSPA1A and HSP90AA1 were used as loading controls. SOD2 and SOD1 were used as mitochondria and cytosolic specific controls respectively. (F) HCT116 cells were preincubated with torin 1 (100 nM) for 2 h, then pre-stained with 1 µM Mtphagy Dye and treated with C1 (25 and 50 μg/mL) for 18 h. At least 10,000 cells were analyzed by flow cytometry as described in materials and methods. MFI = mean fluorescence intensity. (G) Mtphagy Dye fluorescence changes are plotted by prism graph using MFI of cells upon the indicated treatments compared to untreated cells (ratio). Data are representative of at least 4 independent experiments. Two-way ANOVA was employed for statistical analysis (* = p < 0.05). (H) HCT116 cells were pre-treated for 2 h with torin 1 (100 nM) followed by treatment with 50 μg/mL of C1 for 18 h. Lysates were immunoblotted for SQSTM1 and LC3B-II. GAPDH was used as the loading control. (I) HCT116 cells were transfected with siRICTOR non-targeting siRNA control (50 nM) for 48 h or pre-incubated with torin 1 (100 nM) for 2 h before exposure to 50 μg/mL of C1 for 6 h. Lysates were immunoblotted for DNM1L p-S616, DNM1L p-S637, DNM1L, AKT p-S473, total AKT, and rictor. GAPDH was used as the loading control. (J) Representative images of HCT116 cells transfected with siRICTOR, siAKT1 and siAKT2 or non-targeting siRNA control (50 nM) for 48 h and then treated with C1 (25 μg/mL for 12 h) before staining with MitoTracker™ green FM and viewed via confocal imaging under 100 X magnification. Scale bar: 10 µm. (K-M) for each sample, 20 cell images were analyzed and mitochondrial footprint, mean summed branch lengths and mean network size (branches) were assessed by MiNA, an ImageJ based analysis used for studying morphological changes in mitochondria. Data were plotted on GraphPad prism V 8.0. C1-treated group were compared against control group using paired t-test (** = p < 0.01, *** = p < 0.001 and **** = p < 0.0001).
Figure 5.
Figure 5.
Preventing MTORC2 function rescues cells from drug-induced execution. (A to C) HCT116 cells were treated with 50 μg/mL of C1 for 3 and 6 h and whole cell lysates were probed for (A) AKT p-T308, (B) AKT p-T450 and (C) MAPKAP1 p-T86. Also, in (C), HCT116 cells were exposed to a solution of human insulin (10 ng/mL) + IGF1 (60 ng/mL) for 1 h as a positive control for MAPKAP1 p-T86. Total cell lysates were obtained from (D) HCT116 cells (parental and KRASWT/- cells) or HT29 cells treated with 50 µg/mL of C1 for 3 h and 6 h, (E) HCT116 cells transiently (48 h) transfected with siKRAS or non-targeting control siRNA (50 nM) and treated with 50 μg/mL of C1 for 3 h, (F) HCT116 cells pre-treated for 2 h with AKT inhibitor VIII (10 µM) followed by incubation with 50 μg/mL of C1 for 3 h or (G) HCT116 cells (parental and AKT DKO) treated with 50 µg/mL of C1 for 3 h. Whole cell lysates were probed for MAPKAP1 p-T86 (antibody picks up MAPKAP1 p-T86.1 of 78 kDa and occasionally the lower MAPKAP1 p-T86.2 of 74 kDa), total MAPKAP1 and KRAS. GAPDH was used as the loading control. (H) HCT116 cells were pre-treated with torin 1 (100 nM) for 2 h before treatment with 25 µg/mL or 50 μg/mL of C1 for 18 h. Cell viability was measured by the Trypan blue exclusion assay. Two-way ANOVA was employed for statistical analysis (** = p < 0.01, *** = p < 0.001). Data are representative of at least 3 independent experiments and shown as mean ± SD of biological triplicates. (I) HCT116 cells were pre-treated with rapamycin (250 nM) or torin 1 (100 nM) for 2 h before treatment with 50 μg/mL of C1 for 18 h. HCT116 cells were also transfected with siRPTOR, siRICTOR or non-targeting siRNA control (10 nM for 48 h) and then treated with 50 μg/mL of C1 for 18 h. Cells (2000) were reseeded to assess colony forming ability. (J) HCT116 cells were pre-treated with rapamycin (250 nM) or torin 1 (100 nM) for 2 h before treatment with 25 µg/mL or 50 μg/mL of C1 for 18 h and long-term 3D spheroid formation was carried out, as described in materials and methods. Results shown are representative of 3 independent experiments. Scale bar: 200 µm. (K) HCT116 cells were pre-treated with torin 1 (100 nM) for 2 h before treatment with 25 µg/mL or 50 μg/mL of C1 for 18 h and 75,000 cells were reseeded into ThinCert® cell culture inserts for 48 h and then stained with crystal violet and viewed under microscope (scale bar: 50 µm) and (L) quantified by dissolving with 33% (v:v) acetic acid and read at absorbance of 590 nm as described in materials and methods. Migration rates are plotted in percentages with respect to control cells. Data are representative of at least 3 independent experiments and shown as mean ± SD of biological triplicates. Two-way ANOVA was employed for statistical analysis (** = p < 0.01, **** = p < 0.0001).
Figure 6.
Figure 6.
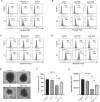
ROS production downstream of MTORC2 affects cell viability. (A and B) Flow cytometric analysis of cellular and mitochondrial ROS upon inhibiting MTORC2 or upon silencing RPTOR or RICTOR. HCT116 cells were pre-treated for 2 h with rapamycin (250 nM) or torin 1 (250 nM) before exposure to 50 μg/mL of C1 for 1 h. Cells were then loaded with (A) CM-H2DCFDA for detecting intracellular ROS or (B) MitoSOXTM Red for detecting mitochondrial O2.. (C and D) HCT116 cells were transfected with siRPTOR or siRICTOR or non-targeting siRNA control (50 nM for 48 h) and exposed to 50 µg/mL of C1 for 1 h. Cells were stained with (C) CM-H2DCFDA for detecting intracellular ROS or (D) MitoSOXTM Red for detecting mitochondrial O2.. at least 10,000 cells were analyzed. Histogram data shown are representative of at least 3 independent experiments. MFI = mean fluorescence intensity. (E) HCT116 cells were preincubated with CAT for 6 h before the addition of C1 (25 µg/mL) for 18 h and long-term 3D spheroid formation was carried out, as described in materials and methods. Scale bar: 200 µm. (F and G) spheroids in (E) were measured in diameter and area respectively via Zeiss Zen 3.7 software. Prism data shown are representative of at least 3 independent experiments.
Figure 7.
Figure 7.
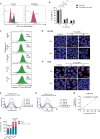
Mutant KRAS targeting effect of C1 is independent of cell cycle phase, does not involve differential accumulation or lysosomotrophic activity. (A) HCT116 cells were incubated with thymidine (2 mM) for 24 h to synchronize cells at G1/S interphase and PI staining was done to check for arrest in DNA cell cycle profile. (B) HCT116 cells were incubated with thymidine (2 mM) for 24 h followed by incubation with C1 (25–50 μg/mL) for 18 h and cell death was assessed by the CCK-8 viability assay. Two-way ANOVA was employed for statistical analysis (*= p < 0.05, **** = p < 0.0001). Data are representative of at least 3 independent experiments and shown as mean ± SD of biological triplicates. (C) HCT116 cells were treated with 100 µg/ml of C1 for 30 min, 2 h and 4 h and then stained with LysoSensorTM Green DND-189 and analyzed by flow cytometry. Treatment with bafilomycin A1 (25 nM) for 15 min was used as positive control. (D) HCT116 cells and (E) HT29 cells were stained with LysoTracker™ red DND-99 following exposure to C1 (25 µg/mL to 50 µg/mL) for 12 h or 18 h to assess lysosomal functionality and quantification. Scale bar: 50 µm. (F) UV-VIS spectra of C1 solutions at defined concentrations (25–200 μM) and supernatant from HCT116 cells treated with 100 μM or 200 μM of C1 for 3 h. (G) UV-VIS spectra of C1 solutions at defined concentrations (25–200 μM) and supernatant from HT29 cells treated with 100 μM or 200 μM of C1 for 3 h. (H) calibration curve based on the UV-VIS absorbance of C1 at 302 nm. (I) HT29 and HCT116 cells were treated with C1 (100 µM or 200 µM) for 3 h. Blue bars indicate the concentration of C1 in supernatant (Csup) measured by UV-VIS spectroscopy at 302 nm. Pink bars indicate the difference between the concentration of C1 in the stock solution (Cstock) that was added to the cells and concentration of C1 in supernatant (Csup) after 3 h treatment. Data were obtained from three independent biological replicates and are presented as mean ± SD. Statistical analysis was performed by unpaired t-test using GraphPad prism 9 software (GraphPad software Inc., CA) with p < 0.05 considered as significant (ns – not significant).
Figure 8.
Figure 8.
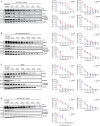
Drug-induced increase in thermal stability of KRAS, AKT and DNM1L is mutant KRAS specific. About 40 X 106 (A) HCT116 (B) HCT116 KRAS (WT/-) (C) HT29 or (D) HCT116 AKT DKO cells were treated with C1 (100 µg/mL) for 4 h and the cell samples were heat treated at 52°C to 67°C for 3 min before snapped frozen in liquid nitrogen as described in materials and methods. Soluble fractions were immunoblotted for indicated proteins and chemiluminescence intensity for each protein was quantified using ImageJ. Melting curve graphs were plotted for KRAS, AKT, DNM1L and MAPK proteins for the three different cell lines. ACTB was used as the loading control. Data are representative of at least 3 independent experiments and shown as mean ± SD of biological triplicates. Two-way ANOVA was employed for statistical analysis. (* = p < 0.05, ** = p < 0.01, *** = p < 0.001).
Figure 9.
Figure 9.
Schematic representation of drug-induced activation of mitophagy and mitofission via hyperactivated mutant KRAS-driven MTORC2-mediated phosphorylation of AKT S473. Active AKT induces increase in mitochondrial ROS and the subsequent activation of DNM1L-mediated mitofission and VDAC stability, which results in mitophagy and cellular execution. Image created with BioRender.com.

Similar articles

Cited by

References

    1. Prior IA, Hood FE, Hartley JL.. The frequency of ras mutations in cancer. Cancer Res. 2020 Jul 15;80(14):2969–2974. doi: 10.1158/0008-5472.CAN-19-3682 - DOI - PMC - PubMed
    1. Miller MS, Miller LD. RAS mutations and Oncogenesis: not all RAS mutations are created equally. Front Genet. 2011;2:100. doi: 10.3389/fgene.2011.00100 - DOI - PMC - PubMed
    1. Sakamoto K, Masutani T, Hirokawa T. Generation of KS-58 as the first K-Ras(G12D)-inhibitory peptide presenting anti-cancer activity in vivo. Sci Rep. 2020. Dec 10;10(1):21671. - PMC - PubMed
    1. Hong DS, Fakih MG, Strickler JH, et al. KRASG12C inhibition with sotorasib in advanced solid tumors. N Engl J Med. 2020. Sep 24;383(13):1207–1217. doi: 10.1056/NEJMoa1917239 - DOI - PMC - PubMed
    1. Jänne PA, Rybkin II, Spira AI, et al. KRYSTAL-1: activity and safety of adagrasib (MRTX849) in Advanced/Metastatic Non Small-Cell lung cancer (NSCLC) harboring KRAS G12C mutation. Eur J Cancer. 2020;138:S1–S2. doi: 10.1016/S0959-8049(20)31076-5 - DOI

Publication types

MeSH terms

Substances