Identification of BANF1 as a novel prognostic biomarker in gastric cancer and validation via in-vitro and in-vivo experiments
- PMID: 38261746
- PMCID: PMC10866416
- DOI: 10.18632/aging.205461
Identification of BANF1 as a novel prognostic biomarker in gastric cancer and validation via in-vitro and in-vivo experiments
Abstract
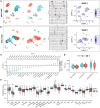
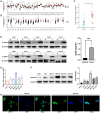
Gastric cancer (GC) is a widespread malignancy characterized by a notably high incidence rate and an unfavorable prognosis. We conducted a meticulous analysis of GC high-throughput sequencing data downloaded from the Gene Expression Omnibus (GEO) repository to pinpoint distinctive genes associated with GC. Our investigation successfully identified three signature genes implicated in GC, with a specific focus on the barrier to autointegration factor 1 (BANF1), which exhibits elevated expression across various cancer types, including GC. Bioinformatic analysis has highlighted BANF1 as a prognostic indicator for patients with GC, with direct implications for immune cell infiltration. To gain a more comprehensive understanding of the significance of BANF1 in GC, we performed a series of in vitro experiments to confirm its high expression in GC tissues and cellular components. Intriguingly, the induction of BANF1 knockdown resulted in a marked attenuation of proliferation, migratory capacity, and invasive potential in GC cells. Moreover, our in vivo experiments using nude mouse models revealed a notable impediment in tumor growth following BANF1 knockdown. These insights underscore the feasibility of BANF1 as a novel therapeutic target for GC.
Keywords: GEO; TCGA; barrier to autointegration factor 1; gastric cancer; overall survival.
Conflict of interest statement
Figures


Similar articles
-
Barrier-to-autointegration factor 1: A novel biomarker for gastric cancer.Oncol Lett. 2018 Nov;16(5):6488-6494. doi: 10.3892/ol.2018.9432. Epub 2018 Sep 11. Oncol Lett. 2018. PMID: 30405787 Free PMC article.
-
PYCR1, BANF1, and STARD8 Expression in Gastric Carcinoma: A Clinicopathologic, Prognostic, and Immunohistochemical Study.Appl Immunohistochem Mol Morphol. 2024 Feb 1;32(2):102-110. doi: 10.1097/PAI.0000000000001173. Epub 2023 Nov 20. Appl Immunohistochem Mol Morphol. 2024. PMID: 37982568
-
Identification of GNG7 as a novel biomarker and potential therapeutic target for gastric cancer via bioinformatic analysis and in vitro experiments.Aging (Albany NY). 2023 Feb 24;15(5):1445-1474. doi: 10.18632/aging.204545. Epub 2023 Feb 24. Aging (Albany NY). 2023. PMID: 36863706 Free PMC article.
-
Identification and validation of biomarkers for epithelial-mesenchymal transition-related cells to estimate the prognosis and immune microenvironment in primary gastric cancer by the integrated analysis of single-cell and bulk RNA sequencing data.Math Biosci Eng. 2023 Jun 16;20(8):13798-13823. doi: 10.3934/mbe.2023614. Math Biosci Eng. 2023. PMID: 37679111
-
Clinicopathological and prognostic value of lysyl oxidase expression in gastric cancer: a systematic review, meta-analysis and bioinformatic analysis.Sci Rep. 2022 Oct 6;12(1):16786. doi: 10.1038/s41598-022-21402-1. Sci Rep. 2022. PMID: 36202905 Free PMC article.
Cited by
-
BANF1 is a novel prognostic biomarker linked to immune infiltration in head and neck squamous cell carcinoma.Front Immunol. 2024 Oct 8;15:1465348. doi: 10.3389/fimmu.2024.1465348. eCollection 2024. Front Immunol. 2024. PMID: 39439799 Free PMC article.
-
VRK1/BANF1/GLI1 Axis Regulates Tumor Development and Progression of Colorectal Cancer.Int J Biol Sci. 2025 Apr 28;21(7):3144-3163. doi: 10.7150/ijbs.107279. eCollection 2025. Int J Biol Sci. 2025. PMID: 40384864 Free PMC article.
-
Exploring the promise of regulator of G Protein Signaling 20: insights into potential mechanisms and prospects across solid cancers and hematological malignancies.Cancer Cell Int. 2024 Sep 3;24(1):305. doi: 10.1186/s12935-024-03487-y. Cancer Cell Int. 2024. PMID: 39227952 Free PMC article. Review.
-
Integration of histopathological image features and multi-dimensional omics data in predicting molecular features and survival in glioblastoma.Front Med (Lausanne). 2025 Apr 23;12:1510793. doi: 10.3389/fmed.2025.1510793. eCollection 2025. Front Med (Lausanne). 2025. PMID: 40337276 Free PMC article.
References
-
- Costa L, Corre S, Michel V, Le Luel K, Fernandes J, Ziveri J, Jouvion G, Danckaert A, Mouchet N, Da Silva Barreira D, Torres J, Camorlinga M, D'Elios MM, et al.. USF1 defect drives p53 degradation during Helicobacter pylori infection and accelerates gastric carcinogenesis. Gut. 2020; 69:1582–91. 10.1136/gutjnl-2019-318640 - DOI - PMC - PubMed
Publication types
MeSH terms
Substances
LinkOut - more resources
Full Text Sources
Medical
Molecular Biology Databases
Miscellaneous

