. 2024 Jan;14(1):292-303.
doi: 10.1016/j.apsb.2023.10.010. Epub 2023 Oct 21.

Targeting stroma and tumor, silencing galectin 1 treats orthotopic mouse hepatocellular carcinoma

Affiliations

Targeting stroma and tumor, silencing galectin 1 treats orthotopic mouse hepatocellular carcinoma

Tahereh Setayesh et al. Acta Pharm Sin B. 2024 Jan.

Abstract

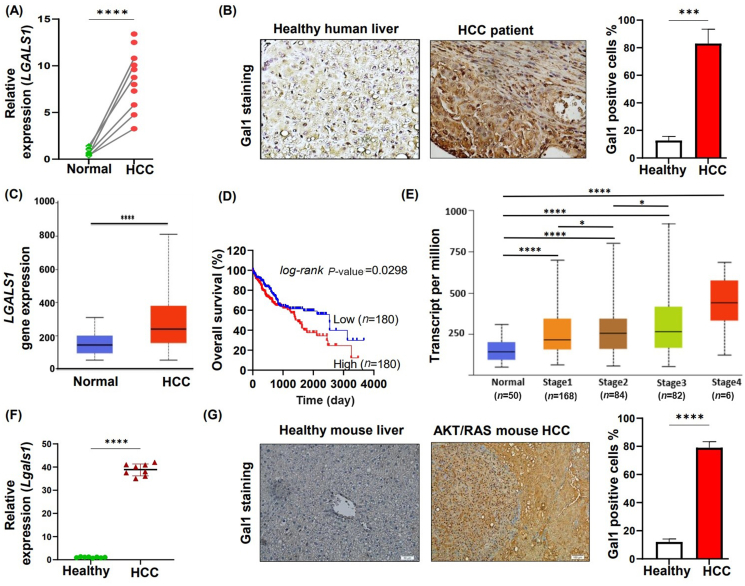
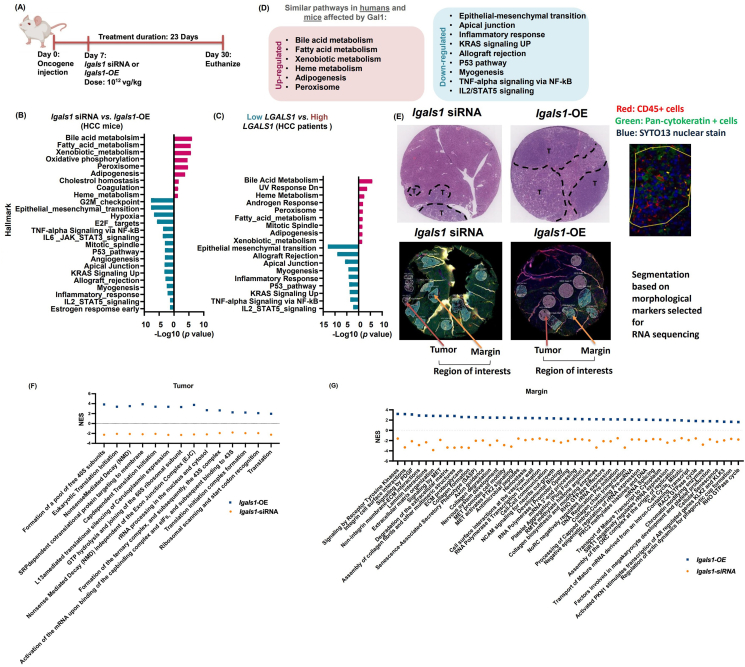
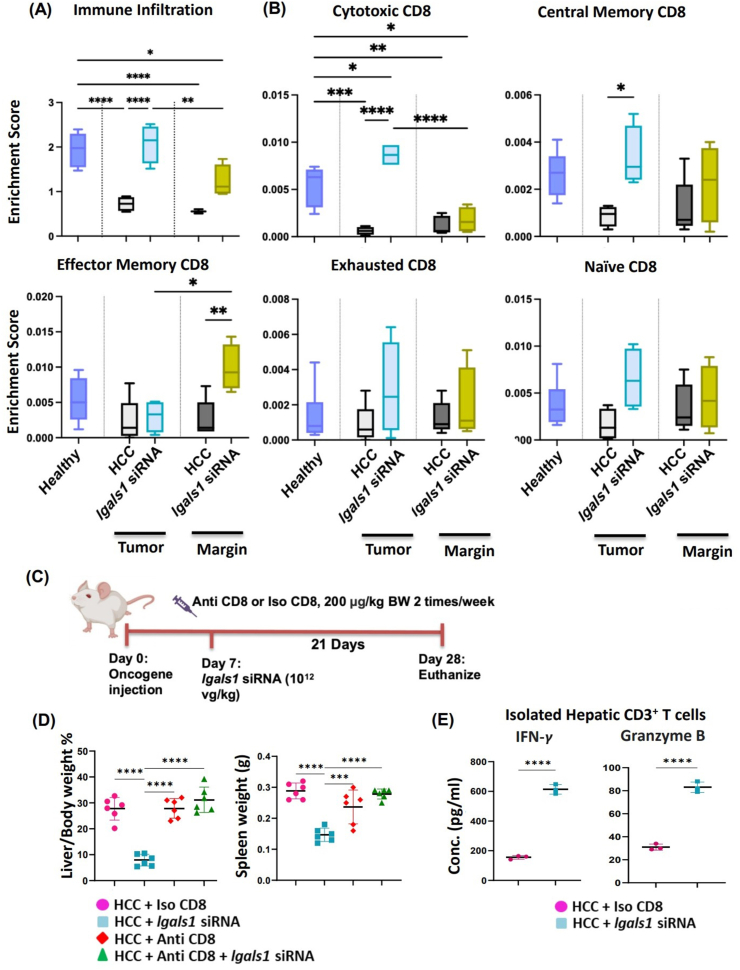
This study examines inhibiting galectin 1 (Gal1) as a treatment option for hepatocellular carcinoma (HCC). Gal1 has immunosuppressive and cancer-promoting roles. Our data showed that Gal1 was highly expressed in human and mouse HCC. The levels of Gal1 positively correlated with the stages of human HCC and negatively with survival. The roles of Gal1 in HCC were studied using overexpression (OE) or silencing using Igals1 siRNA delivered by AAV9. Prior to HCC initiation induced by RAS and AKT mutations, lgals1-OE and silencing had opposite impacts on tumor load. The treatment effect of lgals1 siRNA was further demonstrated by intersecting HCC at different time points when the tumor load had already reached 9% or even 42% of the body weight. Comparing spatial transcriptomic profiles of Gal1 silenced and OE HCC, inhibiting matrix formation and recognition of foreign antigen in CD45+ cell-enriched areas located at tumor-margin likely contributed to the anti-HCC effects of Gal1 silencing. Within the tumors, silencing Gal1 inhibited translational initiation, elongation, and termination. Furthermore, Gal1 silencing increased immune cells as well as expanded cytotoxic T cells within the tumor, and the anti-HCC effect of lgals1 siRNA was CD8-dependent. Overall, Gal1 silencing has a promising potential for HCC treatment.

Keywords: Carbohydrate-binding lectin; Extracellular matrix; Galectin 1; Hepatocellular carcinoma; Liver; Spatial transcriptomics; Translation; Tumor-margin.


Conflict of interest statement

The authors declare no potential competing interests.

Figures

Image 1
Graphical abstract
Figure 1
Figure 1
Gal1 is overexpressed in human and mouse HCC. (A) mRNA levels of LGALS1 in tumors (n = 11) and histological normal livers (n = 9) of HCC patients. Among them, six tumors and adjacent normal tissues were paired, i.e., derived from the same patients. (B) Representative Gal1 immunohistochemistry staining in a healthy human liver and HCC patient; percentage of Gal1 positive cells were counted in 5 random fields. Data are shown as mean ± SD. (C) The Cancer Genome Atlas (TCGA) data analysis shows elevated LGALS1 expression in human HCCs (n = 370) compared to normal livers (n = 50). (D) Kaplan–Meier analysis of overall survival of patients with HCC according to LGALS1 expression levels (n = 360 patients, TCGA data set, P = 0.0298). (E) Gal1 transcript per million in different stages of HCC; normal (n = 50), stage 1 (n = 168), stage 2 (n = 84), stage 3 (n = 82), and stage 4 (n = 6). (F) mRNA levels of Lgals1 in healthy mouse livers and Akt/Ras-induced HCCs Data are shown as mean ± SD (n = 8). (G) Representative Gal1 immunohistochemistry staining in a normal liver and Akt/Ras-induced mouse HCC; percentage of Gal1 positive cells were counted in 5 random fields. Data are shown as mean ± SD (n = 4). t-Test and ANOVA were used, Tukey; ∗P < 0.05; ∗∗P < 0.01; ∗∗∗P < 0.001; ∗∗∗∗P < 0.0001.
Figure 2
Figure 2
Gal1 silencing attenuates carcinogenesis, while overexpression of Gal1 accelerates tumorigenesis. (A) Experimental scheme. Gal1 silenced by i.v. injection of lgals1 siRNA-AAV9 (lgals1 siRNA) or overexpressed by i.v. injection of lgals1-AAV9 (lgals1-OE) (10 genome copy/kg BW), which took place 3 days prior to oncogene injection. Control HCC mice received either scramble AAV9 or blank AAV9. Mice were euthanized 31 days after lgals1 treatments. (B) Liver to body weight ratio. (C) Spleen weight. (D) Representative liver gross morphology and H&E-stained liver sections. (E) Gal1 immunohistochemistry staining. (F) Histological scores were quantitively evaluated based on criteria detailed in Table S1. (G) Liver fibrosis was measured by hepatic hydroxyproline assay. (H) Relative mRNA levels. Data are shown as mean ± SD (n = 4/group). ANOVA, Tukey, was used; ∗P < 0.05; ∗∗P < 0.01; ∗∗∗P < 0.001; ∗∗∗∗P < 0.0001.
Figure 3
Figure 3
Gal1 silencing treats HCC and prolongs overall survival. (A) Experimental scheme. HCC mice of both sexes were treated with lgals1 siRNA 7 days after myr-Akt1 and N-RasV12 injection and euthanized 30 days later (n = 4/group). (B) Liver to body weight ratio. (C) Spleen weight. (D) H&E-stained liver sections (magnification 400 × or 40 × ). (E) Kaplan–Meier survival curves. Mice were euthanized when they were moribund, and the death date was recorded as the next day. Log-rank test was performed (n = 11–14/group). (F) TUNEL assay staining. Nuclei stained with the TUNEL assay are brown. Sections were counterstained with Methyl Green. The percentage of positive TUNEL apoptosis-positive cells. (G) Experimental scheme. Male mice were treated with lgals1 siRNA 44 days after myr-Akt1 and N-RasV12 injection and euthanized 57 days later (n = 6/group). (H) Liver to body weight ratio. (I) Relative mRNA levels of HCC markers. Data are shown as mean ± SD (n = 4–6/group). ANOVA, Tukey, was used; ∗P < 0.05; ∗∗P < 0.01; ∗∗∗P < 0.001; ∗∗∗∗P < 0.0001.
Figure 4
Figure 4
Gal1 silencing reverses the signaling that is enriched due to carcinogenesis. (A) Experimental scheme. Male mice were treated with either lgals1 siRNA or lgals1-OE, seven days after myr-Akt1 and N-RasV12 injection and were euthanized 30 days later (n = 5/group). (B) lgals1 siRNA (low-Gal1) compared to lgals1-OE (high-Gal1) in mouse HCC. (C) Enriched pathways in HCC patients with low vs. high LGALS1 levels. A positive (upregulated) normalized enrichment score (NES) value is in red, and the negative (downregulated) NES is in blue. (D) The same up and down-regulated pathways were found in mice and human HCC based on Gal1 expression level (n = 3–4). (E) An example of selecting a region of interest (ROI) and further segmentation to select the area of interest illumination of interest (AOI) based on markers CD45 or pan-cytokeratin. (F, G) Pathways (based on Reactome) that significantly changed in opposite directions due to Gal1 silencing and OE in the tumors and at the margin of CD45+ cells. The significant enrichment was considered at FDR<25%.
Figure 5
Figure 5
The therapeutic effect of silencing Gal1 is CD8 T cell-dependent. (A) Infiltration score of CD45+ cells in the tumors and at the tumor margins. (B) Normalized enrichment score of CD8+ T cells subtypes in the tumors and margins. (C) Experimental scheme. Mice were treated with lgals1 siRNA 7 days after Akt/Ras-induced HCC and/or with anti-CD8 antibodies (n = 5–6/group) or iso CD8 (200 μg/kg BW, i.p., 2 times/week), then euthanized 28 days later. (D) Liver to body weight ratio and spleen weight. (E) The concentrations of IFN-gamma (IFN-γ, pg/mL) and granzyme B (pg/mL) produced by isolated hepatic CD3+ T cells (3 mice/group). Data are shown as mean ± SD (3–6 mice/group). ANOVA, Tukey, was used; ∗P < 0.05; ∗∗P < 0.01; ∗∗∗P < 0.001; and ∗∗∗∗P < 0.0001.

References

    1. Ferlay J., Colombet M., Soerjomataram I., Parkin D.M., Piñeros M., Znaor A., et al. Cancer statistics for the year 2020: an overview. Int J Cancer. 2021;149:778–789. - PubMed
    1. Colquhoun S.D., Wan Y.Y. Hepatocellular carcinoma diagnosis and treatment: an overview. Liver Res. 2020;4:159–160. - PMC - PubMed
    1. Yang J.D., Hainaut P., Gores G.J., Amadou A., Plymoth A., Roberts L.R. A global view of hepatocellular carcinoma: trends, risk, prevention and management. Nat Rev Gastroenterol Hepatol. 2019;16:589–604. - PMC - PubMed
    1. Perillo N.L., Pace K.E., Seilhamer J.J., Baum L.G. Apoptosis of T cells mediated by galectin-1. Nature. 1995;378:736–739. - PubMed
    1. Setayesh T., Colquhoun S.D., Wan Y.Y. Overexpression of galectin-1 and galectin-3 in hepatocellular carcinoma. Liver Res. 2020;4:173–179. - PMC - PubMed