. 2024 Jan;14(1):223-240.
doi: 10.1016/j.apsb.2023.09.015. Epub 2023 Sep 25.

A multidimensional platform of patient-derived tumors identifies drug susceptibilities for clinical lenvatinib resistance

Affiliations

A multidimensional platform of patient-derived tumors identifies drug susceptibilities for clinical lenvatinib resistance

Lei Sun et al. Acta Pharm Sin B. 2024 Jan.

Abstract

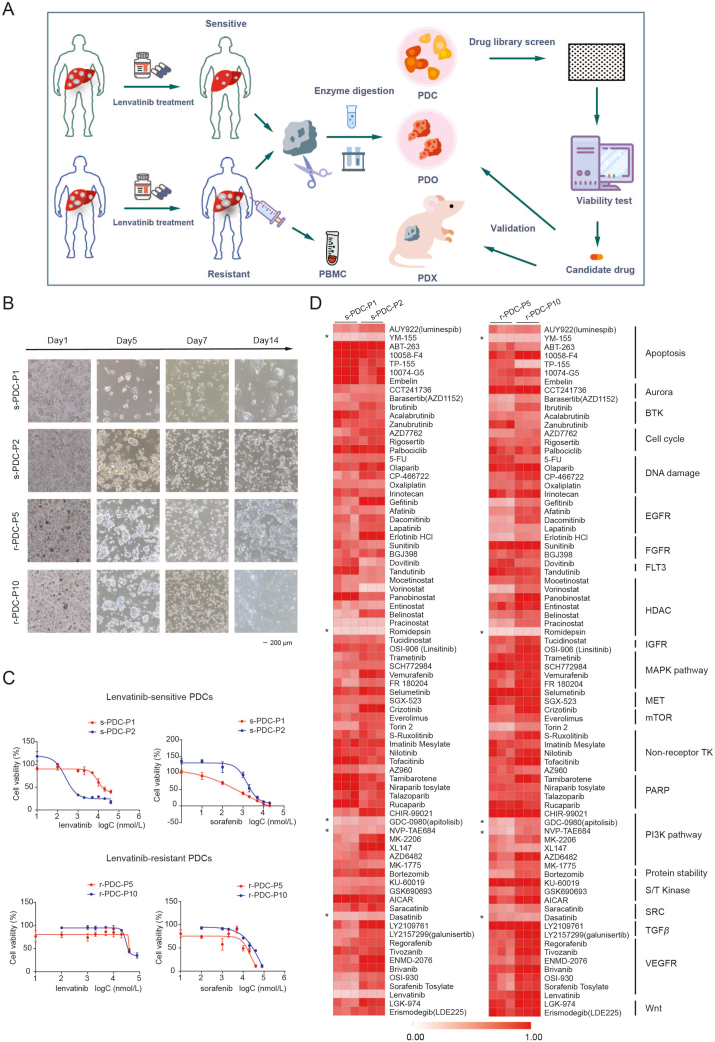
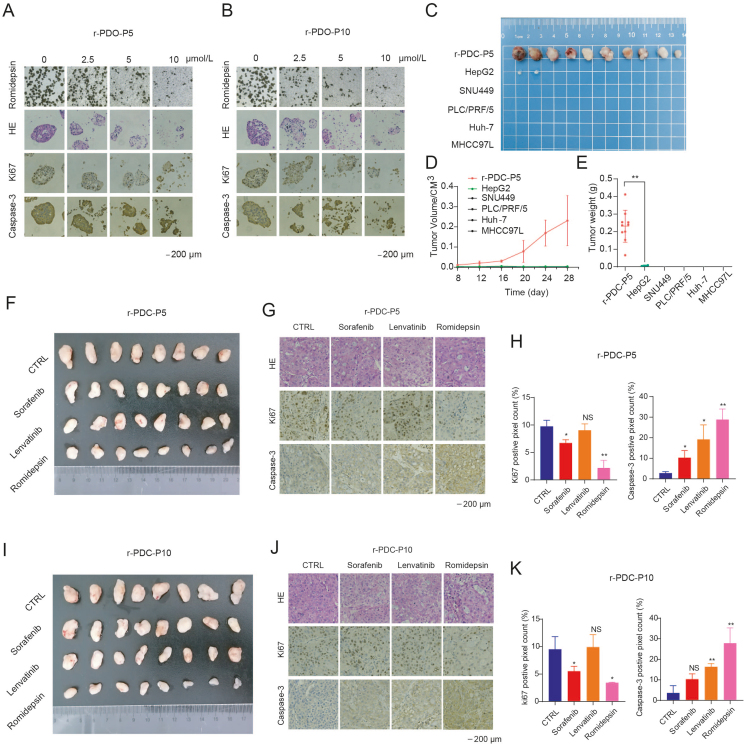
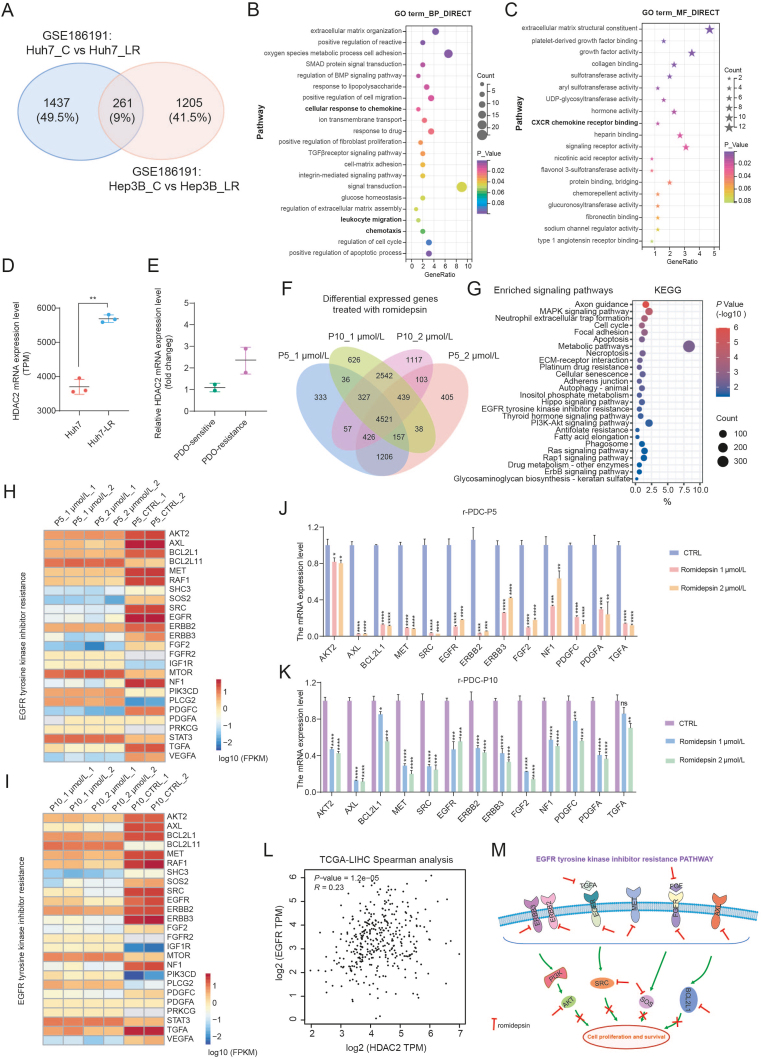
Lenvatinib, a second-generation multi-receptor tyrosine kinase inhibitor approved by the FDA for first-line treatment of advanced liver cancer, facing limitations due to drug resistance. Here, we applied a multidimensional, high-throughput screening platform comprising patient-derived resistant liver tumor cells (PDCs), organoids (PDOs), and xenografts (PDXs) to identify drug susceptibilities for conquering lenvatinib resistance in clinically relevant settings. Expansion and passaging of PDCs and PDOs from resistant patient liver tumors retained functional fidelity to lenvatinib treatment, expediting drug repurposing screens. Pharmacological screening identified romidepsin, YM155, apitolisib, NVP-TAE684 and dasatinib as potential antitumor agents in lenvatinib-resistant PDC and PDO models. Notably, romidepsin treatment enhanced antitumor response in syngeneic mouse models by triggering immunogenic tumor cell death and blocking the EGFR signaling pathway. A combination of romidepsin and immunotherapy achieved robust and synergistic antitumor effects against lenvatinib resistance in humanized immunocompetent PDX models. Collectively, our findings suggest that patient-derived liver cancer models effectively recapitulate lenvatinib resistance observed in clinical settings and expedite drug discovery for advanced liver cancer, providing a feasible multidimensional platform for personalized medicine.

Keywords: Drug discovery; Drug resistance; EGFR; High-throughput screening; Lenvatinib; Liver cancer; Patient-derived model; Romidepsin.


Figures

Image 1
Graphical abstract
Figure 1
Figure 1
Drug sensitivity in PDCs from patients with lenvatinib resistance. (A) Schematic approach of ex vivo expansion of liver cancer PDCs, PDOs and PDXs from patients with clinical lenvatinib resistance and drug sensitivity quantification by PDCs-based screening. (B) Cell growth and morphological changes of lenvatinib-sensitive PDCs (s-PDCs) and lenvatinib-resistant PDCs (r-PDCs) with indicated expansion of culture time. (C) Cell viability of patient-derived cell lines with clinical lenvatinib sensitivity or resistance in response to lenvatinib or sorafenib treatment at various doses. (D) Heatmaps representing cell viability of lenvatinib-sensitive and lenvatinib-resistant PDCs treated with a library of targeted agents. Normalization by DMSO treatment. In all relevant panels, ∗P < 0.05, two-tailed t-test. Data are presented as mean ± SD (n = 3).
Figure 2
Figure 2
Validation of representative drugs for clinical lenvatinib resistance in liver cancer PDCs and PDOs. (A, B) Long-term colony-formation assay of lenvatinib-resistant PDC-P5 cell line (A) and PDC-P10 cell line (B) treated with representative drugs, YM-155, romidepsin, GDC-0980, NVP-TAE684 and dasatinib. Lenvatinib and sorafenib were used as controls. (C) Representative images of non-adherent organoids culture. From top to bottom, H&E staining on liver tumors from resistant Patient 5 and Patient 10; morphology of PDO spheroids; H&E staining of PDOs; immunofluorescent staining of PDOs with cytokeratin (CK, red), Ki67 (green), and DAPI (blue). (D) The cellular composition of PDOs with indicated antibodies analyzed by flow cytometry analysis. (E, F) Representation of selected screen hits in lenvatinib-resistant r-PDO-P5 (E) and r-PDO-P10 (F). YM-155, romidepsin, GDC-0980, NVP-TAE684 and dasatinib were selected to treat patient-derived organoids at various concentrations. Sorafenib and lenvatinib were used as controls.
Figure 3
Figure 3
Romidepsin is an effective drug susceptibility for lenvatinib-resistant PDCs and PDOs. (A, B) Representative images of non-adherent patient-derived organoids r-PDO-P5 (A) and r-PDO-P10 (B) treated with romidepsin, respectively. H&E staining, immunohistochemistry of Ki67 and caspase-3 were measured in r-PDO-P5 and r-PDO-P10. (C–E) Growth of patient-derived cell line and other human liver cell lines in vivo (C). 5 × 105 r-PDC-P5, SNU449, MHCC97H, PLC/PRF/5 and Huh7 cells were subcutaneously injected in nude mice, respectively. Tumor growth curves (D) and tumor weights (E) of these cell line xenografts. (F–K) Tumor images of r-PDC-P5 (F) and r-PDC-P10 (I) xenografts after treatment with sorafenib, lenvatinib and romidepsin, respectively. H & E staining, immunohistochemistry of Ki67 and caspase-3 in r-PDC-P5 (G) and r-PDC-P10 (J) -derived xenografts treated with sorafenib, lenvatinib and romidepsin, respectively. Quantification of Ki67 and caspase-3 expression in IHC images from r-PDC-P5 (H) and r-PDC-P10 (K) was analyzed by Image Pro Plus (IPP) analysis, respectively. In all relevant panels, ∗P < 0.05; ∗∗P < 0.01; ns, no significant; two-tailed t-test. Data are presented as mean ± SD (n = 3).
Figure 4
Figure 4
Romidepsin blocks activation of EGFR tyrosine kinase signaling pathway in lenvatinib-resistant liver cancer. (A) Overlap of differentially expression genes (DEGs) associated with lenvatinib resistance in Huh7 and Hep3B cells (GSE186191). C, control; LR, lenvatinib resistance. (B, C) Functional annotation of altered genes associated with lenvatinib resistance from through Gene Ontology (GO) analysis of biological process (BP) (B) and molecular function (MF) (C) analysis. (D) HDAC2 RNA expression levels in lenvatinib resistant Huh7 cells. (E) HDAC2 RNA expression levels in lenvatinib-sensitive PDOs and lenvatinib-resistant PDOs by qRT-PCR assay. (F) Overlap of differentially expressed genes (DEGs) in r-PDC-P5 and r-PDC-P10 cells treated with romidepsin at various doses. (G) KEGG pathway enrichment analysis of DEGs treated with romidepsin. (H, I) Romidepsin treatment impaired the EGFR tyrosine kinase inhibitor resistance pathway in lenvatinib-resistant PDCs. Heatmap showed mRNA expression level changes in genes associated with multiple tyrosine kinase pathways after romidepsin treatment in r-PDC-P5 (H) and r-PDC-P10 (I) cells. (J, K) Validation of gene expression levels related to the EGFR tyrosine kinase inhibitor resistance pathway in r-PDC-P5 (J) and r-PDC-P10 (K) cells with romidepsin treatment by qRT-PCR. (L) Correlation between HDAC2 and EGFR in the TCGA-LIHC database by Spearman's analysis. (M) The schematic diagram illustrates the primary molecular mechanisms involved in inhibiting the EGFR tyrosine kinase inhibitor resistance pathway following romidepsin treatment. Romidepsin exhibits a multi-target inhibitory effect that reverses lenvatinib-resistant signaling pathways. This includes suppressing the expression of related receptors (EGFR, ERBB2, ERBB3, FGFR, MET, and AXL), growth factors (TGFA and FGF), and downstream effectors (AKT, SRC, SOS, and BCL2L1). EGFR, epidermal growth factor receptor; ERBB2/3, Erb-B2 receptor tyrosine kinase 2/3; FGFR, fibroblast growth factor receptor; MET, proto-oncogene, receptor tyrosine kinase; AXL, AXL receptor tyrosine kinase; TGFA, transforming growth factor alpha; FGF, fibroblast growth factor; AKT, AKT serine/threonine kinase; SRC, the SRC proto-oncogene, non-receptor tyrosine kinase; SOS, SOS ras/rac guanine nucleotide exchange factor; BCL2L1, BCL2 like 1, an apoptosis regulator. In all relevant panels, ∗P < 0.05; ∗∗P < 0.01; ns, no significant; two-tailed t-test. Data are presented as mean ± SD (n = 3).
Figure 5
Figure 5
Romidepsin triggers immunogenic cell death in liver cancer resistant PDCs in vitro. (A) Romidepsin induced apoptosis in lenvatinib-resistant liver cancer r-PDC-P5 and r-PDC-P10 cells. Quantification of apoptotic cells was analyzed by IPP. (B) Romidepsin induced calreticulin (CRT) expression in lenvatinib-resistant liver cancer r-PDC-P5 and r-PDC-P10 cells by flow cytometry analysis. (C) Romidepsin induced ATP production in lenvatinib-resistant liver cancer r-PDC-P5 and r-PDC-P10 cells. (D) Romidepsin induced HMGB1 protein level in lenvatinib-resistant liver cancer r-PDC-P5 and r-PDC-P10 cells by ELISA assays. (E) Romidepsin-treated PDCs stimulated dendritic cells to release cytokines in vitro. Positive control doxorubicin (Dox) or negative control C2 ceramide (Crm) were used, respectively. (F) Romidepsin stimulated dendritic cell-mediated phagocytosis in lenvatinib-resistant liver cancer r-PDC-P5 and r-PDC-P10 cells. CSFE (green) signal labeled PDC cells; CD11B (red) signal labeled DCs. In all relevant panels, ∗P < 0.05; ∗∗P < 0.01; ∗∗∗P < 0.001; ∗∗∗∗P < 0.0001; ns, no significant; two-tailed t-test. Data are presented as mean ± SD (n = 3).
Figure 6
Figure 6
Response of romidepsin-therapy in lenvatinib-resistant PDOs and humanized immune system mouse model. (A) Expression of HDAC1 and HDAC2 in 8 HCC patients with lenvatinib-resistance. The protein levels were measured in cultured-PDOs by Western blot. (B) Quantification of HDAC1 and HDAC2 expression in r-PDOs by Image J analysis. (C) Representation of selected images in lenvatinib-resistant PDOs after treatment with various concentrations of lenvatinib and romidepsin. (D) The fluorescence intensity of r-PDO-1, r-PDO-3, r-PDO-5 and r-PDO-7 were detected after different concentrations of lenvatinib and romidepsin treatment using CellTiter-Glo® 3D Reagent. (E) Schematic diagram of humanized immune system mouse model. Autogenous patient-derived peripheral blood mononuclear cells (PBMCs) and lenvatinib-resistant PDCs (ratio = 2:1) were mixed and xenografted in NSG mice. (F) Tumor images of r-PDC xenografts in humanized immune system mouse models. The r-PDC-derived PDXs were treated with sorafenib, lenvatinib and romidepsin, respectively. (G) Growth curves of r-PDC-derived PDXs in humanized immune system mouse model. (H) Tumor weight of r-PDC-derived PDXs in humanized immune system mouse model. (I) H & E staining, immunohistochemistry of Ki67, caspase-3 and CD8 in r-PDC-derived PDXs treated with sorafenib, lenvatinib and romidepsin, respectively. (J) Quantification of Ki67, caspase-3 and CD8 expression in IHC images by Image Pro Plus (IPP) analysis. In all relevant panels, ∗P < 0.05; ∗∗P < 0.01; ∗∗∗P < 0.001; ∗∗∗∗P < 0.0001; two-tailed t-test. Data are presented as mean ± SD (n = 3).
Figure 7
Figure 7
Clinical significance of HDAC1 and HDAC2 in liver cancer. (A) Expression levels of HDAC1 and HDAC2 in human liver tumors and normal liver tissues in TCGA and GTEx databases. (B) Clinical significance of HDAC1 and HDAC2 by evaluating low expression and high expression in liver cancer from TCGA database. Significance was determined by a log-rank test. (C) The correlation of HDAC1 and HDAC2 expression with immune infiltration levels in liver cancer in TCGA database. (D) Comparison of multidimensional platform (PDC-PDO-hPDX) with traditional single patient-derived model. Relative advantages and disadvantages for drug effectiveness screening for personalized medicine were summarized with the respective features described as best (+++), suitable (++), possible (+) and unsuitable (−) according to previous reports, , , .

References

    1. Villanueva A. Hepatocellular carcinoma. N Engl J Med. 2019;380:1450–1462. - PubMed
    1. Cordero-Espinoza L., Huch M. The balancing act of the liver: tissue regeneration versus fibrosis. J Clin Invest. 2018;128:85–96. - PMC - PubMed
    1. Cancer Genome Atlas Research Network Comprehensive and integrative genomic characterization of hepatocellular carcinoma. Cell. 2017;169:1327–1341.e23. - PMC - PubMed
    1. Schulze K., Imbeaud S., Letouze E., Alexandrov L.B., Calderaro J., Rebouissou S., et al. Exome sequencing of hepatocellular carcinomas identifies new mutational signatures and potential therapeutic targets. Nat Genet. 2015;47:505–511. - PMC - PubMed
    1. Lee T.K., Guan X.Y., Ma S. Cancer stem cells in hepatocellular carcinoma—from origin to clinical implications. Nat Rev Gastroenterol Hepatol. 2022;19:26–44. - PubMed