

Visualizing DNA single- and double-strand breaks in the Flash comet assay by DNA polymerase-assisted end-labelling
- PMID: 38261985
- PMCID: PMC10899772
- DOI: 10.1093/nar/gkae009
Visualizing DNA single- and double-strand breaks in the Flash comet assay by DNA polymerase-assisted end-labelling
Abstract
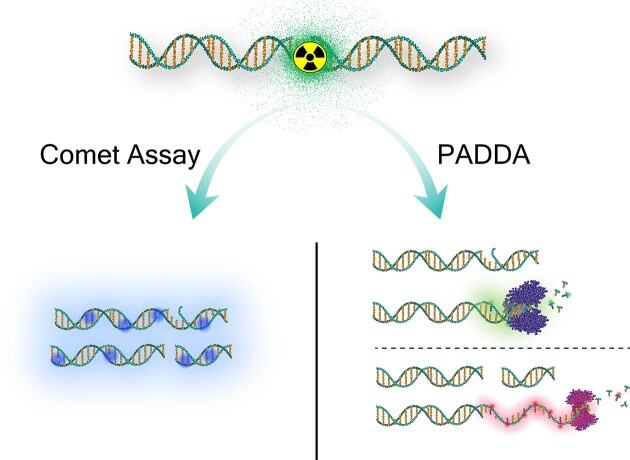
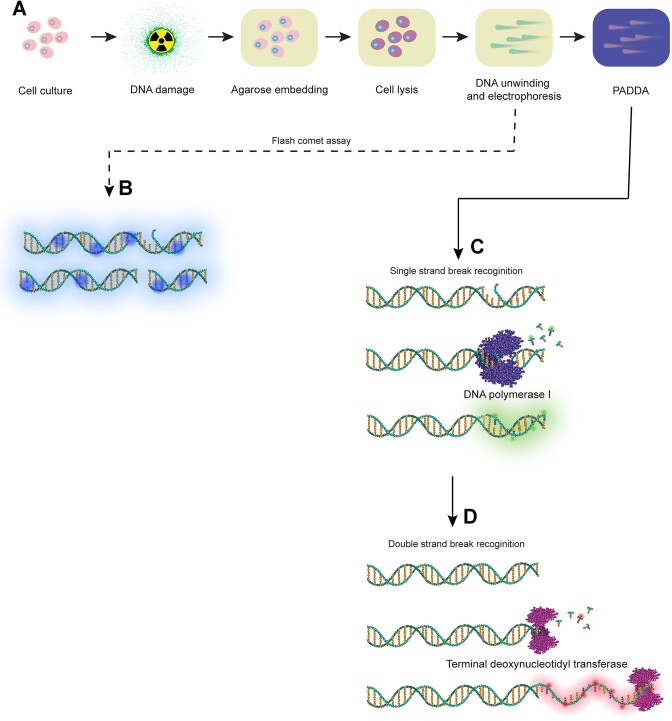
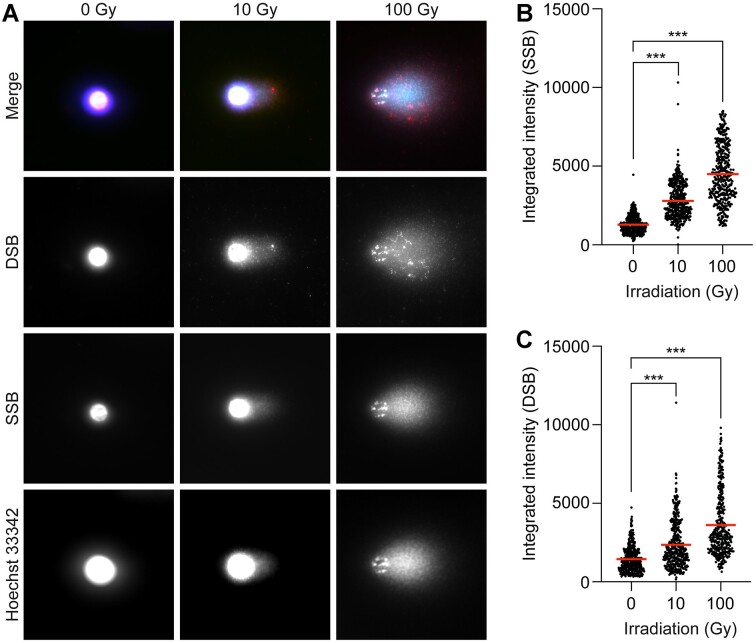
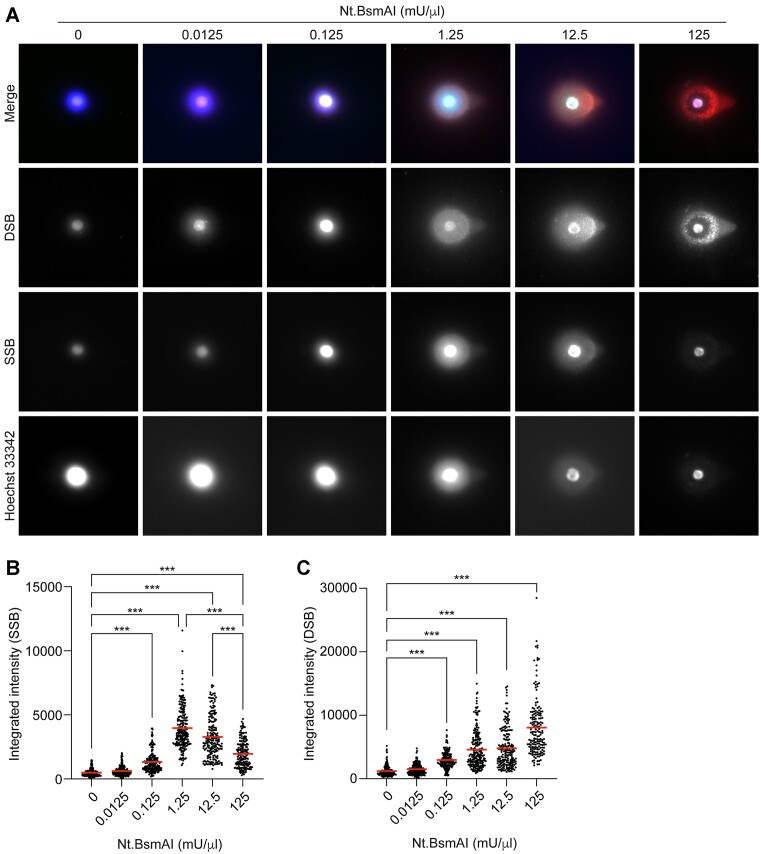
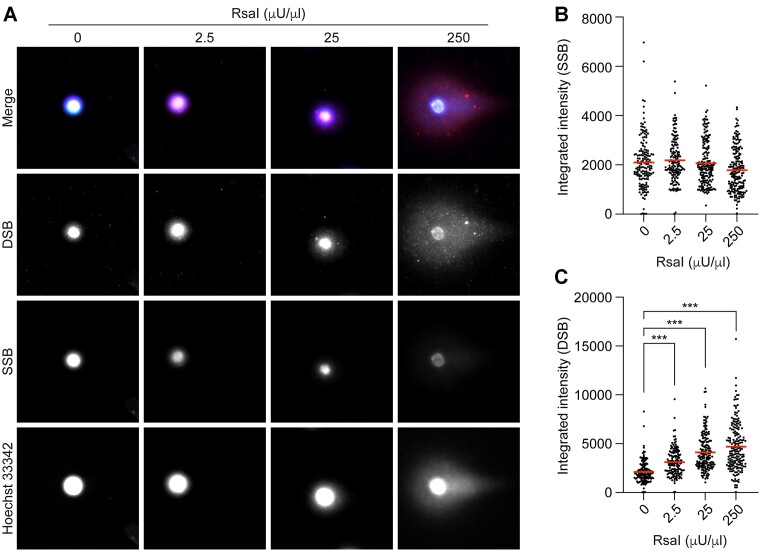
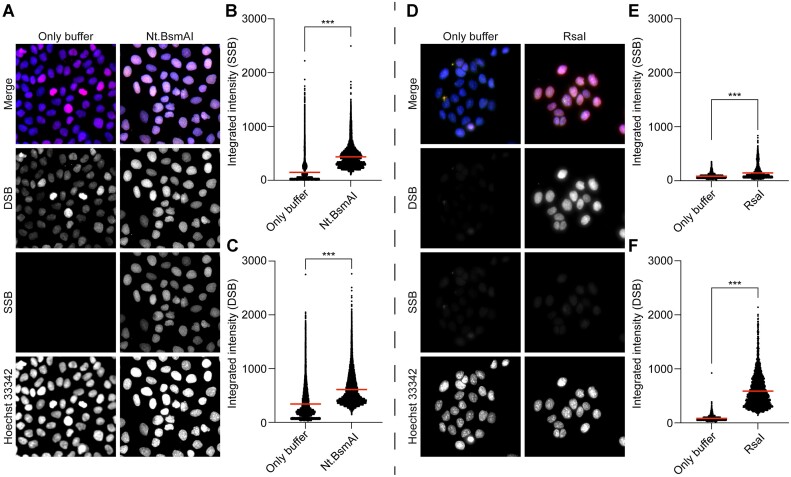
In the comet assay, tails are formed after single-cell gel electrophoresis if the cells have been exposed to genotoxic agents. These tails include a mixture of both DNA single-strand breaks (SSBs) and double-strand breaks (DSBs). However, these two types of strand breaks cannot be distinguished using comet assay protocols with conventional DNA stains. Since DSBs are more problematic for the cells, it would be useful if the SSBs and DSBs could be differentially identified in the same comet. In order to be able to distinguish between SSBs and DSBs, we designed a protocol for polymerase-assisted DNA damage analysis (PADDA) to be used in combination with the Flash comet protocol, or on fixed cells. By using DNA polymerase I to label SSBs and terminal deoxynucleotidyl transferase to label DSBs with fluorophore-labelled nucleotides. Herein, TK6-cells or HaCat cells were exposed to either hydrogen peroxide (H2O2), ionising radiation (X-rays) or DNA cutting enzymes, and then subjected to a comet protocol followed by PADDA. PADDA offers a wider detection range, unveiling previously undetected DNA strand breaks.
© The Author(s) 2024. Published by Oxford University Press on behalf of Nucleic Acids Research.
Figures
Similar articles
-
Two-Tailed Comet Assay (2T-Comet): Simultaneous Detection of DNA Single and Double Strand Breaks.Methods Mol Biol. 2017;1560:285-293. doi: 10.1007/978-1-4939-6788-9_22. Methods Mol Biol. 2017. PMID: 28155163
-
Activation of ataxia telangiectasia mutated by DNA strand break-inducing agents correlates closely with the number of DNA double strand breaks.J Biol Chem. 2005 Feb 11;280(6):4649-55. doi: 10.1074/jbc.M411588200. Epub 2004 Nov 15. J Biol Chem. 2005. PMID: 15546858
-
Hydrogen peroxide induces DNA single- and double-strand breaks in thyroid cells and is therefore a potential mutagen for this organ.Endocr Relat Cancer. 2009 Sep;16(3):845-56. doi: 10.1677/ERC-09-0020. Epub 2009 Jun 9. Endocr Relat Cancer. 2009. PMID: 19509065
-
Interpreting sperm DNA damage in a diverse range of mammalian sperm by means of the two-tailed comet assay.Front Genet. 2014 Nov 27;5:404. doi: 10.3389/fgene.2014.00404. eCollection 2014. Front Genet. 2014. PMID: 25505901 Free PMC article. Review.
-
The Impact of Single- and Double-Strand DNA Breaks in Human Spermatozoa on Assisted Reproduction.Int J Mol Sci. 2020 May 29;21(11):3882. doi: 10.3390/ijms21113882. Int J Mol Sci. 2020. PMID: 32485940 Free PMC article. Review.
Cited by
-
Protective role of extracellular vesicles against oxidative DNA damage.Biol Res. 2025 Mar 13;58(1):14. doi: 10.1186/s40659-025-00595-5. Biol Res. 2025. PMID: 40075425 Free PMC article.
-
Precise mapping of single-stranded DNA breaks by sequence-templated erroneous DNA polymerase end-labelling.Nat Commun. 2025 Aug 4;16(1):7130. doi: 10.1038/s41467-025-62512-4. Nat Commun. 2025. PMID: 40759655 Free PMC article.
-
A Massively Parallel In Vivo Assay of TdT Mutants Yields Variants with Altered Nucleotide Insertion Biases.ACS Synth Biol. 2024 Oct 18;13(10):3326-3343. doi: 10.1021/acssynbio.4c00414. Epub 2024 Sep 20. ACS Synth Biol. 2024. PMID: 39302688
-
Template-independent enzymatic functionalization of DNA oligonucleotides with environment-sensitive nucleotide probes using terminal deoxynucleotidyl transferase.Nucleic Acids Res. 2025 Mar 20;53(6):gkaf108. doi: 10.1093/nar/gkaf108. Nucleic Acids Res. 2025. PMID: 40173016 Free PMC article.
-
Assessing the Efficiency of Double-Strand Break Repair Mediated by Homologous Recombination and Non-homologous End-Joining Pathways in Saccharomyces cerevisiae.Bio Protoc. 2025 Jul 5;15(13):e5378. doi: 10.21769/BioProtoc.5378. eCollection 2025 Jul 5. Bio Protoc. 2025. PMID: 40655411 Free PMC article.
References
-
- Ostling O., Johanson K.J. Microelectrophoretic study of radiation-induced DNA damages in individual mammalian cells. Biochem. Biophys. Res. Commun. 1984; 123:291–298. - PubMed
-
- Ostling O., Johanson K.J. Bleomycin, in contrast to gamma irradiation, induces extreme variation of DNA strand breakage from cell to cell. Int. J. Radiat. Biol. Relat. Stud. Phys. Chem. Med. 1987; 52:683–691. - PubMed
-
- Singh N.P., McCoy M.T., Tice R.R., Schneider E.L. A simple technique for quantitation of low levels of DNA damage in individual cells. Exp. Cell. Res. 1988; 175:184–191. - PubMed
-
- Moller P. The comet assay: ready for 30 more years. Mutagenesis. 2018; 33:1–7. - PubMed
-
- Andersson M., Agurell E., Vaghef H., Bolcsfoldi G., Hellman B. Extended-term cultures of human T-lymphocytes and the comet assay: a useful combination when testing for genotoxicity in vitro?. Mutat. Res. 2003; 540:43–55. - PubMed
MeSH terms
Substances
Grants and funding
LinkOut - more resources
Full Text Sources
