. 2024 Jan;16(1):71-90.
doi: 10.4168/aair.2024.16.1.71.

LincR-PPP2R5C Promotes Th2 Cell Differentiation Through PPP2R5C/PP2A by Forming an RNA-DNA Triplex in Allergic Asthma

Affiliations

LincR-PPP2R5C Promotes Th2 Cell Differentiation Through PPP2R5C/PP2A by Forming an RNA-DNA Triplex in Allergic Asthma

Ningfei Ji et al. Allergy Asthma Immunol Res. 2024 Jan.

Abstract

Purpose: The roles and mechanisms of long noncoding RNAs (lncRNAs) in T helper 2 (Th2) differentiation from allergic asthma are poorly understood. We aimed to explore a novel lncRNA, LincR-protein phosphatase 2 regulatory subunit B' gamma (PPP2R5C), in Th2 differentiation in a mouse model of asthma.

Methods: LincR-PPP2R5C from RNA-seq data of CD4+ T cells of asthma-like mice were validated and confirmed by quantitative reverse transcription polymerase chain reaction, northern blotting, nuclear and cytoplasmic separation, and fluorescence in situ hybridization (FISH). Lentiviruses encoding LincR-PPP2R5C or shRNA were used to overexpress or silence LincR-PPP2R5C in CD4+ T cells. The interactions between LincR-PPP2R5C and PPP2R5C were explored with western blotting, chromatin isolation by RNA purification assay, and fluorescence resonance energy transfer. An ovalbumin-induced acute asthma model in knockout (KO) mice (LincR-PPP2R5C KO, CD4 conditional LincR-PPP2R5C KO) was established to explore the roles of LincR-PPP2R5C in Th2 differentiation.

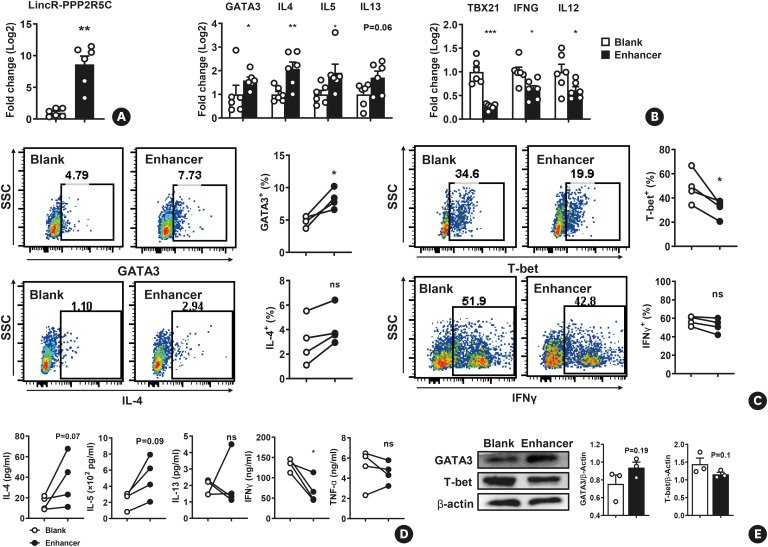
Results: LncR-PPP2R5C was significantly higher in CD4+ T cells from asthmatic mice ex vivo and Th2 cells in vitro. The lentivirus encoding LincR-PPP2R5C suppressed Th1 differentiation; in contrast, the short hairpin RNA (shRNA) lentivirus decreased LincR-PPP2R5C and Th2 differentiation. Mechanistically, LincR-PPP2R5C deficiency suppressed the phosphatase activity of the protein phosphatase 2A (PP2A) holocomplex, resulting in a decline in Th2 differentiation. The formation of an RNA-DNA triplex between LincR-PPP2R5C and the PPP2R5C promoter enhanced PPP2R5C expression and activated PP2A. LincR-PPP2R5C KO and CD4 conditional KO decreased Th2 differentiation, airway hyperresponsiveness and inflammatory responses.

Conclusions: LincR-PPP2R5C regulated PPP2R5C expression and PP2A activity by forming an RNA-DNA triplex with the PPP2R5C promoter, leading to Th2 polarization in a mouse model of acute asthma. Our data presented the first definitive evidence of lncRNAs in the regulation of Th2 cells in asthma.

Keywords: LncRNA; Th2 cells; asthma; inflammation; protein phosphatase 2.


Conflict of interest statement

There are no financial or other issues that might lead to conflict of interest.

Figures

Fig. 1
Fig. 1. A novel lncRNA is strongly induced in the CD4+ T cells of mice with acute asthma and in Th2 cells. (A) Heatmap of novel lncRNAs with significantly altered expression in the asthma vs. control groups. Blue indicates low expression, and red indicates high expression. (B) Volcano plot of the novel lncRNA profiles in CD4+ T cells in the asthma vs. control groups. Blue dots represent differentially expressed lncRNAs (P < 0.05) with a fold change ≤ 2, and red dots represent differentially expressed lncRNAs (P < 0.05) with a fold change ≥ 2. (C) The expression of selected lncRNAs (TCONS_000056450 designated LincR-PPP2R5C) in CD4+ T cells in the asthma vs. control groups was assayed using qRT-PCR in a parallel experiment, n = 10. (D) LincR-PPP2R5C was assessed in Th1 and Th2 cells in vitro using qRT-PCR, n = 4. (E) Northern blot analysis of LincR-PPP2R5C expression in mouse spleen homogenates. (F) qRT-PCR analysis showing the distribution of LincR-PPP2R5C in the nuclear and cytoplasmic fractions separated with a PARIS kit. U6 was used as a nuclear control, and 18S was used as a cytoplasmic control; n = 3. (G) RNA fluorescence in situ hybridization of LincR-PPP2R5C, U6, and 18S probe signals (red). Blue indicates the DAPI signal (nuclear), and the third panel shows a composite image. Scale bar, 5 μm.
LncRNA, long noncoding RNA; qRT-PCR, quantitative reverse transcription polymerase chain reaction; PPP2R5C, protein phosphatase 2 regulatory subunit B' gamma; Th, T helper.
Fig. 2
Fig. 2. Inhibition of LincR-PPP2R5C attenuates Th2 cell differentiation in vitro. Naive CD4+ T cells were transfected with a LincR-PPP2R5C inhibitor-carrying or scrambled lentivirus on Day 1 and cultured under Th2 conditions for 5 days. (A) The level of LincR-PPP2R5C was significantly decreased after infection with a lentivirus carrying an shRNA targeting LincR-PPP2R5C (inhibitor), n = 6. (B) qRT-PCR analysis of Th1/Th2 transcription factors and cytokines (GATA3, IL-4, IL-5, IL-13, TBX21, IFN-γ, and IL-12), n = 6. (C) Proportions of GATA3-, IL-4-, T-bet-, and IFN-γ-positive cells determined using flowcytometry. Left: representative pseudocolour plots, right: summary of independent experiments; n = 5–6. (D) Concentrations of cytokines (IL-4, IL-5, IL-13, IFN-γ, and TNF-α) in the culture supernatant measured by enzyme-linked immunosorbent assay; n = 4–5. (E) Western blotting of GATA3 and T-bet. Left: representative protein bands, right: summary of the greyscale values of 3 independent experiments; n = 3.
Th, T helper; PPP2R5C, protein phosphatase 2 regulatory subunit B' gamma; qRT-PCR, quantitative reverse transcription polymerase chain reaction; IL, interleukin; IFN, interferon; TNF, tumor necrosis factor; SSC, side scatter; ns, not significant. *P < 0.05.
Fig. 3
Fig. 3. LincR-PPP2R5C decreasesTh1 cell differentiation in vitro. Naive CD4+ T cells were transfected with a LincR-PPP2R5C enhancer-carrying or blank lentivirus on Day 1 and cultured under Th1 conditions for 5 days. (A) The level of LincR-PPP2R5C was significantly increased after infection with the lentivirus encoding LincR-PPP2R5C (enhancer). (B) qRT-PCR analysis of Th1/Th2 transcription factors and cytokines (GATA3, IL-4, IL-5, IL-13, TBX21, IFN-γ, and IL-12), n = 6. (C) Proportions of GATA3-, IL-4-, T-bet-, and IFN-γ-positive cells assayed using flow cytometry. Left: representative pseudocolour plots, right: summary of independent experiments; n = 4. (D) Concentrations of cytokines (IL-4, IL-5, IL-13, IFN-γ, and TNF-α) in the culture supernatant measured by enzyme-linked immunosorbent assay, n = 4. (E) Western blotting of GATA3 and T-bet. Left: representative protein bands, right: summary of the greyscale values of 3 independent experiments; n = 3.
PPP2R5C, protein phosphatase 2 regulatory subunit B' gamma; Th, T helper; qRT-PCR, quantitative reverse transcription polymerase chain reaction; IL, interleukin; IFN, interferon; TNF, tumor necrosis factor; SSC, side scatter; ns, not significant. *P < 0.05; **P < 0.01; ***P < 0.001.
Fig. 4
Fig. 4. KO of LincR-protein phosphatase 2 regulatory subunit B' gamma alleviates OVA-induced lung inflammation. (A) Experimental protocol. (B) Mice were treated with an ascending gradient of inhaled acetylcholine (0–100 mg/mL), and airway hyperresponsiveness was measured; n = 5. (C) The numbers of total cells and differential cell types in the bronchoalveolar lavage fluid, n = 5. (D) The level of IgE in the serum was measured by ELISA, n = 5. (E) The levels of cytokines (IL-4, IL-5, and IL-13) in lung homogenate supernatants were measured by ELISA, n = 5. (F) Lung sections were stained with H&E to analyse the infiltration of inflammatory cells. Magnification, 200×; scale bar, 50 µm; arrows indicate morphological changes. (G) Lung sections were stained with PAS to assess goblet cell hyperplasia. Magnification, 200×; scale bar, 50 µm; arrows indicate morphological changes. (H, I) H&E and PAS staining; magnification, 40×; scale bar, 200 µm. (J, K) Inflammation and mucus score. (L, M) The right lower lobe was digested into a single-cell suspension, and the percentage of IL-4-positive CD4+ cells was assessed by flowcytometry. Left: representative pseudocolor plots, right: summary of 3 independent experiments; n = 3.
KO, knockout; OVA, ovalbumin; WT, wild-type; IL, interleukin; H&E, haematoxylin-eosin; PAS, periodic acid-Schiff; SSC, side scatter; IgE, immunoglobulin E; ELISA, enzyme-linked immunosorbent assay; PB, peribronchial; PV, perivascular. *P < 0.05; **P < 0.01.
Fig. 5
Fig. 5. The cKO of LincR-protein phosphatase 2 regulatory subunit B' gamma alleviates ovalbumin-induced lung inflammation. (A) The numbers of total cells and differential cell types in the bronchoalveolar lavage fluid, n = 5. (B) Mice were treated with an ascending gradient of inhaled acetylcholine (0–100 mg/mL), and airway hyperresponsiveness was measured; n = 5. (C) The level of IgE in the serum was measured by ELISA, n = 5. (D) The levels of cytokines (IL-4, IL-5, and IL-13) in lung homogenate supernatants were measured by ELISA, n = 5. (E) Lung sections were stained with H&E to analyze the infiltration of inflammatory cells. Magnification, 200×; scale bar, 50 µm; arrows indicate morphological changes. (F) Lung sections were stained with PAS to assess goblet cell hyperplasia. Magnification, 200×; scale bar, 50 µm; arrows indicate morphological changes. (G, H) H&E and PAS staining in Result 5; magnification, 40×; scale bar, 200 µm. (I, J) Inflammation and mucus score. (K, L) The right lower lobe was digested into a single-cell suspension, and the percentage of IL-4-positive CD4+ cells was assessed by flowcytometry. K: representative pseudocolor plots, L: summary of independent experiments; n = 3.
Ctrl, control; cKO, conditional knockout; IgE, immunoglobulin E; IL, interleukin; H&E, haematoxylin-eosin; PAS, periodic acid-Schiff; PB, peribronchial; PV, perivascular; WT, wild-type; SSC, side scatter; ELISA, enzyme-linked immunosorbent assay. *P < 0.05; **P < 0.01.
Fig. 6
Fig. 6. LincR-PPP2R5C alters PPP2R5C expression by forming an RNA–DNA triplex. (A) qRT-PCR analysis of PPP2R5C expression in Th2 cells treated with a scrambled sequence or an inhibitor on Day 1 and from Day 1 to Day 5, n = 3. (B) Western blot analysis of PPP2R5C expression in Th2 cells from wild-type or knockout mice. Left: representative protein bands for Days 2, 3, and 5 of differentiation. Right: greyscale values of 3 independent experiments performed on Day 5, n = 3. (C) TFO structure prediction of LincR-PPP2R5C using LongTarget. (D, E) ChIRP analysis of LincR-PPP2R5C-associated chromatin in EL4 cells. Retrieved chromatin was quantified by PCR. The percentage recovery of the input for the ChIRP assay was calculated in terms of a 10% nonprecipitated DNA sample for each experiment. The blue arrow indicates the TSS, and the purple arrows indicate the locations of TTSs, corresponding to the prediction of TFOs; n = 3. (F) FRET analysis of TFO1/TTS1 and an ssRNA/TTS negative control.
PPP2R5C, protein phosphatase 2 regulatory subunit B' gamma; WT, wild-type; KO, knockout; TSS, transcriptional start site; TTS, triplex target site; ChIRP, chromatin isolation by RNA purification assay; CPS, counts per second; ns, not significant; TFO, triplex-forming oligonucleotide; qRT-PCR, quantitative reverse transcription polymerase chain reaction; Th, T helper; FRET, fluorescence resonance energy transfer. *P < 0.05; **P < 0.01.
Fig. 7
Fig. 7. LincR-PPP2R5C promotes Th2 cell differentiation via PPP2R5C/PP2A. (A) Enzymatic activity of PP2A in Th2 cells of wild-type or LincR-PPP2R5C KO mice on Day 3 (left) and Day 5 (right), n = 3–4. (B) Enzymatic activity of PP2A in Th2 cells of wild-type mice after administration of OA (2 nM, also used in other assays) and DT-061 (10 µM, also used in other assays). EtOH was the solvent for OA, and DMSO was the solvent for DT-061; n = 3. (C) Proportions of GATA3- and IL-4-positive Th2 cells after administration of OA and DT-061 determined using flow cytometry. Left: representative pseudocolor plots, right: summary of 4 independent experiments; n = 4. (D) The levels of cytokines (IL-4, IL-5, and IL-13) in Th2 cell culture supernatants after administration of OA and DT-061 measured by enzyme-linked immunosorbent assay, n = 4–5. (E) Western blotting of GATA3, M-PP2Ac, and p-PP2Ac in Th2 cells after administration of OA. Left: representative protein bands, right: summary of the greyscale values of 3 independent experiments; n = 3. (F) Western blotting of GATA3, M-PP2Ac, and p-PP2Ac in Th2 cells after administration of DT-061. Left: representative protein bands, right: summary of the greyscale values of 3 independent experiments; n = 3.
PP2A, protein phosphatase 2A; WT, wild-type; KO, knockout; Blk, Blank; EtOH, ethanol; OA, okadaic acid; DMSO, dimethyl sulfoxide; SSC-A, side scatter-area; IL, interleukin; ns, not significant; PPP2R5C, protein phosphatase 2 regulatory subunit B' gamma; Th, T helper. *P < 0.05; **P < 0.01.

Similar articles

Cited by

References

    1. Edwards MR, Bartlett NW, Hussell T, Openshaw P, Johnston SL. The microbiology of asthma. Nat Rev Microbiol. 2012;10:459–471. - PMC - PubMed
    1. GBD 2019 Diseases and Injuries Collaborators. Global burden of 369 diseases and injuries in 204 countries and territories, 1990-2019: a systematic analysis for the Global Burden of Disease Study 2019. Lancet. 2020;396:1204–1222. - PMC - PubMed
    1. Fahy JV. Type 2 inflammation in asthma--present in most, absent in many. Nat Rev Immunol. 2015;15:57–65. - PMC - PubMed
    1. Kung JT, Colognori D, Lee JT. Long noncoding RNAs: past, present, and future. Genetics. 2013;193:651–669. - PMC - PubMed
    1. Zhu X, Wei Y, Dong J. Long noncoding RNAs in the regulation of asthma: current research and clinical implications. Front Pharmacol. 2020;11:532849. - PMC - PubMed