

The causes of species richness patterns among clades
- PMID: 38262607
- PMCID: PMC10805600
- DOI: 10.1098/rspb.2023.2436
The causes of species richness patterns among clades
Abstract
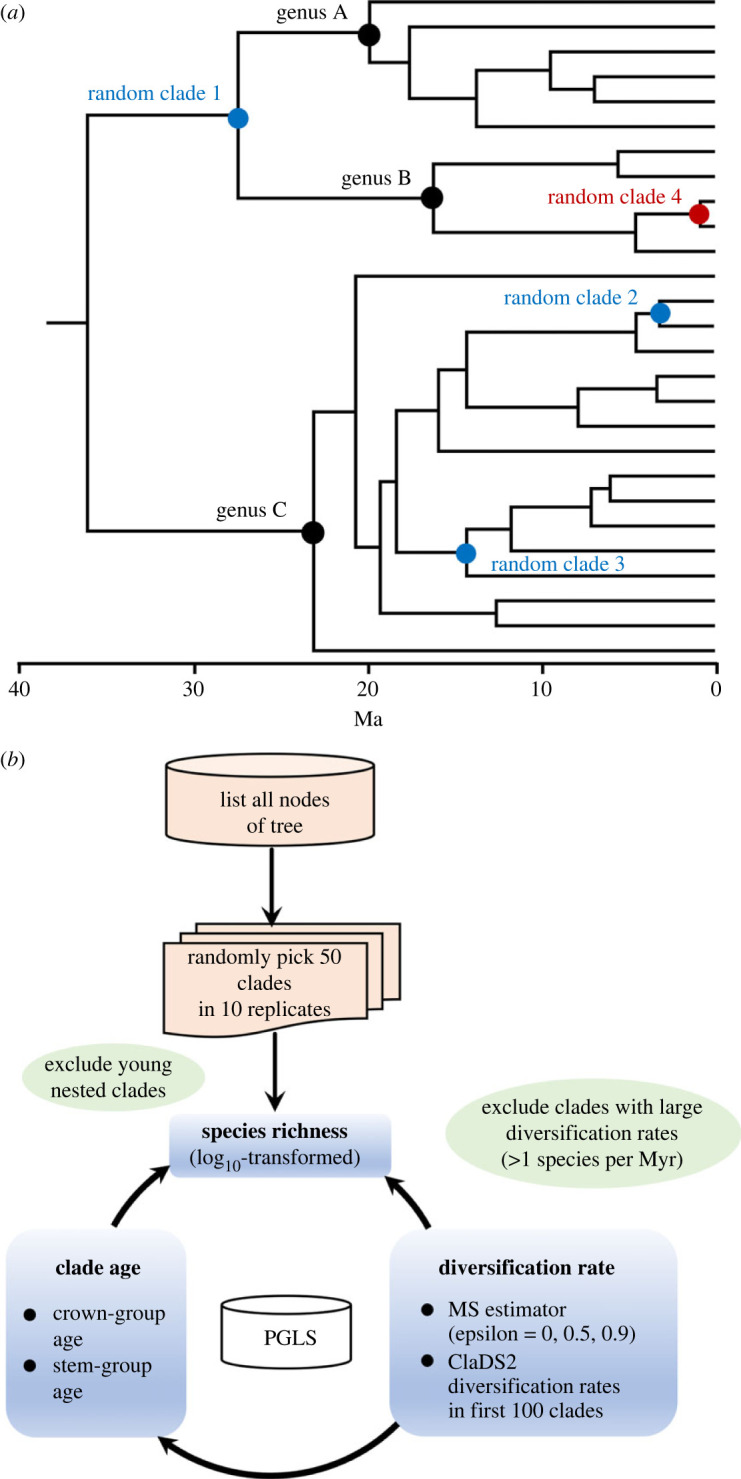
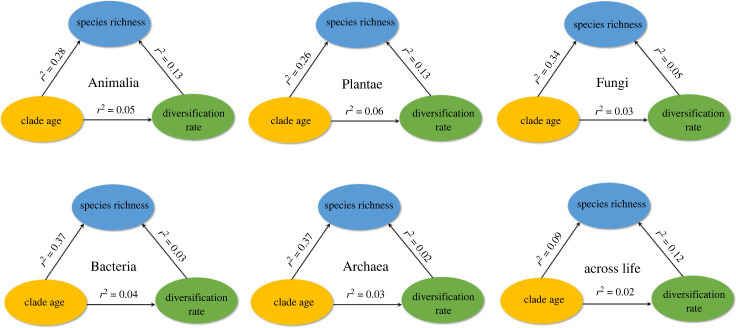
Two major types of species richness patterns are spatial (e.g. the latitudinal diversity gradient) and clade-based (e.g. the dominance of angiosperms among plants). Studies have debated whether clade-based richness patterns are explained primarily by larger clades having faster rates of species accumulation (speciation minus extinction over time; diversification-rate hypothesis) or by simply being older (clade-age hypothesis). However, these studies typically compared named clades of the same taxonomic rank, such as phyla and families. This study design is potentially biased against the clade-age hypothesis, since clades of the same rank may be more similar in age than randomly selected clades. Here, we analyse the causes of clade-based richness patterns across the tree of life using a large-scale, time-calibrated, species-level phylogeny and random sampling of clades. We find that within major groups of organisms (animals, plants, fungi, bacteria, archaeans), richness patterns are most strongly related to clade age. Nevertheless, weaker relationships with diversification rates are present in animals and plants. These overall results contrast with similar large-scale analyses across life based on named clades, which showed little effect of clade age on richness. More broadly, these results help support the overall importance of time for explaining diverse types of species richness patterns.
Keywords: clade age; diversification; macroevolution; phylogeny; species richness.
Conflict of interest statement
We declare we have no competing interests.
Figures
Similar articles
-
Testing the Relationships between Diversification, Species Richness, and Trait Evolution.Syst Biol. 2016 Nov;65(6):975-988. doi: 10.1093/sysbio/syw029. Epub 2016 Apr 4. Syst Biol. 2016. PMID: 27048703
-
Diversification rates and species richness across the Tree of Life.Proc Biol Sci. 2016 Sep 14;283(1838):20161334. doi: 10.1098/rspb.2016.1334. Proc Biol Sci. 2016. PMID: 27605507 Free PMC article.
-
Why Are There So Many Flowering Plants? A Multiscale Analysis of Plant Diversification.Am Nat. 2020 Jun;195(6):948-963. doi: 10.1086/708273. Epub 2020 Apr 3. Am Nat. 2020. PMID: 32469653
-
Time Explains Regional Richness Patterns within Clades More Often than Diversification Rates or Area.Am Nat. 2019 Apr;193(4):514-529. doi: 10.1086/702253. Epub 2019 Feb 20. Am Nat. 2019. PMID: 30912972
-
The causes of species richness patterns across space, time, and clades and the role of "ecological limits".Q Rev Biol. 2011 Jun;86(2):75-96. doi: 10.1086/659883. Q Rev Biol. 2011. PMID: 21800635 Review.
References
-
- Bánki O, et al. 2023. Catalogue of Life checklist (version 2023-02-07). (10.48580/dfrq) - DOI
MeSH terms
LinkOut - more resources
Full Text Sources
