. 2024 May 10;73(6):941-954.
doi: 10.1136/gutjnl-2023-329839.

A mucus production programme promotes classical pancreatic ductal adenocarcinoma

Affiliations

A mucus production programme promotes classical pancreatic ductal adenocarcinoma

Claudia Tonelli et al. Gut. .

Abstract

Objective: The optimal therapeutic response in cancer patients is highly dependent upon the differentiation state of their tumours. Pancreatic ductal adenocarcinoma (PDA) is a lethal cancer that harbours distinct phenotypic subtypes with preferential sensitivities to standard therapies. This study aimed to investigate intratumour heterogeneity and plasticity of cancer cell states in PDA in order to reveal cell state-specific regulators.

Design: We analysed single-cell expression profiling of mouse PDAs, revealing intratumour heterogeneity and cell plasticity and identified pathways activated in the different cell states. We performed comparative analysis of murine and human expression states and confirmed their phenotypic diversity in specimens by immunolabeling. We assessed the function of phenotypic regulators using mouse models of PDA, organoids, cell lines and orthotopically grafted tumour models.

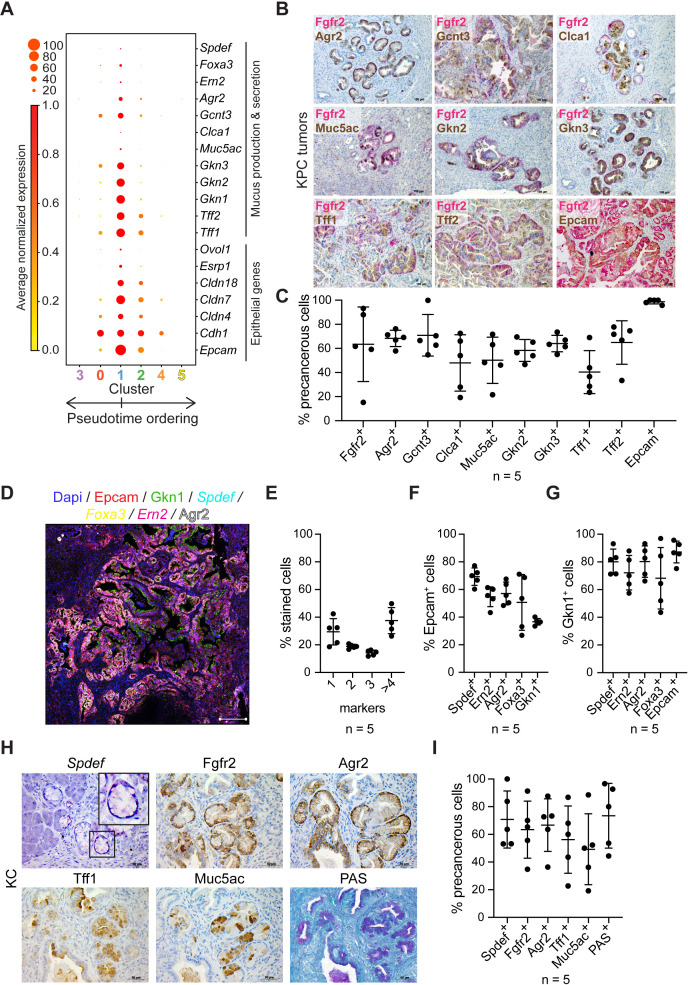
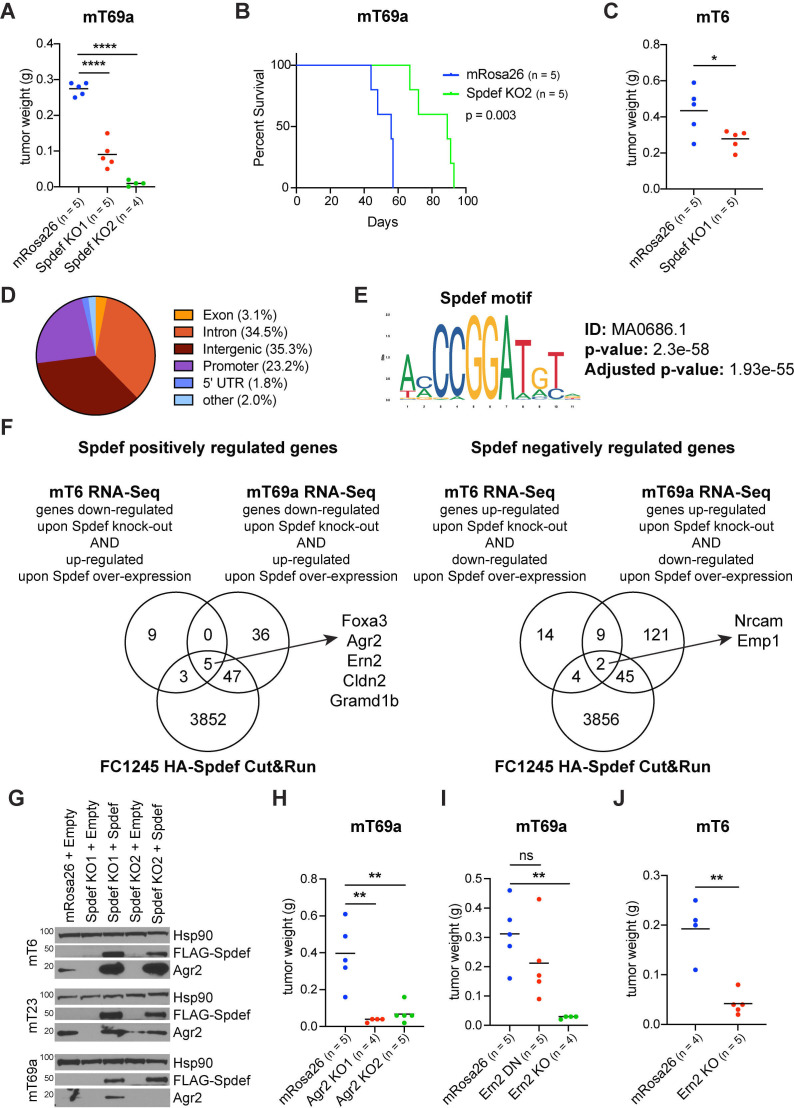
Results: Our expression analysis and immunolabeling analysis show that a mucus production programme regulated by the transcription factor SPDEF is highly active in precancerous lesions and the classical subtype of PDA - the most common differentiation state. SPDEF maintains the classical differentiation and supports PDA transformation in vivo. The SPDEF tumour-promoting function is mediated by its target genes AGR2 and ERN2/IRE1β that regulate mucus production, and inactivation of the SPDEF programme impairs tumour growth and facilitates subtype interconversion from classical towards basal-like differentiation.

Conclusions: Our findings expand our understanding of the transcriptional programmes active in precancerous lesions and PDAs of classical differentiation, determine the regulators of mucus production as specific vulnerabilities in these cell states and reveal phenotype switching as a response mechanism to inactivation of differentiation states determinants.

Keywords: MUCUS; PANCREATIC CANCER; PRE-MALIGNANCY - GI TRACT.


Conflict of interest statement

Competing interests: CRV has received consulting fees from Flare Therapeutics, Roivant Sciences, and C4 Therapeutics, has served on the scientific advisory board of KSQ Therapeutics, Syros Pharmaceuticals, and Treeline Biosciences, has received research funding from Boehringer-Ingelheim and Treeline Biosciences, and has received a stock option from Treeline Biosciences outside of the submitted work. DAT is a member of the Scientific Advisory Board and receives stock options from Leap Therapeutics, Surface Oncology, and Cygnal Therapeutics and Mestag Therapeutics outside the submitted work. DAT is scientific cofounder of Mestag Therapeutics. DAT has received research grant support from Fibrogen, Mestag and ONO Therapeutics. DAT receives grant funding from the Lustgarten Foundation, the NIH and the Thompson Foundation.

Figures

Figure 1
Figure 1
PDA samples reveal extensive intratumour heterogeneity. (A) Percentage of cells from eight independent KPC tumours present in each cluster. (B) Pseudotime ordering of KPC cells, colouring by cluster. (C) Dot plot of the expression of the indicated genes in the different clusters. The size of each dot represents the percentage of cells within a given cluster that expresses the gene; the intensity of colour indicates the average normalised expression. The order of the clusters matches the order of the clusters in the pseudotime trajectory. (D) Representative IF for YFP, p53 or p19Arf, and Fgfr2, Epcam, Zeb1, Vimentin, Ki67, P-H3 in KPCY tumour sections. Scale bars, 25 µm. Arrow heads mark cells coexpressing p53 and Zeb1/Ki67 or p19Arf and Vimentin/P-H3.
Figure 2
Figure 2
Pancreatic precancerous lesions activate a secretory cell programme. (A) Dot plot of the expression of the indicated genes in the different clusters. The size of each dot represents the percentage of cells within a given cluster that expresses the gene; the intensity of colour indicates the average normalised expression. The order of the clusters matches the order of the clusters in the pseudotime trajectory. (B) Representative IHC for Fgfr2 and Agr2, Gcnt3, Clca1, Muc5ac, Gkn2, Gkn3, Tff1, Tff2, Epcam in KPC tumour sections. (C) Average percentage±SD of precancerous cells expressing Fgfr2, Agr2, Gcnt3, Clca1, Muc5ac, Gkn2, Gkn3, Tff1, Tff2, Epcam in KPC tumour sections (n=5). (D) Representative RNA ISH of Spdef, Foxa3 and Ern2 combined with IF for Epcam, Gkn1 and Agr2 in a KPC tumour section. Scale bar, 200 µm. (E) Average percentage±SD of cells stained for one or more markers by RNA ISH combined with IF in KPC tumour sections (n=5). (F, G) Average percentage±SD of Epcam-positive (F) and Gkn1-positive (G) cells presenting the indicated markers in KPC tumour sections (n=5). (H) Representative RNA ISH of Spdef, IHC for Fgfr2, Agr2, Tff1, Muc5ac and PAS staining in pancreatic tissue from a 3 months-old KC mouse. Scale bars, 50 µm. (I) Average percentage±SD of precancerous cells expressing the indicated markers in pancreata from KC mice (n=5).
Figure 3
Figure 3
Spdef and its target genes Ern2/Ire1β and Agr2 support murine pancreatic tumour growth. (A, C, H, I, J) Quantification of weight of tumours derived from mT69a (A, H, I) and mT6 (C, J) orthotopically grafted organoid (OGO) models of Spdef KO (A, C), Agr2 KO (H), Ern2 KO or partial inactivation DN (I, J) and mRosa26 clones in nu/nu mice. Results show mean of biological replicates. Unpaired Student’s t-test. (B) Kaplan-Meier survival curve of percent survival for mT69a OGO models of Spdef KO and mRosa26 clones in nu/nu mice. Log-rank (Mantel-Cox) test. (D) Pie chart of percent distribution of high confidence HA-Spdef peaks (≥2 replicates) across genomic features. (E) Spdef motif enrichment as determined by MEME motif analysis on the high confidence HA-Spdef-binding sites. (F) Venn diagram of the differentially expressed genes identified by RNA-seq following Spdef KO and restoration by cDNA expression in mT69a and mT6 organoids (upregulated genes: q-value<0.05, log2 of fold change>0; downregulated genes: q-value<0.05, log2 of fold change<0). Genes assigned to HA-Spdef peaks in KPC FC1245 cells are indicated. (G) Agr2 and FLAG-Spdef expression analysis by Western blotting in mT6, mT23 and mT69a organoids following Spdef KO and restoration by cDNA expression. Loading control: Hsp90.
Figure 4
Figure 4
The SPDEF-regulated mucus production programme is expressed by human precancerous lesions and classical PDAs (A) Heatmap of signature scores (rows) in single KPC tumour cells and human PDA malignant cells (columns). (B) Correlation between SPDEF programme score (x-axis) and signature scores (y-axis) in single human PDA malignant cells. Spearman’s rank correlation coefficient and p value. (C) Representative RNA ISH of SPDEF and ERN2 and IHC for MUC5AC, AGR2, LGALS4, p63, S100A2 in serial sections of human PDAs of classical, IC and basal-like differentiation. (D–F) Representative RNA ISH of SPDEF and ERN2 combined with IF for CK19, AGR2, MUC5AC and LGALS4 in a human PDA TMA (n=73) (D) a human IPMN TMA (n=52) (E) and human PanINs (n=3) (F) Scale bar, 200 µm. The percentage of CK19-positive cells presenting the indicated markers is reported.
Figure 5
Figure 5
Classical PDAs are dependent on SPDEF for tumour growth. (A) RT-qPCR analysis of SPDEF expression in control tumours derived from transplant models of hF27, CFPAC1, HPAF-II, BxPC3, YAPC and AsPC1. Results show mean of biological replicates. (B) Representative IHC for FOXA1, GATA6, HNF4A, p63 and ZEB1 in control tumours derived from transplant models of hF27, CFPAC1, HPAF-II, BxPC3, YAPC and AsPC1. (C) Quantification of weight of tumours derived from hF27 orthotopically grafted models of SPDEF KO and hRosa26 clones in NSG mice. Results show mean of biological replicates. Unpaired Student’s t-test. (D, H, I) Quantification of weight of tumours derived from CFPAC1 (D), BxPC3 (H) and YAPC (I) orthotopically grafted models of hRosa26 and SPDEF KO clones with (SPDEF) or without (Empty) SPDEF cDNA expression following the knock-out in NSG mice. Results show mean of biological replicates. Unpaired Student’s t-test. (E, J) Kaplan-Meier survival curve of per cent survival for HPAF-II (E) and AsPC1 (J) orthotopically grafted models of hRosa26 and SPDEF KO clones with (SPDEF) or without (Empty) SPDEF cDNA expression following the knock-out in NSG mice. Log-rank (Mantel-Cox) test. (F, G) Quantification of weight of tumours derived from CFPAC1 (F) and HPAF-II (G) orthotopically grafted models of hRosa26 and SPDEF KO clones with (SPDEF) or without (Empty) SPDEF cDNA expression prior to the knock-out in NSG mice. Results show mean of biological replicates. Unpaired Student’s t-test. (K, L) GSEA signature ‘HALLMARK_E2F_TARGETS’ is repressed in hF27 and CFPAC1 SPDEF KO1 compared to hRosa26 tumours. (M) GSEA signature ‘HALLMARK_MYC_TARGETS_V1’ is repressed in HPAF-II SPDEF KO1 compared with hRosa26 tumours. NES, normalised enrichment score; FDR, false discovery rate.
Figure 6
Figure 6
The SPDEF target genes ERN2/IRE1β and AGR2 support classical PDA growth and prevent aberrant mucus production (A, B) Left, representative AB and nuclear red staining of BxPC3 and YAPC orthotopically grafted models of hRosa26 and SPDEF KO clones with (SPDEF) or without (Empty) SPDEF cDNA expression. Scale bars, 100 µm. Right, average percentage of AB positive area. Unpaired Student’s t-test. (C) Left, representative IHC for TFF1 in AsPC1 orthotopically grafted models of hRosa26 and SPDEF KO clones with (SPDEF) or without (Empty) SPDEF cDNA expression. Scale bars, 100 µm. Right, average percentage of TFF1 positive area. Unpaired Student’s t-test. (D) Heatmap of z-score values of SPDEF, SPDEF cDNA, ERN2, AGR2 and MUC5AC expression as determined by RT-qPCR in tumours derived from BxPC3, YAPC and AsPC1 orthotopically grafted models of hRosa26 and SPDEF KO clones with (SPDEF) or without (Empty) SPDEF cDNA expression. (E) Heatmap of z-score values of SPDEF, ERN2, AGR2 and MUC5AC expression as determined by RNA-seq in tumours derived from hF27, CFPAC1 and HPAF-II orthotopically grafted models of SPDEF KO1 and hRosa26 clones. (F, G.) Quantification of weight of tumours derived from CFPAC1 (F) and HPAF-II (G) orthotopically grafted models of ERN2 KO, AGR2 partial inactivation DN and hRosa26 clones in NSG mice. Results show mean of biological replicates. Unpaired Student’s t-test. (H) Left, representative AB and nuclear red staining of CFPAC1 and HPAF-II orthotopically grafted models of ERN2 KO, AGR2 partial inactivation DN and hRosa26 clones. Scale bars, 100 µm. Right, average percentage of AB positive area. Unpaired Student’s t-test. (I) Representative IF for CK19 and MUC5AC in tumour sections derived from CFPAC1 and HPAF-II orthotopically grafted models of ERN2 KO, AGR2 partial inactivation DN and hRosa26 clones. Scale bars, 25 µm.
Figure 7
Figure 7
Inactivation of the SPDEF-regulated mucus production programme was associated with features of classical-to-basal-like phenotype switch. (A, B) Heatmap of z-score values of the expression for the indicated genes as determined by RNA-seq in tumours derived from CFPAC1 (A) and HPAF-II (B) orthotopically grafted models of SPDEF KO1 and hRosa26 clones. (C) Top, representative IF for GFP and p63 in CFPAC1 hRosa26 and SPDEF KO tumours with SPDEF cDNA expression after or prior the knock-out as indicated. Scale bars, 25 µm. Bottom, average percentage of GFP- and p63-expressing cells. Two images per tumour were quantified. Unpaired Student’s t-test. (D) Top, representative IF for GFP and SLUG in HPAF-II hRosa26 and SPDEF KO tumours with SPDEF cDNA expression after or prior the knock-out as indicated. Scale bars, 25 µm. Bottom, average percentage of GFP- and SLUG-expressing cells. Two images per tumour were quantified. Unpaired Student’s t-test. (E.) Left, representative IF for GFP and p63 or SLUG in CFPAC1 and HPAF-II hRosa26, ERN2 KO and AGR2 partial inactivation DN tumour sections as indicated. Scale bars, 25 µm. Right, average percentage of GFP- and p63- or SLUG-expressing cells. Two images per tumour were quantified. Unpaired Student’s t-test.

References

    1. Siegel RL, Miller KD, Wagle NS, et al. . Cancer statistics, 2023. CA Cancer J Clin 2023;73:17–48. 10.3322/caac.21763 - DOI - PubMed
    1. Distler M, Aust D, Weitz J, et al. . Precursor lesions for sporadic pancreatic cancer: Panin, IPMN, and MCN. Biomed Res Int 2014;2014:474905. 10.1155/2014/474905 - DOI - PMC - PubMed
    1. Guerra C, Barbacid M. Genetically engineered mouse models of pancreatic adenocarcinoma. Mol Oncol 2013;7:232–47. 10.1016/j.molonc.2013.02.002 - DOI - PMC - PubMed
    1. Waddell N, Pajic M, Patch A-M, et al. . Whole genomes redefine the mutational landscape of Pancreatic cancer. Nature 2015;518:495–501. 10.1038/nature14169 - DOI - PMC - PubMed
    1. Collisson EA, Sadanandam A, Olson P, et al. . Subtypes of pancreatic ductal adenocarcinoma and their differing responses to therapy. Nat Med 2011;17:500–3. 10.1038/nm.2344 - DOI - PMC - PubMed

Publication types

MeSH terms