. 2024 Jan 23;31(1):14.
doi: 10.1186/s12929-024-01002-z.

Plectin plays a role in the migration and volume regulation of astrocytes: a potential biomarker of glioblastoma

Affiliations

Plectin plays a role in the migration and volume regulation of astrocytes: a potential biomarker of glioblastoma

Maja Žugec et al. J Biomed Sci. .

Abstract

Background: The expression of aquaporin 4 (AQP4) and intermediate filament (IF) proteins is altered in malignant glioblastoma (GBM), yet the expression of the major IF-based cytolinker, plectin (PLEC), and its contribution to GBM migration and invasiveness, are unknown. Here, we assessed the contribution of plectin in affecting the distribution of plasmalemmal AQP4 aggregates, migratory properties, and regulation of cell volume in astrocytes.

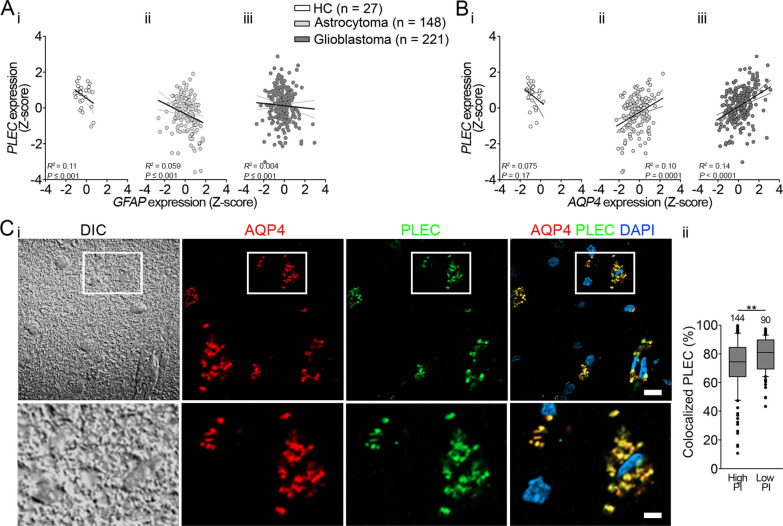
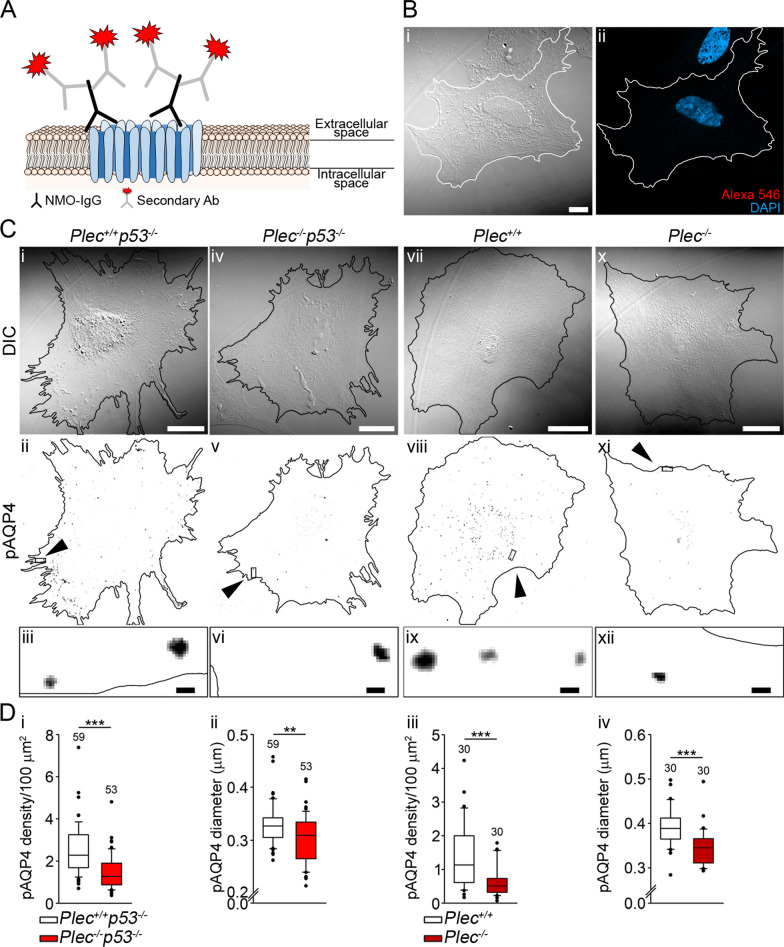
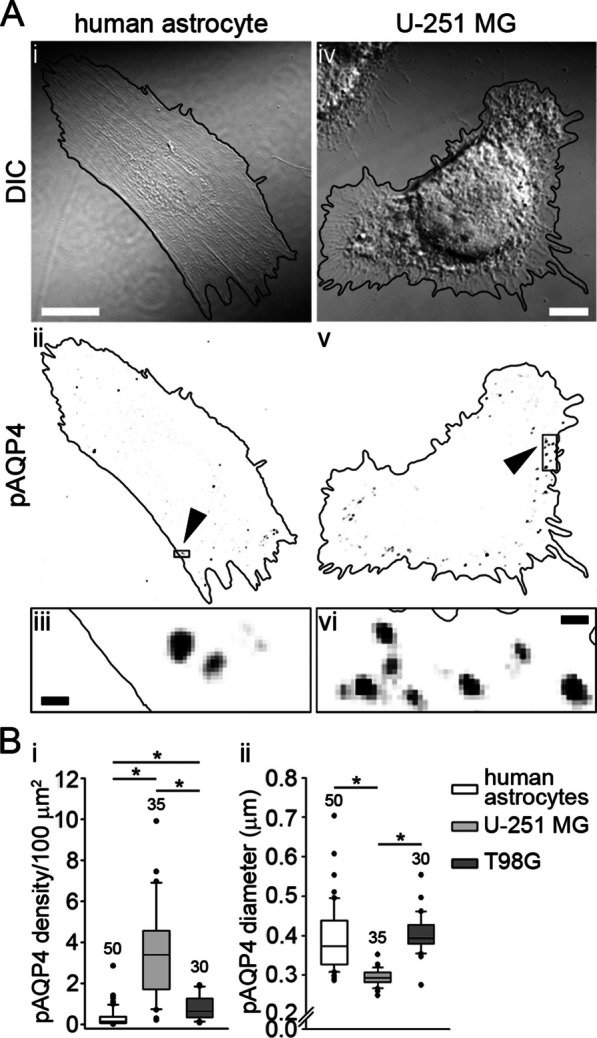
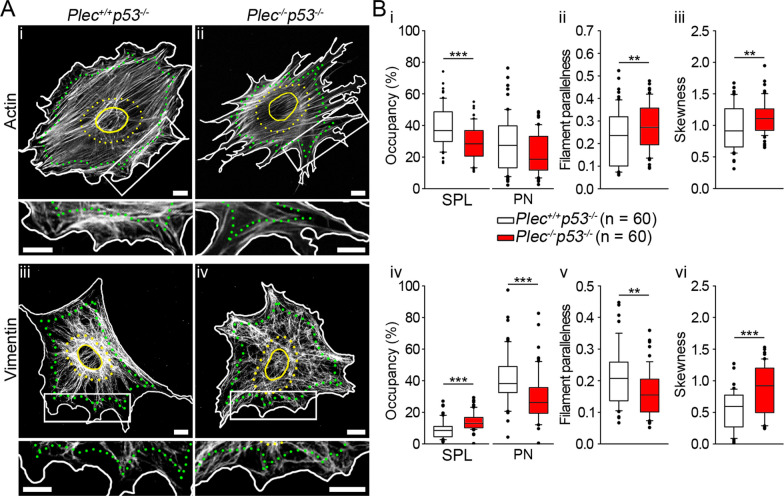
Methods: In human GBM, the expression of glial fibrillary acidic protein (GFAP), AQP4 and PLEC transcripts was analyzed using publicly available datasets, and the colocalization of PLEC with AQP4 and with GFAP was determined by immunohistochemistry. We performed experiments on wild-type and plectin-deficient primary and immortalized mouse astrocytes, human astrocytes and permanent cell lines (U-251 MG and T98G) derived from a human malignant GBM. The expression of plectin isoforms in mouse astrocytes was assessed by quantitative real-time PCR. Transfection, immunolabeling and confocal microscopy were used to assess plectin-induced alterations in the distribution of the cytoskeleton, the influence of plectin and its isoforms on the abundance and size of plasmalemmal AQP4 aggregates, and the presence of plectin at the plasma membrane. The release of plectin from cells was measured by ELISA. The migration and dynamics of cell volume regulation of immortalized astrocytes were assessed by the wound-healing assay and calcein labeling, respectively.

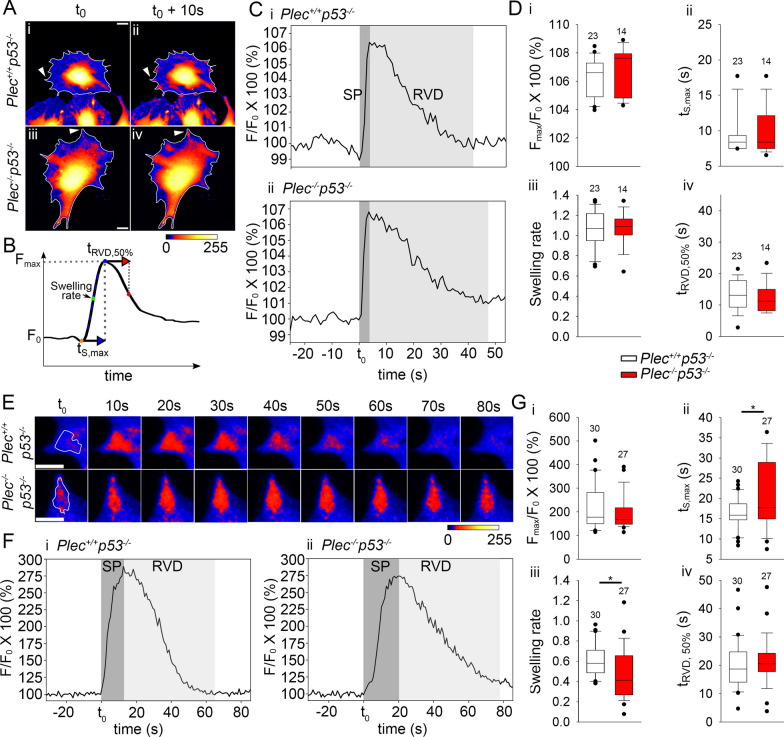
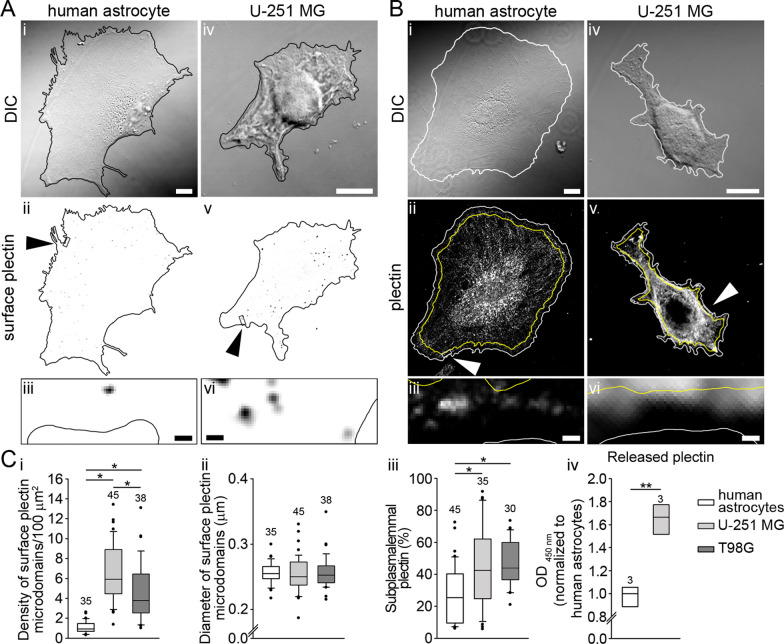
Results: A positive correlation was found between plectin and AQP4 at the level of gene expression and protein localization in tumorous brain samples. Deficiency of plectin led to a decrease in the abundance and size of plasmalemmal AQP4 aggregates and altered distribution and bundling of the cytoskeleton. Astrocytes predominantly expressed P1c, P1e, and P1g plectin isoforms. The predominant plectin isoform associated with plasmalemmal AQP4 aggregates was P1c, which also affected the mobility of astrocytes most prominently. In the absence of plectin, the collective migration of astrocytes was impaired and the dynamics of cytoplasmic volume changes in peripheral cell regions decreased. Plectin's abundance on the plasma membrane surface and its release from cells were increased in the GBM cell lines.

Conclusions: Plectin affects cellular properties that contribute to the pathology of GBM. The observed increase in both cell surface and released plectin levels represents a potential biomarker and therapeutic target in the diagnostics and treatment of GBMs.

Keywords: Aquaporin 4; Astrocyte; Cell migration; Cell volume; Cytoskeleton; Edema; Glioblastoma; Intermediate filaments; Plectin.


Conflict of interest statement

The authors declare that they have no competing interests.

Figures

Fig. 1
Fig. 1
The RNA (Z-score) and the protein localization of aquaporin4 (AQP4) and plectin (PLEC) correlate in human astrocytomas and glioblastomas (GBMs). A Gene expression (Z-score) of PLEC versus GFAP in healthy controls (HC) (Ai, y =  − 0.41 × x + 0.55; R2 = 0.11; P ≤ 0.001;), astrocytoma (Aii, y =  − 0.28 × x − 0.31; R2 = 0.059; P ≤ 0.001), and GBM (Aiii, y =  − 0.06 × x + 0.13; R2 = 0.004; P ≤ 0.001). Note inverse correlation in all cases. B Z-scores of PLEC versus AQP4 in HC. Note, no correlation in HC (Bi, y =  − 0.45 × x + 0.33; R2 = 0.075; P = 0.17), and positive correlation in astrocytoma (Bii, y = 0.34 × x − 0.24; R2 = 0.10; P = 0.0001), and GBM (Biii, y = 0.35 × x + 0.07; R2 = 0.14; P < 0.0001). n denotes the number of patients in (A) and (B). Ci Depiction of immunolabeled AQP4 and PLEC in a slice of human GBM IDH1 wild-type sample with low PI (Ki-67 = 15%). From left to right: DIC image and fluorescence micrographs showing immunolabeled AQP4, immunolabeled PLEC, and an overlay of AQP4, PLEC, and DAPI-labeled nuclei. Yellow color indicates the colocalization signal for AQP4 and PLEC. Sections within the rectangular area are enlarged below. Scale bars: 10 µm (magnified area, 3 µm). Cii The percentage of colocalized PLEC and AQP4 was lower in GBM with high proliferative index (high PI) in comparison with GBM with low proliferative index (low PI) (**P < 0.01, Mann–Whitney U test). Samples were obtained from patients with GBM IDH1 wild-type (three patients with high PI, two patients with low PI). Numbers above the boxplots represent the number of cells analyzed
Fig. 2
Fig. 2
Plectin deficiency reduces the abundance and size of plasmalemmal AQP4 aggregates in immortalized and primary mouse astrocytes. A Schematic depiction of a plasmalemmal AQP4 aggregate (pAQP4; cluster of channels in blue) with NMO-IgG serum antibodies (black) bound to the extracellular domain of AQP4, and with secondary antibodies (gray) conjugated Alexa-546 (red) fluorescent dye. Bi and Bii DIC image of Plec−/−p53−/− astrocyte and the corresponding fluorescent micrograph with DAPI-labeled cell nuclei. Labeling with secondary (Alexa-546) antibodies alone did not result in measurable fluorescence. C DIC images of immortalized (Plec+/+p53−/− and Plec−/−p53−/−) (Civi) and primary (Plec+/+ and Plec−/−) (Cviixii) astrocytes with corresponding inverted fluorescent micrographs depicting labeling of plasmalemmal AQP4 aggregates (black puncta) with enlarged boxed sections (below). Cells are outlined in black. Plasmalemmal AQP4 aggregates in inverted fluorescent micrographs (Cii,v,viii,xi) are displayed as black puncta; arrowheads point to demarcated areas that are enlarged in the panels below (Ciii,vi,ix,xii). Scale bars: 20 µm (enlarged areas, 0.5 µm). D Quantification of plasmalemmal AQP4 aggregates is revealed in (C). Note that immortalized as well as primary astrocytes that express plectin (Plec+/+p53−/− and Plec+/+, respectively) have more plasmalemmal AQP4 aggregates per 100 µm2 (Di, Diii; ***P ≤ 0.001; Mann–Whitney U test), and their mean size is larger (Dii, Div; **P < 0.01, ***P ≤ 0.001; Mann–Whitney U test), compared with astrocytes devoid of plectin. The data were obtained from astrocytes isolated from two mice per genotype. Experiments were performed in duplicate. The numbers above the boxplots are the number of cells analyzed
Fig. 3
Fig. 3
U-251 MG and T98G cells express more plasmalemmal AQP4 aggregates than human astrocytes. A DIC images with corresponding inverted fluorescent micrographs and enlarged sections of a human astrocyte (Aiiii) and of a U-251 MG cell (Aivvi). Cells are outlined in black, plasmalemmal AQP4 aggregates (pAQP4) are displayed as black dots. Arrowheads in (Aii,v) point to boxed areas enlarged in Aiii,vi. Scale bars: 20 µm (enlarged area, 0.5 µm). Bi Human astrocytes have fewer plasmalemmal AQP4 aggregates in comparison with U-251 MG and T98G cells (*P < 0.05; one-way ANOVA followed by Dunn’s method). Bii Human astrocytes have larger plasmalemmal AQP4 aggregates in comparison with U-251 MG, but are similar in size to T98G cells (*P < 0.05; one-way ANOVA followed by Dunn’s method). Human astrocytes were isolated from two donors. Experiments were performed in triplicate. The numbers above the boxplots are the number of cells analyzed
Fig. 4
Fig. 4
Plectin deficiency affects the distribution of actin filaments (AFs) and vimentin filaments (VFs) in immortalized mouse astrocytes. A Immunolabeled AFs (Ai,ii) and VFs (Aiii,iv) in Plec+/+p53−/− (left panels) and Plec−/−p53−/− (right panels) astrocytes. Boxed areas in whole-cell images are shown enlarged below the corresponding micrographs. Cell outlines are depicted in white, the border of the subplasmalemmal (SPL) area (the area between the cell outline and the line calculated by reducing the cell area by 20%) is demarcated by green puncta. Cell nuclei and perinuclear (PN) region (2 × the size of the nucleus area) are outlined in yellow by a line and puncta, respectively. Scale bars: 10 µm. B Statistical analysis of cytoskeletal filament distribution. Note that compared with Plec+/+p53−/− astrocytes, in Plec−/−p53−/− astrocytes, AFs are retracted from the SPL area and are more parallel and more bundled throughout the cell cytoplasm (Biiii), whereas VFs are more abundant in the SPL area, less abundant in the PN area, less parallel and more bundled in the cytoplasm (Bivvi). **P < 0.01, ***P ≤ 0.001; Mann–Whitney U test. The data were obtained from astrocytes isolated from two mice per genotype. Experiments were performed in duplicate. n indicates the number of cells analyzed
Fig. 5
Fig. 5
Quantitation of plectin isoform transcripts, plectin-AQP4 aggregates in the plasmalemma colocalization, and preferential targeting of isoform P1c to plasmalemmal AQP4 aggregates. A Total RNAs isolated from primary wild-type (Wt-p) and immortalized (Wt-i) astrocytes derived from 1- to 2-day-old Plec+/+ and Plec+/+p53−/− mice, respectively, were subjected to RT-PCR using isoform-specific primers as listed in Additional file 1: Table S2. Ai Expression pattern of plectin isoforms in primary astrocytes. Note that isoforms P1c, P1e, and P1g, which start with the alternative first exons Ex1c, Ex1e, and Ex1g, are the ones most abundantly expressed in astrocytes. Aii Comparison of isoform P1c, P1e, and P1g expression patterns in primary (Wt-p) versus immortalized (Wt-i) astrocytes. The average for each is plotted with standard deviation error bars drawn. The difference between the means of the two groups was not statistically significant (P > 0.05; paired t-test). B Fluorescent micrographs of NMO-IgG-labeled plasmalemmal AQP4 aggregates (green) and immunolabeled plectin (red) in a human astrocyte (Bi), a U-251 MG cell (Bii), and a Plec+/+p53−/− astrocyte (Biii). Biv The percentage of plasmalemmal AQP4 aggregates that colocalize with native plectin is higher in U-251 MG cells as well as Plec+/+p53−/− astrocytes, compared with human astrocytes (*P < 0.05; one-way ANOVA followed by Dunn’s method). C Fluorescent micrographs of U-251 MG (Ci), Plec−/−p53−/− and Plec+/+p53−/− astrocytes (Cii, Ciii, respectively), transfected with P1c-mCherry (red) and labeled with NMO-IgG (green). Cells are outlined in white. Arrows point to boxed areas shown enlarged in insets. White masks depict plasmalemmal AQP4 aggregates colocalizing with plectin (pinpointed by arrowheads). Scale bars: 20 µm (enlarged section, 0.5 µm). Civvi Statistics showing that P1c’s colocalization with plasmalemmal AQP4 aggregates upon forced expression in U-251 MG cells and in Plec−/− and Plec+/+ astrocytes is significantly higher compared with that of the other transiently expressed isoforms (P1c/2α3α, P1e, and P1g) (*P < 0.05; one-way ANOVA followed by Dunn’s method). Human astrocytes were isolated from two donors, astrocytes from two Plec−/−p53−/− and two Plec+/+p53−/− mice. Experiments were performed in duplicate. The numbers above the boxplots indicate the number of cells analyzed
Fig. 6
Fig. 6
The mobility of astrocytes is plectin dependent. (A) Time-lapse images of Plec+/+p53−/− (Ai) and Plec−/−p53−/− (Aii) astrocytes, and of U-251 MG GBM cells (Aiii) at 0, 12, and 24 h after the initiation of a wound-healing assay. The cell-free (gap) area is depicted in white. The percentages indicate the area of the gap area versus the initial gap in the representative images. Scale bars: 200 µm. B The closure of the gap over time is shown for Plec+/+p53−/− (Bi), Plec−/−p53−/− (Bii), and U-251 MG (Biii) cells. The complete closure of the gap was achieved in 25.2 ± 0.9 h for Plec+/+p53−/−, 29 ± 0.9 h for Plec−/−p53−/−, and 94.7 ± 0.9 h for U-251 MG cells. Solid lines represent the linear regression of the first four time points (0–12 h). Dotted lines indicate confidence limits (α = 0.05). Biv,v The collective migration of Plec+/+p53−/− astrocytes was faster in comparison with Plec−/−p53−/− astrocytes (**P < 0.01; Mann–Whitney U test), which was reflected in the shorter time needed for Plec+/+p53−/− cells to repopulate 50% of the gap (t1/2; *P < 0.05; Mann–Whitney U test). Bvi,vii The median speed of the collective migration of U-251 MG cells was 3.5 ± 0.1 µm/h, and the median t1/2 = 45.7 ± 1.1 h. The data were obtained from astrocytes isolated from two Plec+/+p53−/− and two Plec−/− p53−/− mice, and from U-251 MG cells. C Graphs depict enhanced mobility of Plec−/−p53−/− astrocytes after forced expression of isoform P1c. Note that the average speed of Plec−/−p53−/− cells transfected with P1c was higher than that of Plec+/+p53−/− cells in each time period measured; the speed of non-transfected Plec−/−p53−/− cells (NTC) was the lowest (Ci). In line with the velocity measurements, Plec−/−p53−/− NTC migrated over the shortest distance (Cii) (*P < 0.05; one-way ANOVA followed by Dunn’s method). The data were obtained from astrocytes isolated from two Plec+/+p53−/− and two Plec−/−p53−/− mice, and from U-251 MG cells. Numbers above the boxplots in B denote the number of replicates; C n denotes the number of cells analyzed
Fig. 7
Fig. 7
Plectin deficiency leads to local hypo-osmotic shock-induced changes in cell volume. A Calcein AM loaded Plec+/+p53−/− and Plec−/−p53−/− astrocytes recorded in iso-osmotic (300 mOsm) (Ai,iii) and in hypo-osmotic (200 mOsm) conditions. The pseudocolored scale of 0–255 corresponds to fluorescence intensity, with cooler colors (blue) representing lower intensity and hotter colors (red) indicating higher intensity (and concentration) of calcein. (Aii,iv) Hypo-osmotic conditions triggered an increase in calcein fluorescence. Scale bar: 20 µm. t0, time point of induction of hypo-osmotic conditions; t0 + 10 s, time point 10 s after induction of hypo-osmotic conditions. B Recording of the fluorescence intensity of calcein over time in single astrocytes, reflecting the parameters of cell volume changes, i.e., Fmax (maximal increase in the volume), F0 (normalized baseline volume), ts,max (swelling duration), the (maximal) swelling rate, and tRVD,50% (half-time of RVD). C Representative recordings of the relative fluorescence changes (F/F0 × 100%) in Plec+/+p53−/− (Ci) and Plec−/−p53−/− (Cii) astrocytes. Dark gray denotes the swelling phase (SP); RVD is shaded in light gray. D Changes in the whole-cell volume. Note that the maximum relative fluorescence increase (Fmax/F0 × 100%) (Di), ts,max (Dii), the swelling rate (Diii), and tRVD,50% (Div) were similar between Plec+/+p53−/− and Plec−/−p53−/− astrocytes. E Time-lapse sequences of local peripheral regions (LPRs). Two LPRs from (A) are shown (marked with arrowheads) displaying changes in the fluorescence intensity of calcein (in pseudocolors) in Plec+/+p53−/− and Plec−/−p53−/− astrocytes. Scale bars: 10 µm. F Representative recordings of relative cell fluorescence changes (Fmax/F0 × 100%) measured in an LPR of a single Plec+/+p53−/− (Fi) and Plec−/−p53−/− (Fii) astrocyte (swelling phase (SP) in dark gray, RVD in light gray). G Note that the duration of swelling (tS,max) was increased (Gii) and the swelling rate (Giii) of LPR was reduced in Plec−/−p53−/− compared with Plec+/+p53−/− astrocytes (*P < 0.05, Mann–Whitney U test); the maximum relative fluorescence increase (Gi) and tRVD,50% (Giv) were similar. Numbers above the boxplots denote the number of cells (D) and LPRs (G) analyzed
Fig. 8
Fig. 8
U-251 MG and T98G cells express more surface plectin microdomains and have more subplasmalemmal plectin than human astrocytes. Aivi DIC images of a human astrocyte (Aiiii) and of a U-251 MG cell (Aivvi) with the corresponding inverted fluorescent micrographs and enlarged sections below depicting surface plectin microdomains. Cell outlines are shown in black; surface plectin microdomains in inverted fluorescent micrographs are displayed as black puncta. Arrowheads in Aii,v point to demarcated areas that are enlarged in panels below (Aiii,vi). Scale bars: 10 µm (enlarged section, 0.5 µm). Bivi Vertically aligned DIC images of a human astrocyte (Biiii) and a U-251 MG cell (Bivvi) are shown with the corresponding inverted fluorescent micrographs of immunolabeled plectin and enlarged sections below depicting intracellular plectin. Rectangular regions in (Bii,v) demarcated in white and indicated by arrowheads are enlarged below in Biii,vi. Cell boundaries are outlined in white and subplasmalemmal areas (the area between the cell outline and the line calculated by reducing the cell area by 10%) are outlined in yellow. Scale bars: 10 µm (enlarged sections, 0.5 µm). Ci The density of surface plectin microdomains is lower in human astrocytes compared with U-251 MG and T98G cells (*P < 0.05; one-way ANOVA followed by Dunn’s method), whereas diameters of surface plectin microdomains (Cii) are similar among all cell types (P = 0.623; Kruskal–Wallis test). Ciii Subplasmalemmal distribution of plectin in the cytoplasm of human astrocytes, U251 MG and T98G cells. Note that subplasmalemmal plectin is ~ 2 times more abundant in U-251 MG and T98G cells than in human astrocytes (*P < 0.05 one-way ANOVA followed by Dunn’s method). Civ Released plectin from cells is depicted as optical density (OD) at 450 nm using rabbit anti-plectin antiserum #9. U-251 MG cells release approximately 1.5 times more plectin as human astrocytes (**P < 0.01; Student’s t test). Data were obtained from human astrocytes isolated from two donors. Experiments were performed in triplicate. In panels Ciiii the numbers above the boxplots are the number of cells analyzed, while in the panel Civ the numbers represent the number of independent samples

Similar articles

Cited by

References

    1. Zong H, Verhaak RG, Canoll P. The cellular origin for malignant glioma and prospects for clinical advancements. Expert Rev Mol Diagn. 2012;12(4):383–394. doi: 10.1586/erm.12.30. - DOI - PMC - PubMed
    1. Louis DN, Perry A, Reifenberger G, von Deimling A, Figarella-Branger D, Cavenee WK, et al. The 2016 World Health Organization classification of tumors of the central nervous system: a summary. Acta Neuropathol. 2016;131(6):803–820. doi: 10.1007/s00401-016-1545-1. - DOI - PubMed
    1. Vitovcova B, Skarkova V, Rudolf K, Rudolf E. Biology of glioblastoma multiforme-exploration of mitotic catastrophe as a potential treatment modality. Int J Mol Sci. 2020;21(15):5324. doi: 10.3390/ijms21155324. - DOI - PMC - PubMed
    1. van Bodegraven EJ, van Asperen JV, Robe PAJ, Hol EM. Importance of GFAP isoform-specific analyses in astrocytoma. Glia. 2019;67(8):1417–1433. doi: 10.1002/glia.23594. - DOI - PMC - PubMed
    1. Mou K, Chen M, Mao Q, Wang P, Ni R, Xia X, et al. AQP-4 in peritumoral edematous tissue is correlated with the degree of glioma and with expression of VEGF and HIF-alpha. J Neurooncol. 2010;100(3):375–383. doi: 10.1007/s11060-010-0205-x. - DOI - PubMed