

Associations between sex, body mass index and the individual microglial response in Alzheimer's disease
- PMID: 38263017
- PMCID: PMC10804830
- DOI: 10.1186/s12974-024-03020-y
Associations between sex, body mass index and the individual microglial response in Alzheimer's disease
Abstract
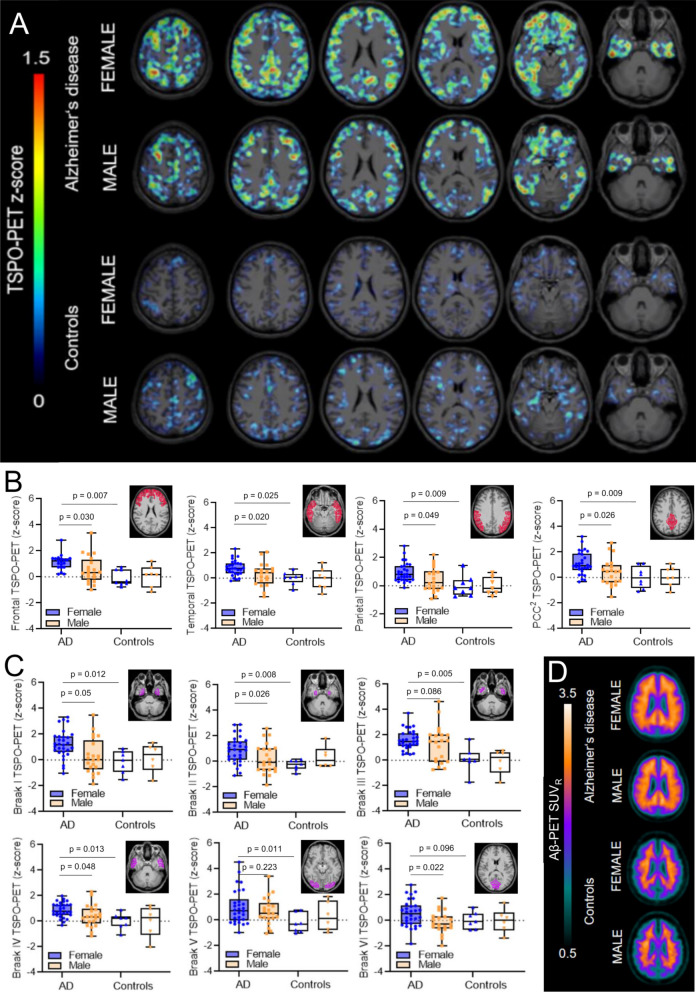
Background and objectives: 18-kDa translocator protein position-emission-tomography (TSPO-PET) imaging emerged for in vivo assessment of neuroinflammation in Alzheimer's disease (AD) research. Sex and obesity effects on TSPO-PET binding have been reported for cognitively normal humans (CN), but such effects have not yet been systematically evaluated in patients with AD. Thus, we aimed to investigate the impact of sex and obesity on the relationship between β-amyloid-accumulation and microglial activation in AD.
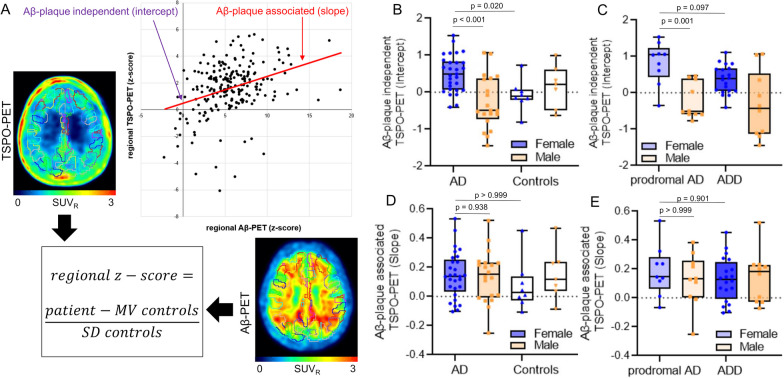
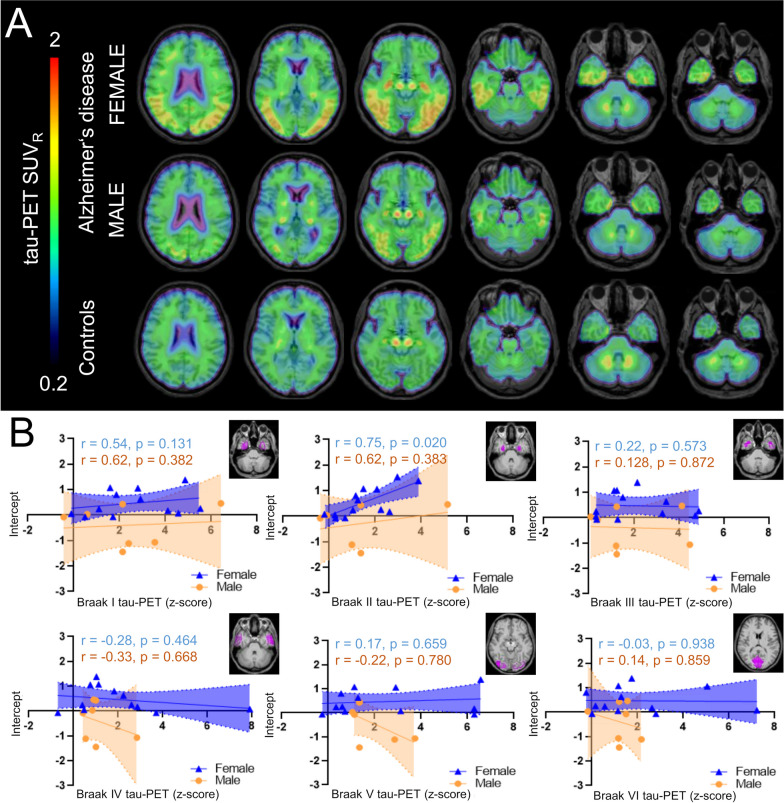
Methods: 49 patients with AD (29 females, all Aβ-positive) and 15 Aβ-negative CN (8 female) underwent TSPO-PET ([18F]GE-180) and β-amyloid-PET ([18F]flutemetamol) imaging. In 24 patients with AD (14 females), tau-PET ([18F]PI-2620) was additionally available. The brain was parcellated into 218 cortical regions and standardized-uptake-value-ratios (SUVr, cerebellar reference) were calculated. Per region and tracer, the regional increase of PET SUVr (z-score) was calculated for AD against CN. The regression derived linear effect of regional Aβ-PET on TSPO-PET was used to determine the Aβ-plaque-dependent microglial response (slope) and the Aβ-plaque-independent microglial response (intercept) at the individual patient level. All read-outs were compared between sexes and tested for a moderation effect of sex on associations with body mass index (BMI).
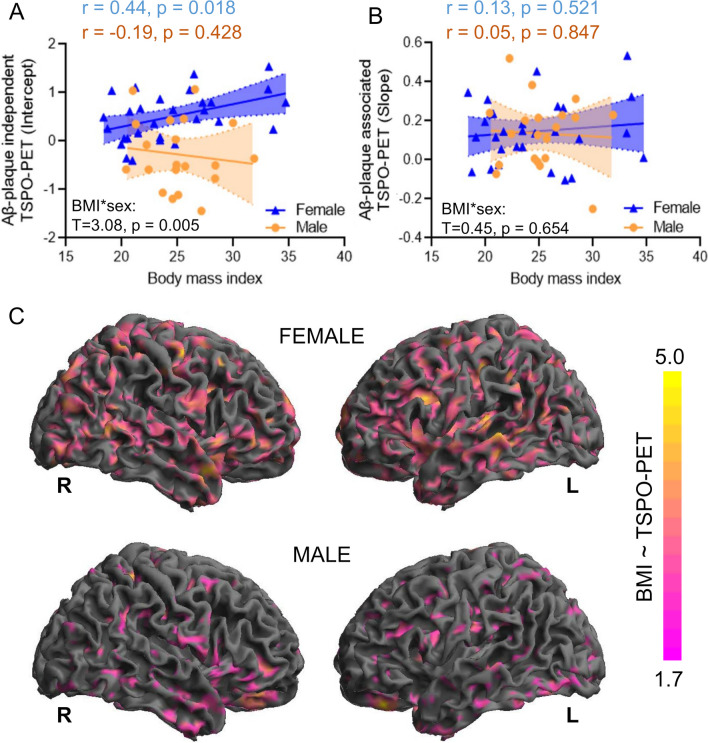
Results: In AD, females showed higher mean cortical TSPO-PET z-scores (0.91 ± 0.49; males 0.30 ± 0.75; p = 0.002), while Aβ-PET z-scores were similar. The Aβ-plaque-independent microglial response was stronger in females with AD (+ 0.37 ± 0.38; males with AD - 0.33 ± 0.87; p = 0.006), pronounced at the prodromal stage. On the contrary, the Aβ-plaque-dependent microglial response was not different between sexes. The Aβ-plaque-independent microglial response was significantly associated with tau-PET in females (Braak-II regions: r = 0.757, p = 0.003), but not in males. BMI and the Aβ-plaque-independent microglial response were significantly associated in females (r = 0.44, p = 0.018) but not in males (BMI*sex interaction: F(3,52) = 3.077, p = 0.005).
Conclusion: While microglia response to fibrillar Aβ is similar between sexes, women with AD show a stronger Aβ-plaque-independent microglia response. This sex difference in Aβ-independent microglial activation may be associated with tau accumulation. BMI is positively associated with the Aβ-plaque-independent microglia response in females with AD but not in males, indicating that sex and obesity need to be considered when studying neuroinflammation in AD.
Keywords: Amyloid; Microglia; Sex differences; TSPO; Tau.
© 2024. The Author(s).
Conflict of interest statement
TG received consulting fees from AbbVie, Alector, Anavex, Biogen, Eli Lilly, Functional Neuromodulation, Grifols, Iqvia, Noselab, Novo Nordisk, NuiCare, Orphazyme, Roche Diagnostics, Roche Pharma, UCB, and Vivoryon; lecture fees from Grifols, Medical Tribune, Novo Nordisk, Roche Pharma, and Schwabe; and has received grants to his institution from Roche Diagnostics. GUH participated in industry-sponsored research projects from Abbvie, Biogen, Biohaven, Novartis, Roche, Sanofi, UCB; serves as a consultant for Abbvie, Alzprotect, Aprineua, Asceneuron, Bial, Biogen, Biohaven, Kyowa Kirin, Lundbeck, Novartis, Retrotope, Roche, Sanofi, UCB; received honoraria for scientific presentations from Abbvie, Bayer Vital, Bial, Biogen, Bristol Myers Squibb, Kyowa Kirin, Roche, Teva, UCB, Zambon; holds a patent on Treatment of Synucleinopathies. United States Patent No.: US 10,918,628 B2: EP 17 787 904.6-1109 / 3 525 788; received publication royalties from Academic Press, Kohlhammer, and Thieme. RP has received honoraria for advisory boards and speaker engagements from Roche, EISAI, Eli Lilly, Biogen, Janssen-Cilag, Astra Zeneca, Schwabe, Grifols, Novo Nordisk and Tabuk. MB received speaker honoraria from GE healthcare, Roche and LMI and is an advisor of LMI.
Figures
References
-
- Stefaniak J, O'Brien J. Imaging of neuroinflammation in dementia: a review. J Neurol Neurosurg Psychiatry. 2016;87(1):21–28. - PubMed
MeSH terms
Substances
Grants and funding
LinkOut - more resources
Full Text Sources
Medical
Research Materials
Miscellaneous
