. 2024 Jan 24;12(1):5.
doi: 10.1038/s41413-023-00312-6.

Transcriptional reprogramming during human osteoclast differentiation identifies regulators of osteoclast activity

Affiliations

Transcriptional reprogramming during human osteoclast differentiation identifies regulators of osteoclast activity

Morten S Hansen et al. Bone Res. .

Abstract

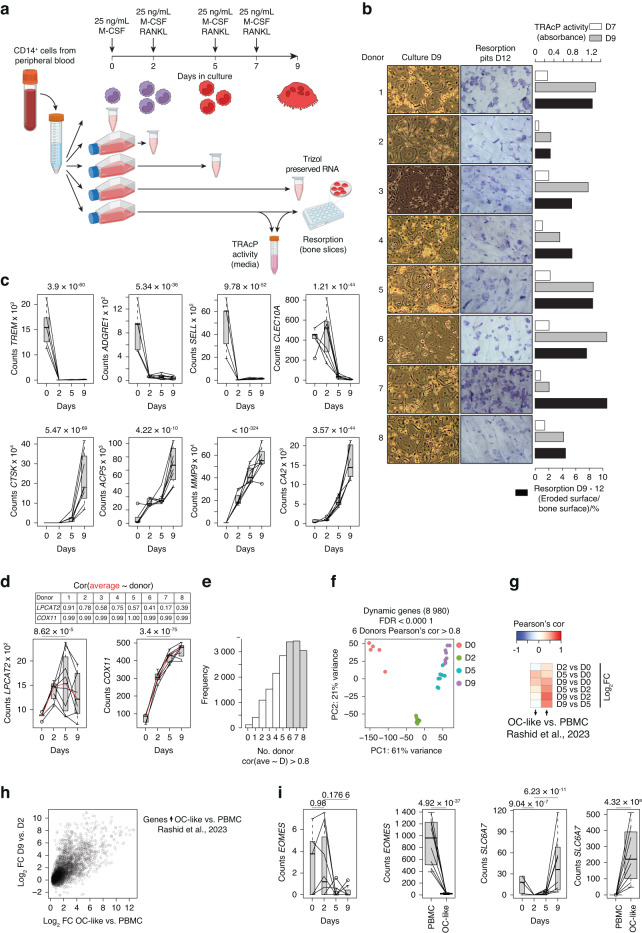
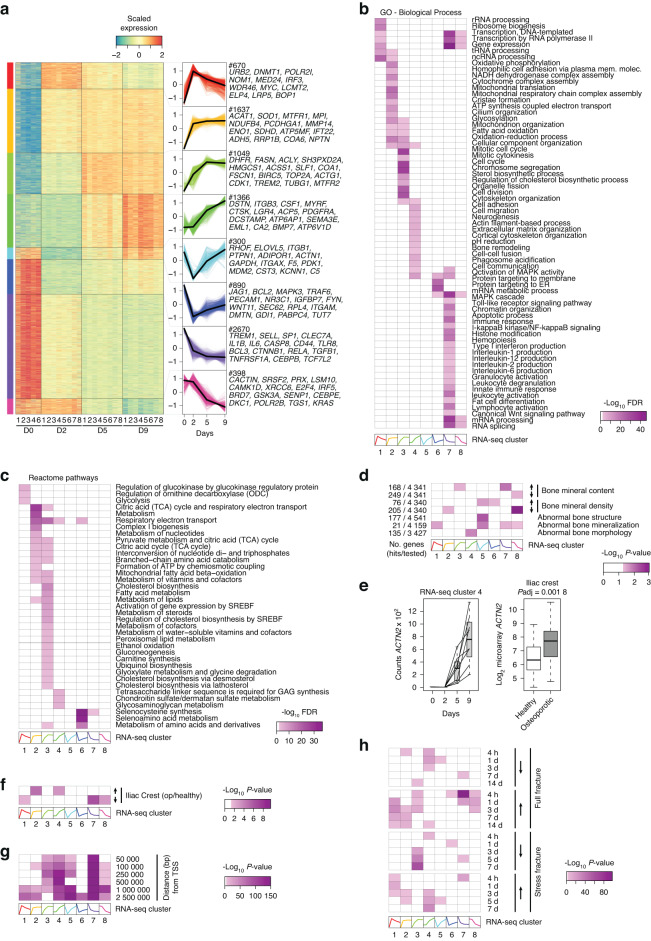
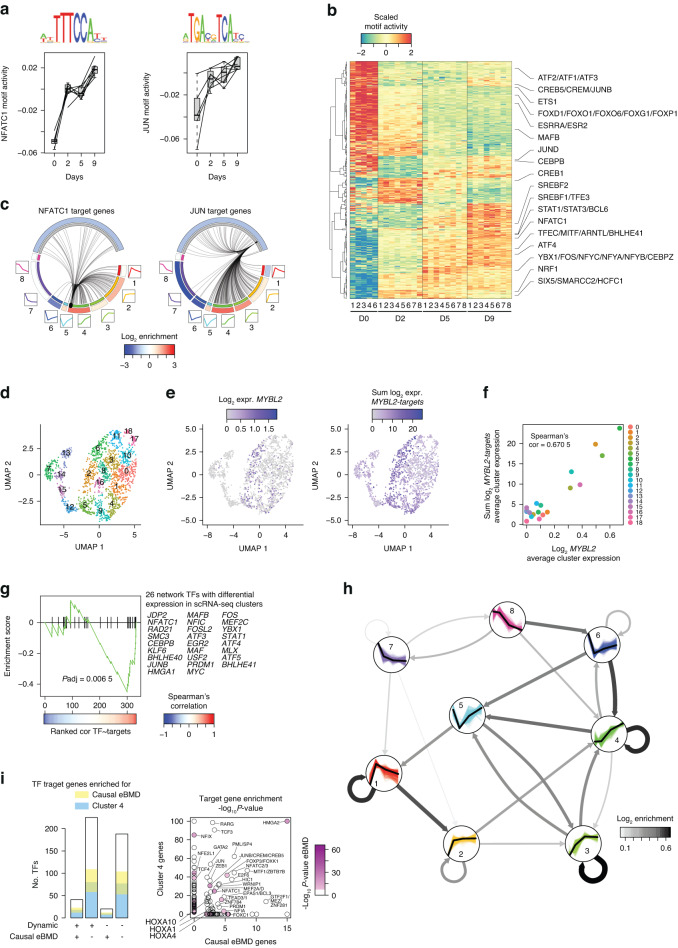
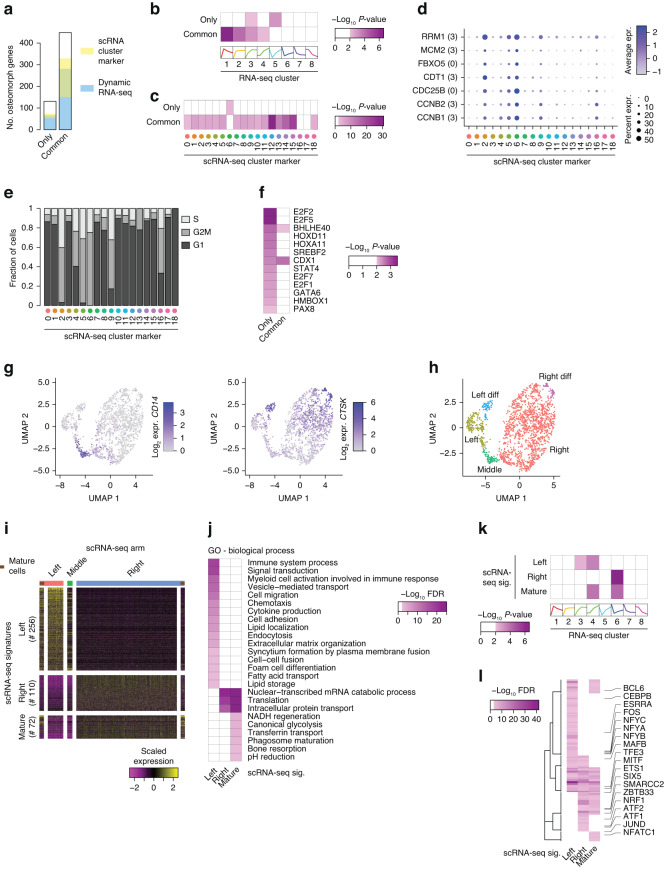
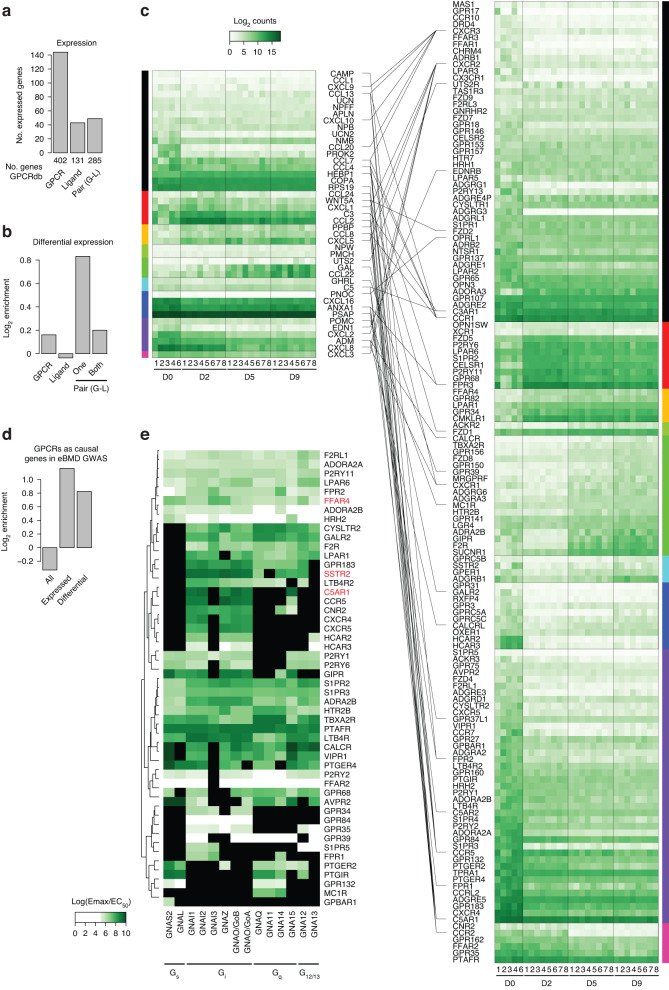
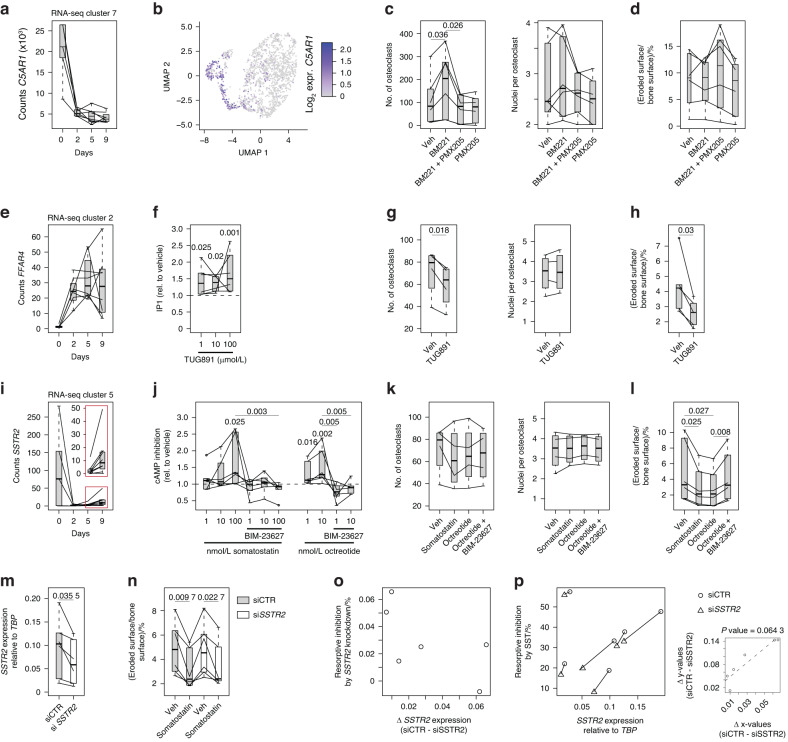
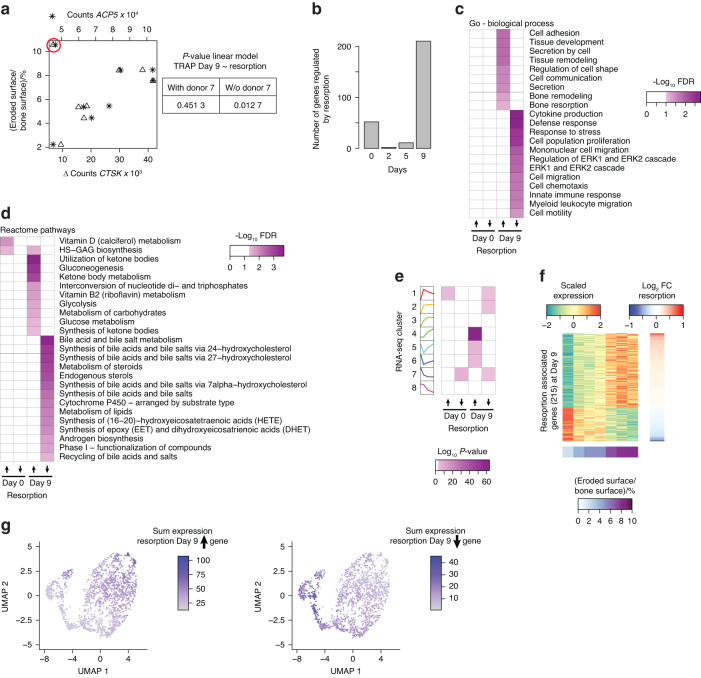
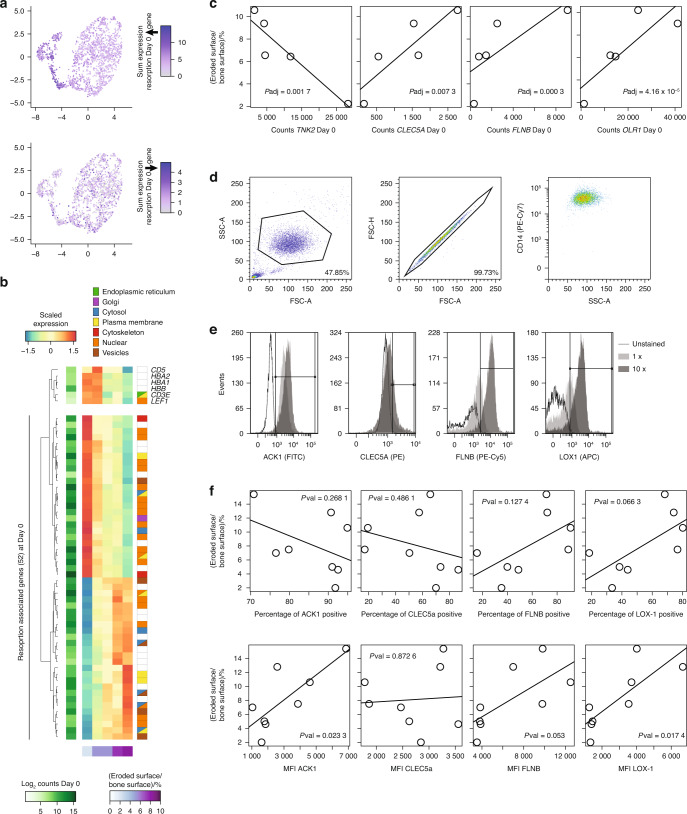
Enhanced osteoclastogenesis and osteoclast activity contribute to the development of osteoporosis, which is characterized by increased bone resorption and inadequate bone formation. As novel antiosteoporotic therapeutics are needed, understanding the genetic regulation of human osteoclastogenesis could help identify potential treatment targets. This study aimed to provide an overview of transcriptional reprogramming during human osteoclast differentiation. Osteoclasts were differentiated from CD14+ monocytes from eight female donors. RNA sequencing during differentiation revealed 8 980 differentially expressed genes grouped into eight temporal patterns conserved across donors. These patterns revealed distinct molecular functions associated with postmenopausal osteoporosis susceptibility genes based on RNA from iliac crest biopsies and bone mineral density SNPs. Network analyses revealed mutual dependencies between temporal expression patterns and provided insight into subtype-specific transcriptional networks. The donor-specific expression patterns revealed genes at the monocyte stage, such as filamin B (FLNB) and oxidized low-density lipoprotein receptor 1 (OLR1, encoding LOX-1), that are predictive of the resorptive activity of mature osteoclasts. The expression of differentially expressed G-protein coupled receptors was strong during osteoclast differentiation, and these receptors are associated with bone mineral density SNPs, suggesting that they play a pivotal role in osteoclast differentiation and activity. The regulatory effects of three differentially expressed G-protein coupled receptors were exemplified by in vitro pharmacological modulation of complement 5 A receptor 1 (C5AR1), somatostatin receptor 2 (SSTR2), and free fatty acid receptor 4 (FFAR4/GPR120). Activating C5AR1 enhanced osteoclast formation, while activating SSTR2 decreased the resorptive activity of mature osteoclasts, and activating FFAR4 decreased both the number and resorptive activity of mature osteoclasts. In conclusion, we report the occurrence of transcriptional reprogramming during human osteoclast differentiation and identified SSTR2 and FFAR4 as antiresorptive G-protein coupled receptors and FLNB and LOX-1 as potential molecular markers of osteoclast activity. These data can help future investigations identify molecular regulators of osteoclast differentiation and activity and provide the basis for novel antiosteoporotic targets.


Conflict of interest statement

The authors declare no competing interests.

Figures

Fig. 1
Fig. 1
RNA collection during human osteoclast differentiation. a Schematic representation of the experimental setup. b Light microscopy images of mature osteoclasts on Day 9 and of resorption pits on Day 12, absorbance-based TRAcP activity in media at Days 7 and 9, and quantification of the percentage of eroded surface per bone surface resorbed by 50 000 mature osteoclasts from Days 9 to 12 for each of the eight donors. c Box plot of RNA-seq-based gene expression levels for monocyte (upper panel) and osteoclast-specific (lower panel) genes. d Box plot of RNA-seq-based gene expression levels for lysophosphatidylcholine acyltransferase 2 (LPCAT2) and cytochrome c oxidase copper chaperone (COX11). e Histogram reporting the frequency of genes grouped by the number of donors with a Pearson correlation greater than 0.8 to the average expression level. Genes within black bars were considered for further analysis. f Principal component analysis plot based on genes with differential (FDR < 0.000 1 between at least two timepoints) and reproducible (≥6 donors with Pearson’s correlation >0.8 to the average) expression during human osteoclast differentiation. g Heatmap showing the Pearson correlation for log twofold changes in gene expression during osteoclast differentiation according to Rashid et al. h Scatter plot comparing the log twofold changes between OC-like cells and PBMCs from Rashid et al. with log twofold changes occurring between Day 9 and Day 2 of osteoclast differentiation in the present study. Genes were selected based on upregulation (FDR < 0.01) within expression data from Rashid et al.. i Box plot (band: mean; box: first and third quartiles; whiskers: 1.5 times the interquartile range) of RNA-seq-based gene expression levels for solute carrier family 6 member 7 (SLC6A7) in the present study (left panel) and from Rashid et al. (right panel)
Fig. 2
Fig. 2
Temporal changes in gene expression patterns link osteoclast function to bone biology. a Heatmap showing scaled expression levels of the 8 446 differentially expressed genes among the eight k-means clusters for each sample. b Heatmap showing the false discovery rate (GOseq) for the enrichment of the gene clusters for biological process-annotated Gene Ontology (GO) terms. c Heatmap showing the false discovery rate (GOseq) for the enrichment of the gene clusters for pathways of the Reactome database. d Heatmap showing the P value (hypergeometric test) for the enrichment of the gene clusters for genes that increase or decrease bone mineral content or bone mineral density or genes causing abnormal bone structure, mineralization, and morphology in knockout mouse models from the International Mouse Phenotyping Consortium (IMPC). e Box plot of RNA-seq-based (with cluster membership, lines represent individual donors) gene expression levels for actinin alpha 2 (ACTN2) during human osteoclast differentiation and microarray-based (limma-based statistics) mRNA expression of ACTN2 in iliac crest biopsies from healthy (n = 39) and osteoporotic (n = 27) subjects. f Heatmap showing the P value (hypergeometric test) for the enrichment of the gene clusters for genes up- or downregulated in iliac crest biopsies of osteoporotic patients (op) versus healthy controls. g Heatmap showing the enrichment of estimated bone mineral density (eBMD)-associated SNPs near genes whose expression changes dynamically during osteoclast differentiation. h Heatmap showing the P value (hypergeometric test) for the enrichment of the gene clusters for genes up- or downregulated during full or stress fracture in mice.
Fig. 3
Fig. 3
Machine learning highlights the transcriptional networks involved in human osteoclastogenesis. a Box plot of RNA-seq-based motif activity using ISMARA for NFATC1 and JUN during human osteoclast differentiation. Lines represent individual donors. b Heatmap showing the motif activity of transcription factors with differential activity (P value < 0.001) during human osteoclast differentiation. c Circular plot showing the ISMARA-predicted target genes of NFATC1 and JUN. d UMAP plot of scRNA-seq data from in vitro differentiated human osteoclasts on Day 14 of differentiation. e Gene expression levels of MYBL2 and the sum of MYBL2 target genes in a UMAP plot of differentiated human osteoclasts at the single-cell level. f Average cluster expression levels of MYBL2 versus the sum of MYBL2 targets in differentiated human osteoclasts at the single-cell level. g Gene set enrichment analysis of 26 transcription factors with cluster-specific expression patterns among the 329 transcription factors that were ranked according to Spearman’s correlation for transcription factor and target gene expression at the cluster level (as illustrated for MYBL2 in 3 F). h Network enrichment analysis (NEAT) showing significantly enriched regulatory relationships within and between RNA-seq clusters based on the ISMARA-predicted target genes. i Genome-wide associations and their predicted causal genes for estimated bone mineral density (eBMD) were filtered for transcription factor information
Fig. 4
Fig. 4
Subpopulation specificity of osteoclast transcriptional networks. a Bar plot showing overlap of osteomorph-selective (only) and osteomorph-osteoclast-selective (common) genes, with genes being differentially expressed throughout osteoclast differentiation at the bulk level (Fig. 2a – dynamic RNA-seq) and genes being cluster-specifically expressed in the scRNA-seq of mature osteoclasts (Fig. 3d – scRNA cluster marker). b Heatmap showing the P value (hypergeometric test) for the enrichment of the bulk RNA-seq gene clusters in Fig. 2a for the osteomorph-selective (only) and osteomorph-osteoclast-selective (common) genes. c Heatmap showing the P value (hypergeometric test) for the enrichment of the scRNA-seq cluster markers in Fig. 3d for the osteomorph-selective (only) and osteomorph-osteoclast-selective (common) genes. d Dot plot showing the cluster expression levels of the osteomorph-selective genes that overlap with the markers of scRNA-seq Cluster 6 in Fig. 3d. e Bar plot quantifying the cell cycle score according to the scRNA-seq data of mature osteoclasts. f Heatmap showing the unadjusted P values (hypergeometric test) for the enrichment of ISMARA-predicted transcription factor target genes for the osteomorph-selective (only) and osteomorph-osteoclast-selective (common) genes. g CD14 and CTSK gene expression levels on a UMAP plot of differentiated human osteoclasts at the single-cell level. h UMAP plot of scRNA-seq data from in vitro differentiated human osteoclasts on Day 14 of differentiation clustered into two subpopulations of differentiating cells (left and right) and one population of undifferentiated cells (middle connective piece). i Heatmap of gene expression levels for left-, right- and mature-specific gene groups. j Heatmap showing the false discovery rate (GOseq) for the enrichment of the scRNA-seq signatures in 4I for biological process-annotated GO terms. k Heatmap showing the P value (hypergeometric test) for the enrichment of the bulk RNA-seq gene clusters in 2 A for the scRNA-seq signatures in 4I. l Heatmap showing the Benjamini–Hochberg adjusted P values (hypergeometric test) for the enrichment of ISMARA-predicted transcription factor target genes for the scRNA–seq signatures in 4I
Fig. 5
Fig. 5
G-protein coupled receptors are highly differentially expressed during osteoclast differentiation. a Bar plot showing the frequency of nonolfactory G protein-coupled receptor (GPCR), gene-encoded GPCR ligand and receptor‒ligand (G-L) pairs from the GPCRdb expressed at the mRNA level during human osteoclast differentiation. b Bar plot quantifying the enrichment of GPCRs, gene-encoded ligands and pairs divided into one or both among the genes differentially expressed during human osteoclast differentiation. c Heatmap quantifying the gene expression levels of gene-encoded ligands (left panel) and GPCRs (right panel) during human osteoclast differentiation grouped according to gene clusters. d Bar plot quantifying the enrichment of nonolfactory GPCRs among the genes predicted to be causal genes in the eBMD GWAS, grouped into all and those expressed or differentially expressed during human osteoclast differentiation. e Heatmap quantifying the preferential coupling of GPCRs from RNA-seq Clusters 1–8 to G proteins according to the GPCRdb
Fig. 6
Fig. 6
C5AR1, SSTR2 and GPR120/FFAR4 activation modulates osteoclastogenesis and/or resorptive activity of mature osteoclasts. a Box plot of RNA-seq-based gene expression levels of complement 5A receptor 1 (C5AR1). b UMAP plot of C5AR1 gene expression in differentiated human osteoclasts at the single-cell level. c Box plot quantifying osteoclast numbers and nuclei per osteoclast after 9 days of osteoclast differentiation in the presence of the C5AR1 agonist BM221 (1 µg/mL) and/or antagonist PMX205 (5 µg/mL) (n = 6). d Box plot quantifying osteoclast resorptive activity as the percentage of eroded surface per bone surface for mature osteoclasts (Day 9) after 72 h on bovine bone slices in the presence of the C5AR1 agonist BM221 (1 µg/mL) and/or antagonist PMX205 (5 µg/mL) (n = 6). e Box plot of the RNA-seq-based gene expression levels of free fatty acid receptor 4 (FFAR4). f Box plot quantifying IP-1 levels in an HTRF assay, showing that the specific FFAR4 agonist TUG-891 increases IP-1 levels in mature osteoclasts (Day 9) after 30 min (n = 6). g Box plot quantifying osteoclast numbers and nuclei per osteoclast after 9 days of osteoclast differentiation in the presence of the FFAR4 agonist TUG-891 (10 nmol/L) (n = 4). h Box plot quantifying osteoclast resorptive activity as the percentage of eroded surface per bone surface for mature osteoclasts (Day 9) after 72 h on bovine bone slices in the presence of the FFAR4 agonist TUG-891 (10 nmol/L) (n = 5). i Box plot of RNA-seq-based gene expression levels of somatostatin receptor 2 (SSTR2). The inlet highlights the expression at Days 5 and 9. Lines represent individual donors. j Box plot quantifying the cAMP-Glo assay. k Box plot quantifying osteoclast numbers and nuclei per osteoclast after 9 days of osteoclast differentiation in the presence of the SSTR2 agonist somatostatin (100 nmol/L) and octreotide (10 nmol/L) and antagonism by BIM-23627 (100 nmol/L) (n = 4). l Box plot quantifying osteoclast resorptive activity as a percentage of eroded surface area per bone surface for mature osteoclasts (Day 9) after 72 h on bovine bone slices in the presence of the SSTR2 agonists somatostatin (100 nmol/L) and octreotide (10 nmol/L) and antagonism by BIM-23627 (100 nmol/L) (n = 6). m Box plot of real-time PCR-based gene expression levels of SSTR2 relative to TBP in osteoclasts on Day 9 of differentiation (n = 6). n Box plot quantifying osteoclast resorptive activity after 72 h on bovine bone slices in the presence of the SSTR2 agonist somatostatin (100 nmol/L) as a percentage of the eroded surface area per bone surface (n = 6). o Scatter plot quantifying the percentage change in bone resorption following SSTR2 knockdown (vehicle values from Fig. 8n: (siCTR – siSSTR2)/siCTR) relative to changes in SSTR2 expression (values from Fig. 8m: siCTR – siSSTR2) (n = 6). p Scatter plot quantifying the percentage change in bone resorption in response to somatostatin (values from Fig. 8n: (Veh – somatostatin)/Veh) over relative SSTR2 expression (values from Fig. 8m) (n = 6). The small scatterplot was used to quantify the delta of the x and y values of siCTR and siSSTR2, and the big scatterplot P value was calculated based on a linear regression model
Fig. 7
Fig. 7
Gene expression in monocytes and differentiated osteoclasts aligns with cellular resorption activity. a Scatter plot of the resorptive effect of CTSK (lower x-axis) and ACP5 (upper x-axis) on Day 9 of osteoclast differentiation. Donor 7 is highlighted with a red circle. The table shows the linear regression model for resorption and TRAP activity (Day 9) with and without donor 7. b Bar plot depicting the number of genes differentially expressed at Days 0, 2, 5, and 9 of osteoclast differentiation associated with resorptive activity (continuous DEseq2 model with FDR < 0.01). c Heatmap showing the false discovery rate (GOseq) for the enrichment of genes (Days 0 and 9) upregulated or downregulated with resorptive activity for biological process annotated Gene Ontology (GO) terms. d Heatmap showing the false discovery rate (GOseq) for the enrichment of genes (Days 0 and 9) upregulated or downregulated with resorptive activity for pathways of the Reactome. e Heatmap showing the p value (hypergeometric test) for the enrichment of the gene clusters for genes (Days 0 and 9) upregulated or downregulated with resorptive activity. f Heatmap showing scaled expression levels of the 215 genes related to resorptive activity on Day 9 of osteoclast differentiation that are differentially expressed. Row ranking based on log twofold change with resorption and column ranking based on resorptive activity of the donor cells. g UMAP plot showing the summed expression levels of resorption-associated genes whose expression was upregulated (left panel) or downregulated (right panel) on Day 9 of osteoclast differentiation
Fig. 8
Fig. 8
Monocytes represent surface protein markers that are predictive of resorption activity. a UMAP plot showing the summed expression levels of resorption-associated genes whose expression is upregulated (left panel) or downregulated (right panel) on Day 0 of osteoclast differentiation. b Heatmap showing scaled expression levels of the 52 resorption-associated genes in CD14+ monocytes (Day 0). c Scatter plot of the resorptive activity with the expression of tyrosine kinase nonreceptor 2 (TNK2, coding for ACK1), c-type lectin domain containing 5 A (CLEC5A), filamin B (FLNB), and oxidized low-density lipoprotein receptor 1 (OLR1, coding for LOX-1) on Day 0 of osteoclast differentiation. d Gating strategy for intact singlets of CD14+ monocytes. e Histograms illustrating the fluorescence intensity of CD14+ monocytes unstained or stained with antibodies against ACK1, CLEC5A, FLNB, or LOX-1 at two concentrations. f Percentage of positive cells (upper panel) and total fluorescence intensity (lower panel) of ACK1, CLEC5A, FLNB, and LOX-1 staining of CD14+ monocytes on Day 0 of osteoclast differentiation against the resorption activity of Day 9 differentiated osteoclasts that had been incubated on bone slices for 72 h (n = 8)

References

    1. Bolamperti S, Villa I, Rubinacci A. Bone remodeling: an operational process ensuring survival and bone mechanical competence. Bone Res. 2022;10:48. doi: 10.1038/s41413-022-00219-8. - DOI - PMC - PubMed
    1. Arai F, et al. Commitment and differentiation of osteoclast precursor cells by the sequential expression of c-Fms and receptor activator of nuclear factor kappaB (RANK) receptors. J. Exp. Med. 1999;190:1741–1754. doi: 10.1084/jem.190.12.1741. - DOI - PMC - PubMed
    1. Li X, et al. p38 MAPK-mediated signals are required for inducing osteoclast differentiation but not for osteoclast function. Endocrinology. 2002;143:3105–3113. doi: 10.1210/endo.143.8.8954. - DOI - PubMed
    1. Moon JB, et al. Akt induces osteoclast differentiation through regulating the GSK3β/NFATc1 signaling cascade. J. Immunol. 2012;188:163–169. doi: 10.4049/jimmunol.1101254. - DOI - PubMed
    1. Takayanagi H, et al. Induction and activation of the transcription factor NFATc1 (NFAT2) integrate RANKL signaling in terminal differentiation of osteoclasts. Dev. Cell. 2002;3:889–901. doi: 10.1016/S1534-5807(02)00369-6. - DOI - PubMed

Publication types