. 2024 Jan 23;9(1):18.
doi: 10.1038/s41541-023-00787-8.

In vivo assembly of epitope-coated biopolymer particles that induce anti-tumor responses

Affiliations

In vivo assembly of epitope-coated biopolymer particles that induce anti-tumor responses

Devi Jenika et al. NPJ Vaccines. .

Abstract

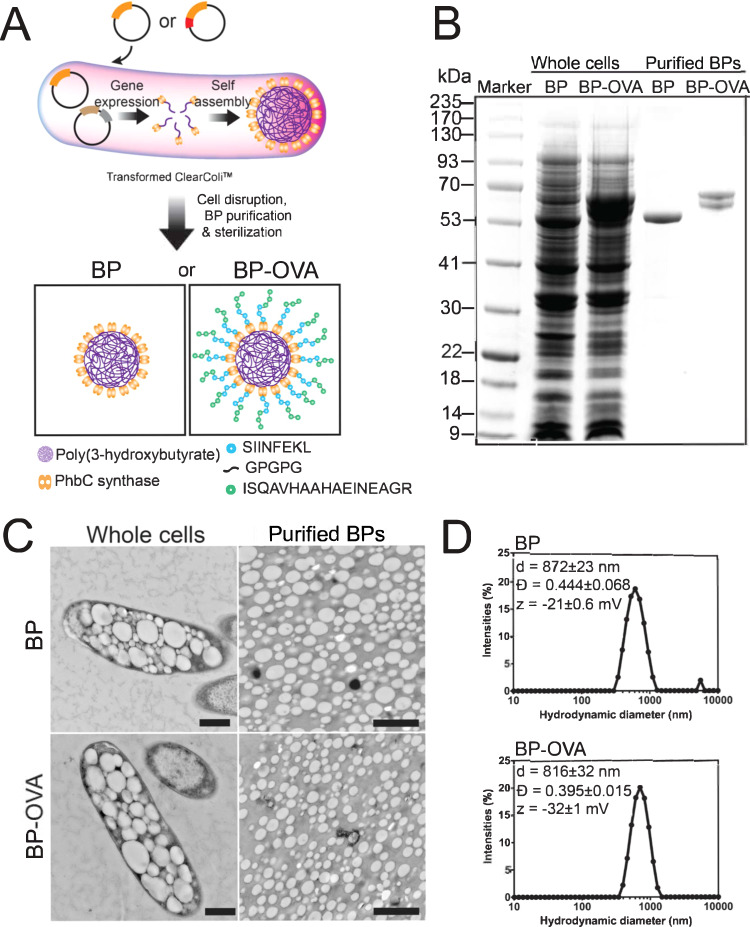
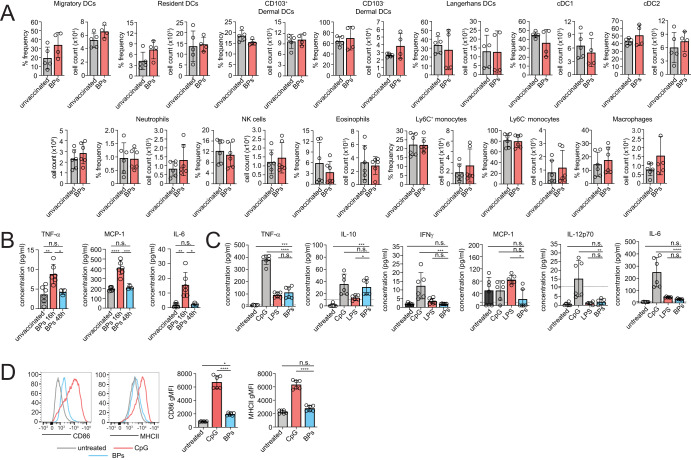
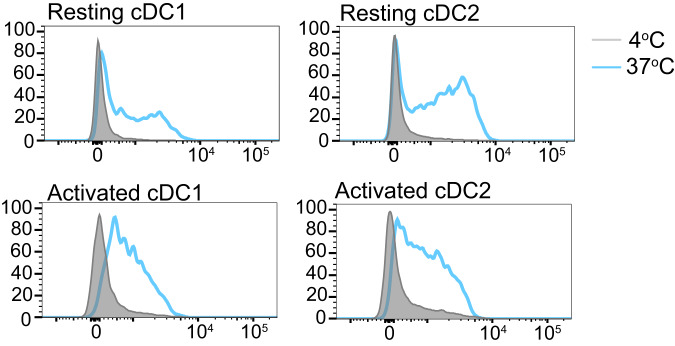
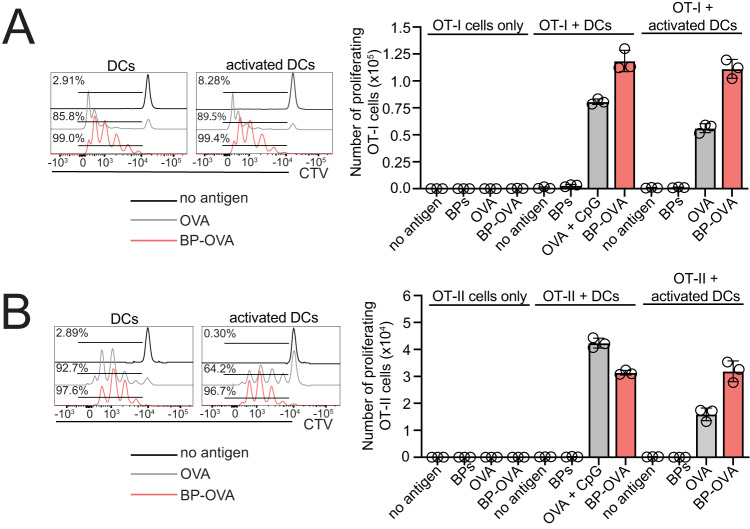
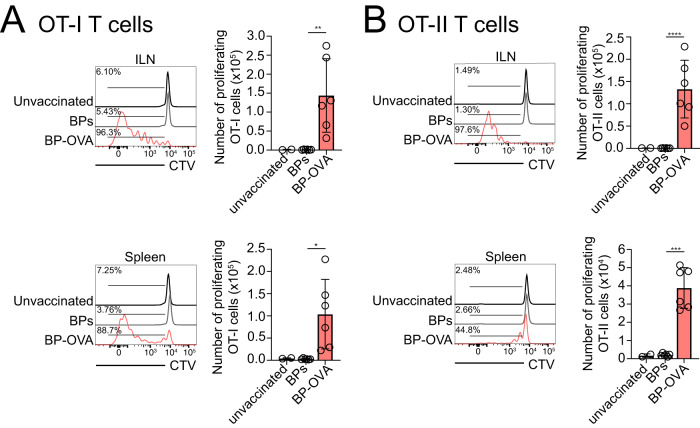
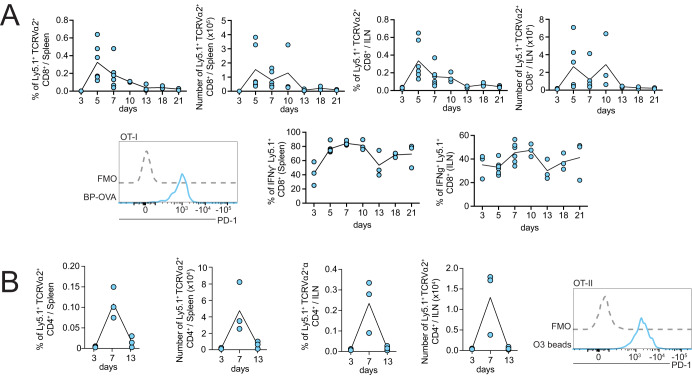
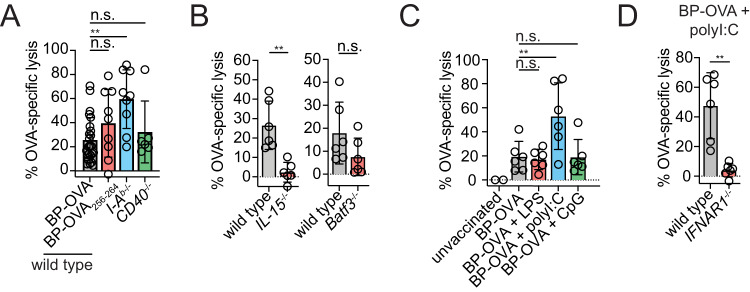
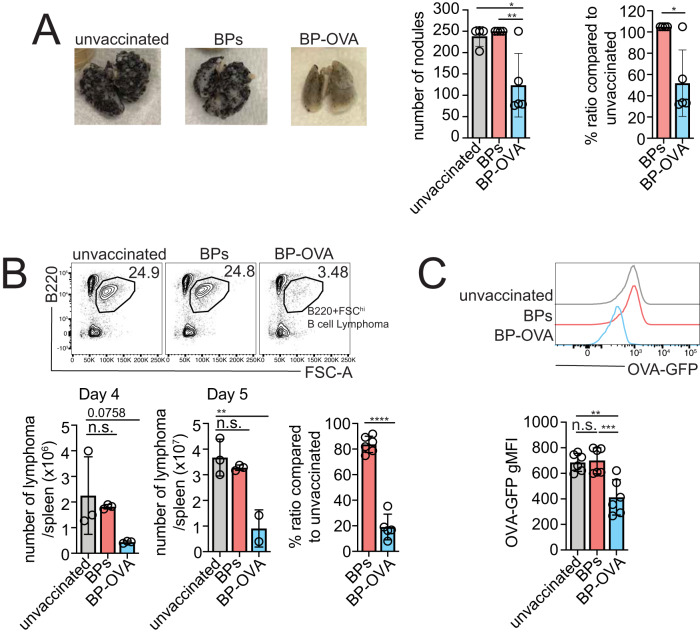
There is an unmet need for antigen delivery systems that elicit efficient T cell priming to prevent infectious diseases or for treatment of cancers. Here, we explored the immunogenic potential of biologically assembled biopolymer particles (BPs) that have been bioengineered to display the antigenic MHC I and MHC II epitopes of model antigen ovalbumin (OVA). Purified dendritic cells (DCs) captured BP-OVA and presented the associated antigenic epitopes to CD4+ T cells and CD8+ T cells. Vaccination with BP-OVA in the absence of adjuvant elicited antigen presentation to OVA-specific CD8+ and CD4+ T cells and cross-primed effective cytotoxic T lymphocyte (CTL) killers. BP-OVA induction of CTL killing did not require CD4+ T cell help, with active CTLs generated in BP-OVA vaccinated I-Ab-/- and CD40-/- mice. In contrast, IL-15 and type I IFN were required, with abrogated CTL activity in vaccinated IL-15-/- and IFNAR1-/- mice. cDC1 and/or CD103+ DCs were not essential for BP-OVA specific CTL with immunization eliciting responses in Batf3-/- mice. Poly I:C, but not LPS or CpG, co-administered as an adjuvant with BP-OVA boosted CTL responses. Finally, vaccination with BP-OVA protected against B16-OVA melanoma and Eμ-myc-GFP-OVA lymphoma inoculation. In summary, we have demonstrated that epitope-displaying BPs represent an antigen delivery platform exhibiting a unique mechanism to effectively engage T cell immune responses.


Conflict of interest statement

B.H.A.R. is inventor of the BP technology and co-founder and shareholder of PolyBatics Ltd. The remaining authors declare no competing interests.

Figures

Fig. 1
Fig. 1. Design, synthesis and characterization of bioengineered poly(3-hydroxybutyrate) beads displaying ovalbumin peptides.
A Schematic illustration of bioengineering ClearColiTM, an endotoxin-free Escherichia coli BL21(DE3) strain. The individual cells harbor two plasmids encoding for PhaA (brown) and PhaB (gray) on one plasmid, as well as encoding for PhbC synthase (orange) on the other plasmid or its translationally fusion to both SIINFEKL and ISQAVHAAHAEINEAGR (BP-OVA, red). Synergistic functionalities of the expressed genes enable in vivo production of a library of BPs. B Protein profiles of whole cells containing BPs and of purified BPs as determined by sodium dodecyl sulfate gel electrophoresis (SDS-PAGE). C Transmission electron microscopy (TEM) images of harvested cells (left panel; scale bar, 500 nm) and of purified BPs (right panel; scale bar, 2 μm). D Size distribution of BPs dispersed in 10 mM Tris buffer pH 7.5 obtained based on dynamic light scattering, along with their Z-average diameter (d), dispersity (Ð) and zeta potential (ζ).
Fig. 2
Fig. 2. BPs are weakly immunogenic.
A C57BL/6 mice were subcutaneously injected with 5 mg BPs or were unvaccinated. Inguinal lymph nodes were harvested after 16 h to determine the frequency and total number of immune cells. B C57BL/6 mice were subcuteneously injected with 5 mg BP-OVA and sera analysed by BD cytometric bead array after 16 or 48 h. C Splenic DCs were purified from C57BL/6 mice and incubated for 24 h in the presence of 0.5 μM of CpG type B 1688, 0.1 μg/ml O127:B8 E. coli LPS or 100 μg BP at 37 °C. Supernatant and serum were collected and cytokines analysed by BD Cytometric Bead Array (CBA) Mouse Inflammation Kit for flow cytometry analysis using FCAPTM Array Software. D MuTu DCs were incubated with or without 0.5 μM of CpG type B 1688 or 100 μg BP for 24 h at 37 °C prior to analysing surface levels of CD86 and MHC II by flow cytometry. Data is pooled from 1 - 2 independent experiments performed in triplicate. Bars represent mean ± SD and analysed using one-way ANOVA with Tukey’s multiple comparison test. *p < 0.05, **p < 0.01, ***p < 0.001, ****p < 0.0001, n.s. = not significant.
Fig. 3
Fig. 3. Primary DCs capture BPs in vitro.
Primary DCs were isolated from the spleens of C57BL/6 mice and left at 4 °C (resting) or incubated with CpG at 37 °C (activated) overnight. DCs were then incubated with Nile-Red labelled BPs for four hours at 4 °C or 37 °C and then stained with CD11c and CD8 to identify cDC1 (CD11c+ CD8+) and cDC2 (CD11c+ CD8) by flow cytometry. A representative of two independent experiments is shown.
Fig. 4
Fig. 4. DCs present antigen associated with BP-OVA to CD8+ and CD4+ T cells in vitro.
A, B 5 × 104 purified OT-I or OT-II were labelled with Cell Trace Violet (CTV) and incubated with 2.5 × 104 unstimulated DCs or DCs stimulated with CpG overnight. DCs were left untreated or incubated with 100 μg OVA, 100 μg OVA plus 5 μΜ CpG, 100 μg BP-OVA (278 ng OVA antigen) or 100 μg BP for 36 - 42 h. Division of Ly5.1+ TCRVα2+ CD8+ CTV-labelled OT-I and Ly5.1+ TCRVα2+ CD4+ OT-II T cells was assessed by flow cytometry. Histograms show proliferating OT-I or OT-II based on CTV dilution. One independent experiment was performed in triplicate. Bars represent mean ± SD.
Fig. 5
Fig. 5. Subcutaneous vaccination with BP-OVA induces CD4+ and CD8+ T cell responses in vivo.
1 × 106 purified OT-I (A) and OT-II (B) T cells were CTV labelled and injected intravenously into C57BL/6 mice. Mice were subcutaneously injected the following day with 5 mg BP or 5 mg BP-OVA (875 ng OVA antigen) and ILN and spleens harvested for analysis 60 - 64 h later. Division of CTV-labelled Ly5.1+ TCRVα2+ CD8+ OT-I and Ly5.1+ TCRVα2+ CD4+ OT-II T cells was assessed by flow cytometry. Representative histograms show proliferating OT-I or OT-II. Two independent experiments were performed in triplicate and each dot represents an individual mouse. Statistical analysis was performed using one-way ANOVA with Tukey’s multiple comparison test. Bars represent ±SD. *p < 0.05, **p < 0.01, ***p < 0.001, ****p < 0.0001.
Fig. 6
Fig. 6. Kinetics of T cell responses following subcutaneous vaccination with BP-OVA.
104 OT-I or OT-II cells were purified and injected to C57BL/6 one day prior to subcutaneous injection with 5 mg BP-OVA (2.825 μg OVA antigen). Organs were harvested from euthanised mice at 3, 5, 7, 10, 13, 18, and 21 days post-vaccination. A Frequency, number, PD-1 and IFNg expression by Ly5.1+ TCRVα2+ CD8+ OT-I in spleen and ILN. B Frequency, number, and PD1 expression by Ly5.1+ TCRVα2+ CD4+ OT-II cells in spleen and ILN. 1-2 independent experiments were performed with each dot representing an individual mouse. Bars represent ±SD. FMO is a background control “fluorescence minus one” stain, where the antibody specific for the marker examined is excluded from the staining panel.
Fig. 7
Fig. 7. BP-OVA vaccination elicits cytotoxic T lymphocyte killing in vivo.
A C57BL/6 wild type (WT) mice were subcutaneously injected with 5 mg BP-OVA or BP-OVA257-264 and I-Ab−/− or CD40−/− mice subcutaneously injected with 5 mg BP-OVA. B WT, IL-15−/− and Batf3−/− mice were subcutaneously injected with 5 mg BP-OVA. C WT mice were injected with 5 mg BP-OVA together with 1 μg LPS, 20 μg polyI:C or 20 nmol CpG. D WT mice and IFNAR1−/− mice were subcutaneously injected with 5 mg of BP-OVA together with 20 μg polyI:C. AD Six days following immunisation mice were injected intravenously with a 1:1 ratio of CTVhigh OVA257-264+ and CTVlow unpulsed target cells and CTL activity in spleen measured 36 - 42 h later by flow cytometry. Data is pooled from 2 - 3 independent experiments with each symbol representing an individual mouse. Statistical analysis was performed using t-test and one-way ANOVA with Tukey’s multiple comparison test. Bars represent mean ± SD. *p < 0.05, **p < 0.01, ***p < 0.001, ****p < 0.0001, n.s. = not significant.
Fig. 8
Fig. 8. BP-OVA vaccination elicits anti-tumour immunity.
A C57BL/6 mice were subcutaneously injected with 5 mg BP-OVA (2.8 μg OVA antigen) seven days prior to intravenous inoculation B16-OVA melanoma. Lungs were assessed for tumour nodules after 18 days following tumour inoculation. Pictures represent the lungs of mice in each immunisation group. B, C C57BL/6 mice were subcutaneously injected with 5 mg (2.8 μg OVA antigen) BP-OVA five days prior to intravenous inoculation with Eμ-myc-GFP-OVA lymphoma. Spleens were harvested four or five days after tumour inoculation and analysed by flow cytometry. B Dot plots show representative Eμ-myc lymphoma cells (B220+ FSChi), total number of lymphoma cells and C GFP expression following Eμ-myc-GFP-OVA inoculation. Data is pooled from up to two independent experiments with each symbol representing an individual mouse. Statistical analysis was performed using t-test and one-way ANOVA with Tukey’s multiple comparison test. Bars represent ±SD. n.s. = not significant; *p < 0.05; **p < 0.01; ****p < 0.0001.

Similar articles

Cited by

References

    1. Moradali MF, Rehm BHA. Bacterial biopolymers: from pathogenesis to advanced materials. Nat. Rev. Microbiol. 2020;18:195–210. doi: 10.1038/s41579-019-0313-3. - DOI - PMC - PubMed
    1. Parlane NA, et al. Self-assembled protein-coated polyhydroxyalkanoate beads: properties and biomedical applications. ACS Biomater. Sci. Eng. 2017;3:3043–3057. doi: 10.1021/acsbiomaterials.6b00355. - DOI - PubMed
    1. Gonzalez-Miro M, et al. Polyester as antigen carrier toward particulate vaccines. Biomacromolecules. 2019;20:3213–3232. doi: 10.1021/acs.biomac.9b00509. - DOI - PubMed
    1. Wibowo D, et al. Polymeric nanoparticle vaccines to combat emerging and pandemic threats. Biomaterials. 2021;268:120597. doi: 10.1016/j.biomaterials.2020.120597. - DOI - PMC - PubMed
    1. Hay, I. D., Hooks, D. O. & Rehm, B. H. A. Use of bacterial polyhydroxyalkanoates in protein display use of bacterial polyhydroxyalkanoates in protein display technologies. Hydrocarbon Lipid Microbiol. Protoc.10.1007/8623 (2014).