. 2024 Jan 23;14(1):2006.
doi: 10.1038/s41598-023-50752-7.

Cognitive effects on experienced duration and speed of time, prospectively, retrospectively, in and out of lockdown

Affiliations

Cognitive effects on experienced duration and speed of time, prospectively, retrospectively, in and out of lockdown

Cyril Nicolaï et al. Sci Rep. .

Abstract

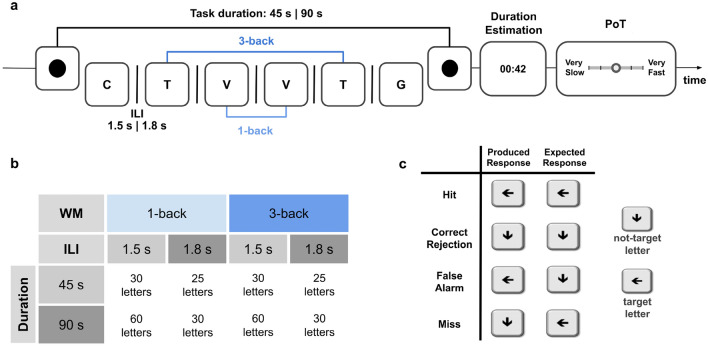
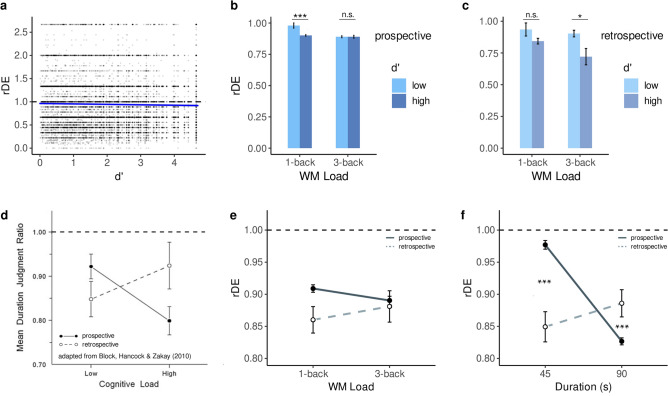
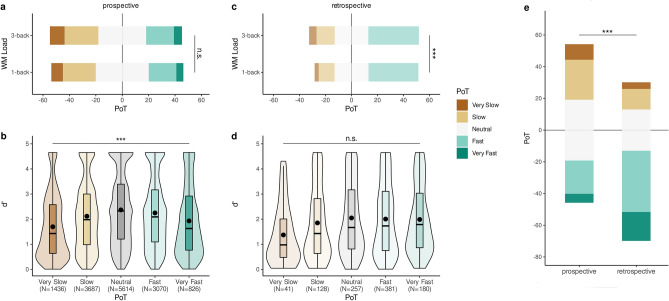
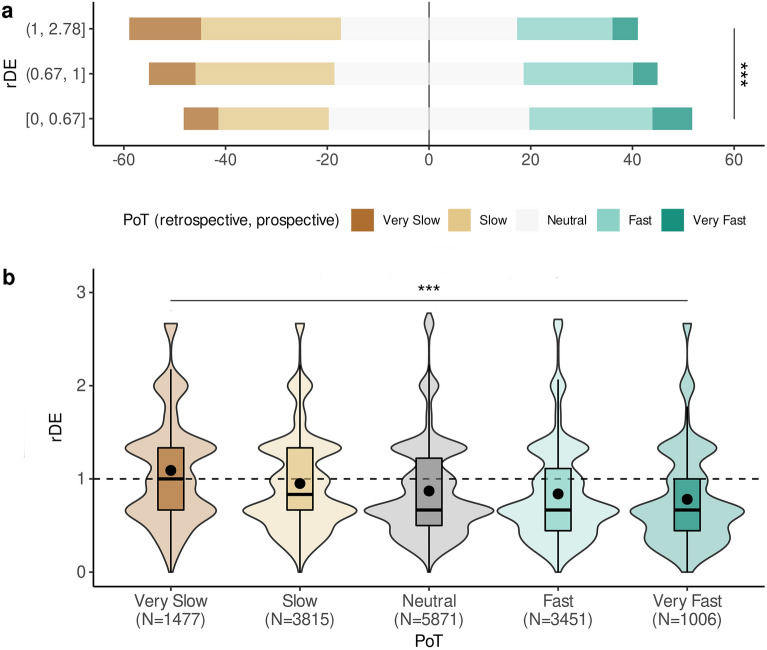
Psychological time is influenced by multiple factors such as arousal, emotion, attention and memory. While laboratory observations are well documented, it remains unclear whether cognitive effects on time perception replicate in real-life settings. This study exploits a set of data collected online during the Covid-19 pandemic, where participants completed a verbal working memory (WM) task in which their cognitive load was manipulated using a parametric n-back (1-back, 3-back). At the end of every WM trial, participants estimated the duration of that trial and rated the speed at which they perceived time was passing. In this within-participant design, we initially tested whether the amount of information stored in WM affected time perception in opposite directions depending on whether duration was estimated prospectively (i.e., when participants attend to time) or retrospectively (i.e., when participants do not attend to time). Second, we tested the same working hypothesis for the felt passage of time, which may capture a distinct phenomenology. Third, we examined the link between duration and speed of time, and found that short durations tended to be perceived as fast. Last, we contrasted two groups of individuals tested in and out of lockdown to evaluate the impact of social isolation. We show that duration and speed estimations were differentially affected by social isolation. We discuss and conclude on the influence of cognitive load on various experiences of time.


Conflict of interest statement

The authors declare no competing interests.

Figures

Figure 1
Figure 1
Experimental design. (a) A trial of the n-back WM task started with the presentation of a dot on the screen followed by the task instructions. The sequence of letters was presented sequentially and participants performed a 1-back (light blue) or a 3-back (dark blue) WM task. A sequence could last 45 s or 90 s. The inter-letter-interval (ILI) could be 1.5 s or 1.8 s. The WM trial ended with the presentation of a dot. Following the n-back trial, participants were prompted with the duration estimation asking them to estimate the elapsed time between the two dots in minutes: seconds (e.g., 00:42). After the duration estimation, participants were asked to rate their experienced speed of passage of time (PoT) using a five steps Likert scale ranging from “Very Slow” to “Very Fast”. (b) The within-participant factorial design WM task (2: 1-back, 3-back) x Duration (2: 45 s, 90 s) x ILI (2: 1.5 s, 1.8 s) is presented in panel b. (c) Participants provided an answer after each letter using the leftward arrow for “same” or the downward arrow for “different”. A forced response after each letter in the sequence allowed to quantify the full range of possible responses (Hits, Correct Rejections, Misses, and False Alarms) and assessing WM performance using Signal Detection Theory.
Figure 2
Figure 2
Performance in the n-back WM task. (ac) Violin plots report the sensitivity (d’) in WM task as a function of WM load (a), Duration (b) and ILI (c). All three factors significantly impacted sensitivity. (dg) Violin plots depict the bias (log(β)) as a function of WM load (d), Duration (e) and ILI (f). All three factors significantly impacted the bias. (gi) Violon plots report response times (RTs) as a function of WM load (g), Duration (h) and ILI (i). All three factors significantly affected RTs. Statistical model provided in Table 2. ***p < 0.001.
Figure 3
Figure 3
Relative duration estimates (rDE) as a function of performance in the WM task. (a) Relative duration estimates (rDE) in all trials (combining prospective and retrospective data) as a function of sensitivity (d’). Statistical model provided in Table 3. (b) To clarify the interaction effect in the prospective trials, we plotted the rDE in the 1-back and the 3-back WM task as a function of low and high d’ (below or above 1.5; light and dark blue, respectively). (c) To illustrate the interaction effect in the retrospective trials, we plotted the rDE in the 1-back and the 3-back WM task as a function of low and high d’ (below or above 1.5; light and dark blue, respectively). In prospective duration estimation, the high WM load increases underestimation for low d’. In retrospective duration estimation, high WM loads affect the high d’. In panels (b) and (c), we report the outcomes of a post-hoc Wilcoxon test. (d) Like in the original meta-analysis of Block et al. (2010), (e) retrospective and prospective durations were underestimated (i.e. a subjective-to-objective duration ratio below one). However, and unlike the meta-analysis, the within-participant design and a replicative statistical model (see ‘Methods’ section) failed to demonstrate the opposite effect of cognitive load on prospective and retrospective duration estimates. (f) Instead, we found that task duration showed a strong interaction with the directionality of duration estimation: prospective durations were even more underestimated with elapsing time, whereas retrospective durations tended to be less so. Statistical model provided in Table 3. *p < 0.05; ***p < 0.001; n.s.: non-significant.
Figure 4
Figure 4
Prospective and Retrospective Speed of the Passage of Time (PoT). Prospective (a,b) and retrospective (c,d) PoT following 1-back and 3-back working memory tasks. Ratings were reported on a Likert Scale as Very Slow (brown) to Very Fast (green). (a) Prospective PoT were not significantly impacted by the WM Load. (b) Prospective PoT were significantly affected by the d’ irrespective of the working memory load. (c) Retrospective PoT were significantly affected by the WM load. (d) Retrospective PoT were significantly affected by the d’ irrespective of working memory load. (e) Overall, the speed of the experienced passage of time in prospective tasks were rated as significantly slower than in the retrospective tasks. Statistical models reported in Table 4. *p < 0.05, **p < 0.01, ***p < 0.001.
Figure 5
Figure 5
Relation between duration estimation and passage of time ratings. Each n-back trial was associated with a duration estimate (rDE) and a PoT. Retrospective and prospective durations were pulled together. (a) Proportion of PoT ratings for each rDE tertile. By setting the 0 of the x-axis on the “Neutral” answer in PoT, diverging stacked bar allow to see whether participants tended to rate the passage of time as slow or fast according to the rDE tertile (1st = [0, 0.667], 2nd = (0.667, 1], 3rd = (1, 2.78]). As predicted, the slower the PoT (dark brown, top row), the longer the rDE (3rd tercile, top row), and the faster the PoT (dark green, bottom row), the shorter the rDE (1st tercile, bottom row). (b) The distribution of each PoT as a function of rDE. rDE = 1 is the veridical estimate. Statistical model reported in Table 4. ***p < 0.001.
Figure 6
Figure 6
Effect of lockdown on time perception under controlled cognitive load. (a) Violin plots showing the distribution of the rDE during the Lockdown session and during the Control session (dark and light gray, respectively). Overall, when participants were performing a working memory task, durations tended to be underestimated during lockdown as compared to outside of it. (b) A diverging stacked bar shows the proportion for PoT during Lockdown (left) and in the Control session (right). Overall, participants performing a 3-back tasks estimated time to go slower during lockdown than outside of it. Statistical model provided in Table 3 and 4. *p < 0.05; ***p < 0.001.

Similar articles

Cited by

References

    1. Holman EA, Grisham EL. When time falls apart: The public health implications of distorted time perception in the age of COVID-19. Psychol. Trauma Theory Res. Pract. Policy. 2020;12:S63. doi: 10.1037/tra0000756. - DOI - PubMed
    1. Chaumon M, et al. The Blursday database as a resource to study subjective temporalities during COVID-19 Nat. Nat. Hum. Behav. 2022;2(1):13. - PubMed
    1. Hicks, R. E. Prospective and retrospective judgments of time: A neurobehavioral analysis. in Time, action and cognition 97–108 (Springer, 1992).
    1. Hicks RE, Miller GW, Kinsbourne M. Prospective and retrospective judgments of time as a function of amount of information processed. Am. J. Psychol. 1976;12:719–730. doi: 10.2307/1421469. - DOI - PubMed
    1. Balci, F., Meck, W. H., Moore, H. & Brunner, D. Timing deficits in aging and neuropathology. in Animal Models of Human Cognitive Aging 1–41 (Springer, 2009).