. 2024 Jan 23;14(1):53.
doi: 10.1038/s41398-024-02740-2.

Schizophrenia endothelial cells exhibit higher permeability and altered angiogenesis patterns in patient-derived organoids

Affiliations

Schizophrenia endothelial cells exhibit higher permeability and altered angiogenesis patterns in patient-derived organoids

Isidora Stankovic et al. Transl Psychiatry. .

Abstract

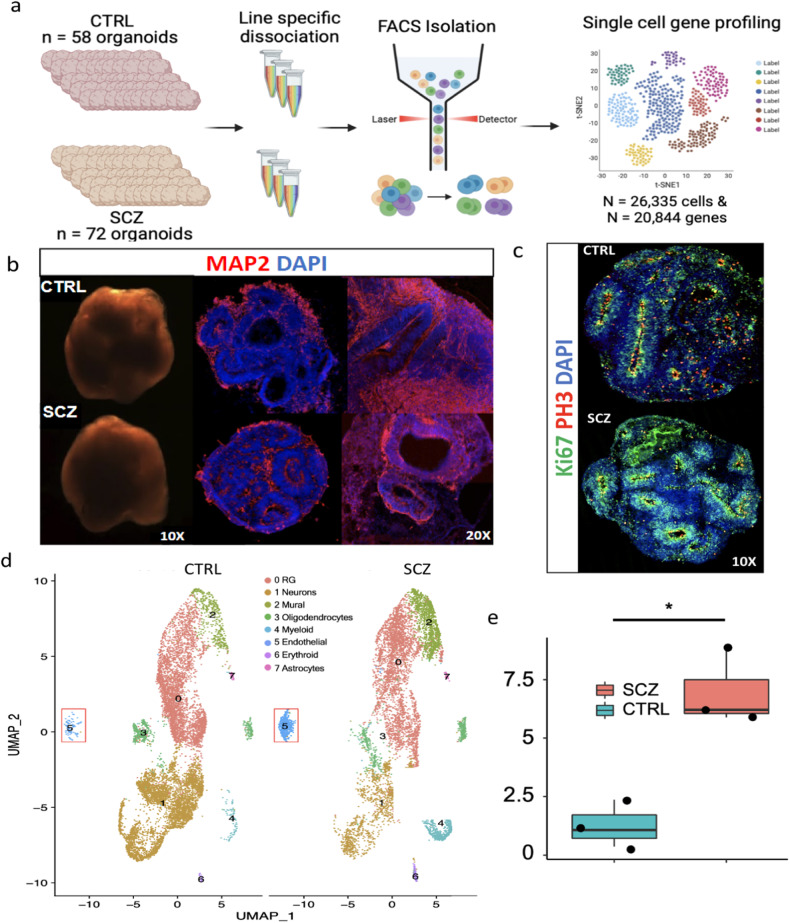
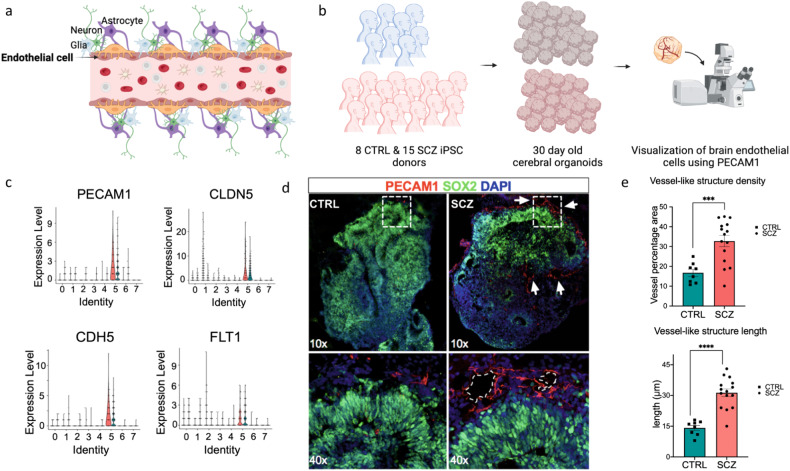
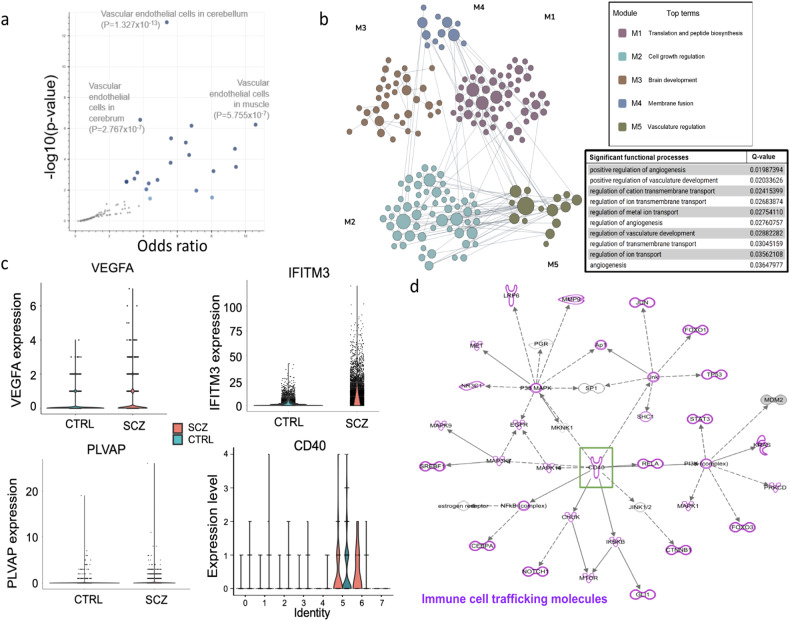
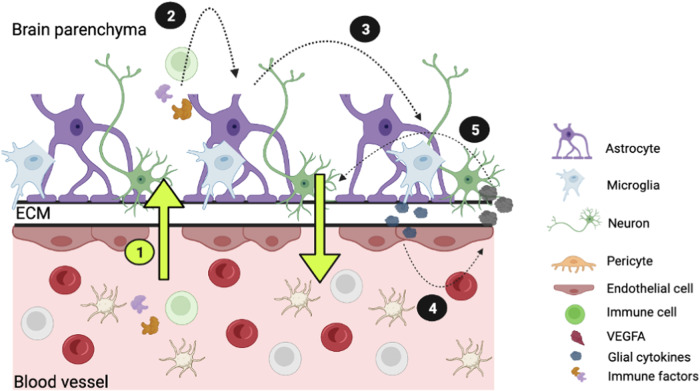
Schizophrenia (SCZ) is a complex neurodevelopmental disorder characterized by the manifestation of psychiatric symptoms in early adulthood. While many research avenues into the origins of SCZ during brain development have been explored, the contribution of endothelial/vascular dysfunction to the disease remains largely elusive. To model the neuropathology of SCZ during early critical periods of brain development, we utilized patient-derived induced pluripotent stem cells (iPSCs) to generate 3D cerebral organoids and define cell-specific signatures of disease. Single-cell RNA sequencing revealed that while SCZ organoids were similar in their macromolecular diversity to organoids generated from healthy controls (CTRL), SCZ organoids exhibited a higher percentage of endothelial cells when normalized to total cell numbers. Additionally, when compared to CTRL, differential gene expression analysis revealed a significant enrichment in genes that function in vessel formation, vascular regulation, and inflammatory response in SCZ endothelial cells. In line with these findings, data from 23 donors demonstrated that PECAM1+ microvascular vessel-like structures were increased in length and number in SCZ organoids in comparison to CTRL organoids. Furthermore, we report that patient-derived endothelial cells displayed higher paracellular permeability, implicating elevated vascular activity. Collectively, our data identified altered gene expression patterns, vessel-like structural changes, and enhanced permeability of endothelial cells in patient-derived models of SCZ. Hence, brain microvascular cells could play a role in the etiology of SCZ by modulating the permeability of the developing blood brain barrier (BBB).


Conflict of interest statement

The authors declare no competing interest.

Figures

Fig. 1
Fig. 1. Single-cell RNA sequencing reveals that cerebral organoids recapitulate developing neurovascular unit.
a Pipeline for performing scRNA-seq from brain organoids. Briefly, organoids from 3 CTRL and 3 SCZ lines were generated, pooled by line, and dissociated to a single-cell suspension. Samples were purified to 2000 live cells/µm per line and post-FACS cell viability was confirmed using Countess-II (See Supplementary Tables 1–3 for details about the donors and cell lines). Live cell suspensions were next rapidly loaded into 10x chromium microfluidic devices to produce barcoded single-cell nanodroplet emulsions. This emulsion was broken, barcoded samples were library prepared, Illumina sequenced, and analyzed. b Representative light microscopy images of 30 days in vitro (DIV) CTRL and SCZ organoids (left). Representative images of CTRL and SCZ organoids immunostained for neuronal marker MAP2 (red) and nuclear marker DAPI (blue). c Representative images of immunostainings for Ki67 (green) and PH3 (red) displays that CTRL and SCZ brain organoids recapitulate proliferative zones at 30 DIV. d UMAP coordinates for 26,335 transcriptomes split by CTRL and SCZ cases, presenting the cell-type clusters identified in unbiased clustering analysis. Unbiased gene sets were defined by the top 10 gene markers for each cluster that met a high-pass FDR threshold of 1% and >15,000 total read counts. Cell-type labels were determined via a variety of approaches including marker gene-expression, automated annotation, and comparison with human fetal samples (see “Materials and methods“ for further details). Endothelial cell clusters are denoted by a red square. e Bar graph depicting a significant difference in endothelial cell number (cluster 5) between CTRL and SCZ organoids. Each point on the graph represents an independent cell line. *p < 0.05. Error bars reflect Standard Error of the Mean.
Fig. 2
Fig. 2. Endothelial cells and microvascular vessel-like structures are increased in SCZ brain organoids.
a Schematic of neurovascular unit comprising various brain cell types. Endothelial cells, which are highlighted, line the blood vessels, and interact with the surrounding cells. b Schematic of the pipeline to image endothelial cells and microvascular vessel-like structures in organoids. In total, n = 23 distinct iPSC lines (8 CTRL, 15 SCZ) were used to generate organoids to visualize and quantify endothelial cells. c Violin plots depicting gene expression profiles for known endothelial genes across each cell population cluster and by conditions: PECAM1 (adhesion), CLDN5 (tight junction regulation), CDH5 (proliferation of ECs), FLT1 (tight junction regulation), plotted for each of the seven clusters. d Representative images of PECAM1 immunostainings in CTRL and SCZ organoids depicting microvascular vessel-like structures. Neural progenitors were labeled using SOX2 antibody and nuclei using DAPI. Squares and arrows highlight microvascular vessel-like structures in both conditions. e Quantifications revealed significant differences in the lengths as well as densities of vessel-like structures between CTRL and SCZ organoids. Each point in the bar graphs represent an independent line. For the measurements of density, briefly, raw images were 16 bit converted and skeletonized, and vessels were counted and normalized per organoid area. A minimum of 5 organoids were counted per line. For the measurements of density, briefly, raw images were 16 bit converted and skeletonized - a vessel like structure was counted as a singular branch longer than 1 µm (see Supplementary Fig. 2 for data split by line). ***p < 0.001 and ****p < 0.0001. Error bars reflect Standard Error of the Mean.
Fig. 3
Fig. 3. Endothelial cells of SCZ patient-derived brain organoids exhibit changes in angiogenic pathways and cell cycle regulation.
a Gene Ontology (GO) analysis for biological function displaying the top categories represented differentially expressed genes (DEGs) of SCZ endothelial cells; odds ratio as observed between SCZ and CTRLs (see Supplementary Table 4 for the list of DEGs). b GO analysis for molecular function displaying the top categories represented in SCZ endothelial DEGs. c GO analysis for cellular components displaying the top categories differentially expressed in SCZ endothelial DEGs. d Ingenuity Pathway Analysis displaying the top most represented signaling pathways in SCZ endothelial cells compared to CTRL. e Top transcription factors listed with significance p-values predicted to co-occur with SCZ endothelial DEGs.
Fig. 4
Fig. 4. Endothelial cells in SCZ brain organoids exhibit transcriptional changes linked to CD40 regulation.
a Volcano plot of terms from the DESCARTES Cell types and Tissue 2021 library gene set. Each point represents a single term, plotted by the corresponding odds ratio (x-position) and −log10(p-value) (y-position) from the enrichment results of the input query gene set. The larger and darker-colored the point, the more significantly enriched the input gene set is for the term. b Brain-specific functional module prediction for DEGs detected in the endothelial population of SCZ samples. The significant functional processes in module 5 related to vasculature regulation are highlighted along with their corresponding Q-values. c Violin plot of VEGF-A, IFITM3, PLVAP expressions in cluster 5 of scRNA-seq showing differences in expression in CTRL and SCZ. Violin plot for CD40 showing gene expression in cell clusters 0-7 (x-position) in both CTRL and SCZ samples. d IPA-Causal networks analysis predicted CD40 as a top regulator amongst the endothelial population enrichment in SCZ samples. Green square highlights CD40 in the center of causal network analysis. Purple highlights immune cells trafficking molecules known to interact with CD40.
Fig. 5
Fig. 5. SCZ patient-derived endothelial cells exhibit increased permeability.
a Schematic of induced brain microvascular endothelial cell (iBMEC) differentiation from iPSCs (See Supplementary Tables 2 and 3 for details about the donors and cell lines used in each experiment). For further details on differentiation see “Materials and methods”. b On day 12 of differentiation cells are labeled for CDH5, PECAM1 and sorted using flow cytometry to isolate a pure population of iBMECs. Representative flow cytometry plots of CTRL and SCZ iBMECs sorted for PECAM1 and CDH5 (top), and light microscopy images of CTRL and SCZ iBMECs after sorting (bottom, scale bar = 200 µm). c Light microscopy images of CTRL and SCZ iBMECs after day 26 of differentiation at ×10 magnification, preceding dextran permeability assay. d Schematic depicting the workflow of FITC-dextran assay to measure paracellular permeability of cultured iBMECs. FITC-dextran was added to the Transwells for 6 h. At the end of 6 h of treatment, the fluorescence intensity of the medium in the lower compartments was measured to assess paracellular permeability. Because the FITC-dextran is 70 kDA, it cannot get passively transported through the cells but can only pass through the Transwells if intercellular junction permeability is altered. e Graph depicting quantifications of FITC-dextran fluorescence permeability assay. Each dot represents a distinct donor line used in the experiment, n = 3 lines per group (See Supplementary Fig. 2c for data split analysis by line), **p < 0.01. Error bars reflect Standard Error of the Mean.
Fig. 6
Fig. 6. Proposed model of altered paracellular permeability of BMECs and the downstream inflammation response in SCZ.
1 Genetic factors contribute to endothelial junction changes resulting in altered paracellular permeability that allows proinflammatory cytokines to traverse into the parenchyma. Neon green highlight denotes that this is the part of the pathway in which we observe the most changes in our SCZ organoid and 2D iPSC systems. 2 Once in the parenchyma these inflammatory molecules activate astrocytes and microglia. 3 Astrocytic and microglial activation results in the release of additional proinflammatory cytokines that can traverse the vessels and parenchyma borders. 4 These proinflammatory cytokines will result in a feedback-loop activation of BMECs which will release BMEC specific cytokines. 5 Cytokines released by BMECs further recruit other cells (neutrophils, T cells, B cells) and alter adhesion molecules that contribute to vessel permeability seen in SCZ. The current study has specifically focused on endothelial cell alterations that could possibly contribute to the BBB/NVU pathology hypothesis of SCZ. Brain organoid protocols that recapitulate pericytes and microglia are yet to be developed. 2D cultures of induced BMECs lack the complexity of the multicellular nature of the BBB. Our initial characterization of SCZ iBMEC phenotypes should be expanded to characterize SCZ BBB dysfunction using the 3D models of BBB such as human BBB-Chip with iPSC-derived BMECs, iPSC-derived astrocytes, and iPSC-derived neurons.

References

    1. Kopylov AT, Stepanov AA, Butkova TV, Malsagova KA, Zakharova NV, Kostyuk GP, et al. Consolidation of metabolomic, proteomic, and GWAS data in connective model of schizophrenia. Sci Rep. 2023;13:2139. doi: 10.1038/s41598-023-29117-7. - DOI - PMC - PubMed
    1. McCutcheon RA, Reis Marques T, Howes OD. Schizophrenia-an overview. JAMA Psychiatry. 2020;77:201–10. doi: 10.1001/jamapsychiatry.2019.3360. - DOI - PubMed
    1. Thompson PM, Vidal C, Giedd JN, Gochman P, Blumenthal J, Nicolson R, et al. Mapping adolescent brain change reveals dynamic wave of accelerated gray matter loss in very early-onset schizophrenia. Proc Nat Acad Sci USA. 2001;98:11650–5. doi: 10.1073/pnas.201243998. - DOI - PMC - PubMed
    1. Knuesel I, Chicha L, Britschgi M, Schobel SA, Bodmer M, Hellings JA, et al. Maternal immune activation and abnormal brain development across CNS disorders. Nat Rev Neurol. 2014;10:643. doi: 10.1038/nrneurol.2014.187. - DOI - PubMed
    1. Saiga R, Uesugi M, Takeuchi A, Uesugi K, Suzuki Y, Takekoshi S, et al. Brain capillary structures of schizophrenia cases and controls show a correlation with their neuron structures. Sci Rep. 2021;11:11768. doi: 10.1038/s41598-021-91233-z. - DOI - PMC - PubMed