. 2024 Jan 23;11(1):115.
doi: 10.1038/s41597-023-02421-7.

Efficacy of MRI data harmonization in the age of machine learning: a multicenter study across 36 datasets

Affiliations

Efficacy of MRI data harmonization in the age of machine learning: a multicenter study across 36 datasets

Chiara Marzi et al. Sci Data. .

Abstract

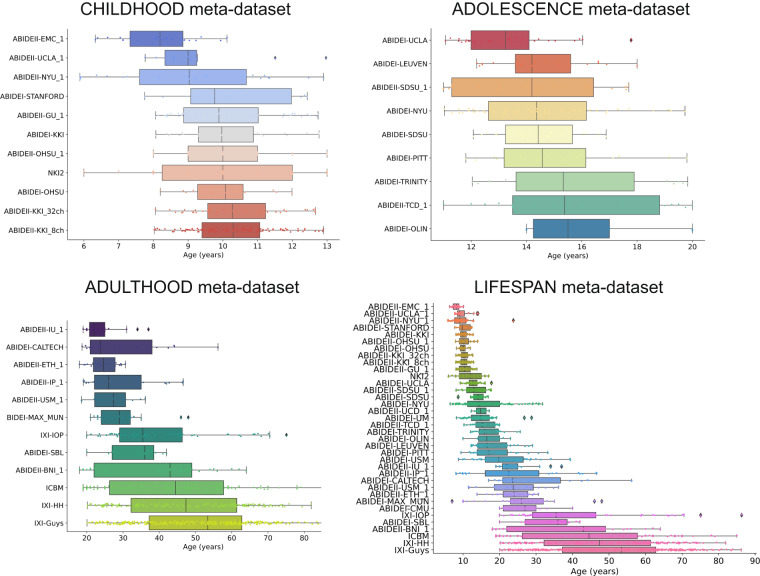
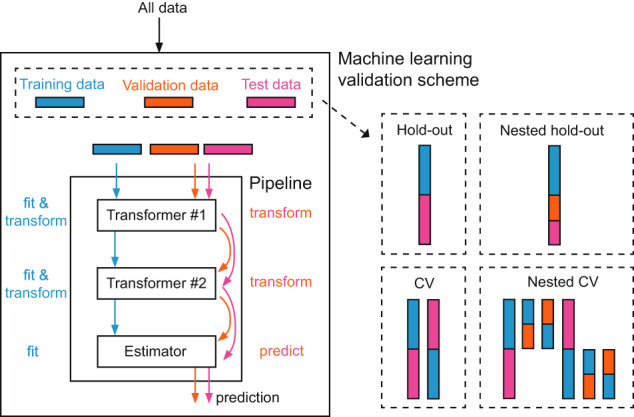
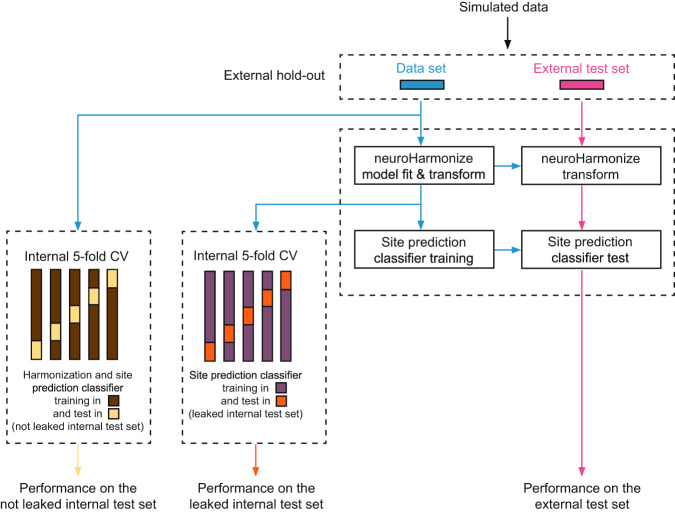
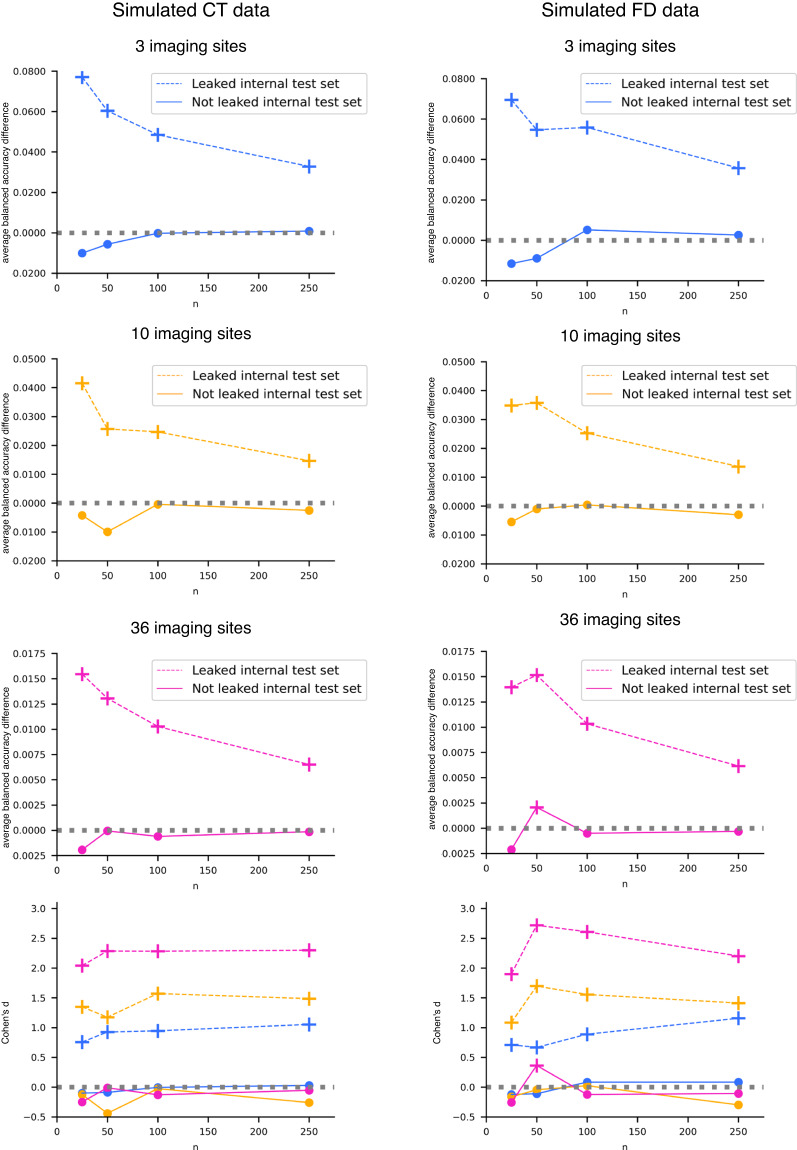
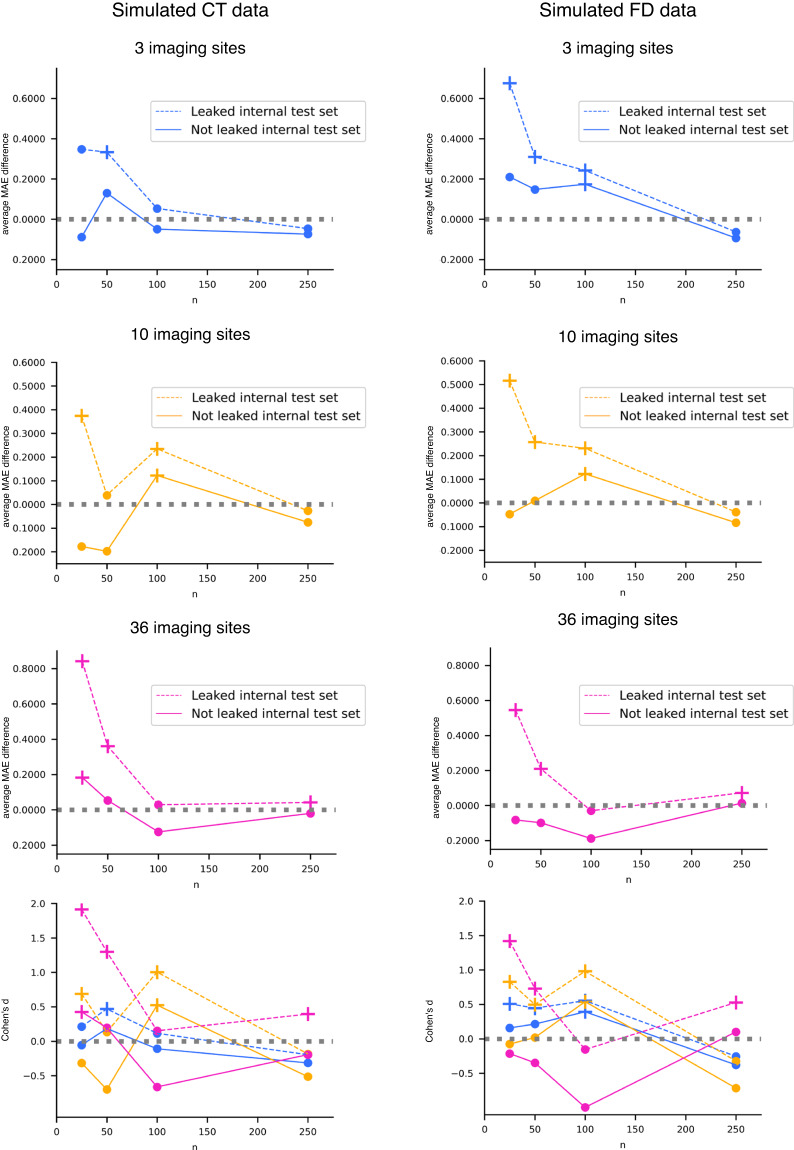
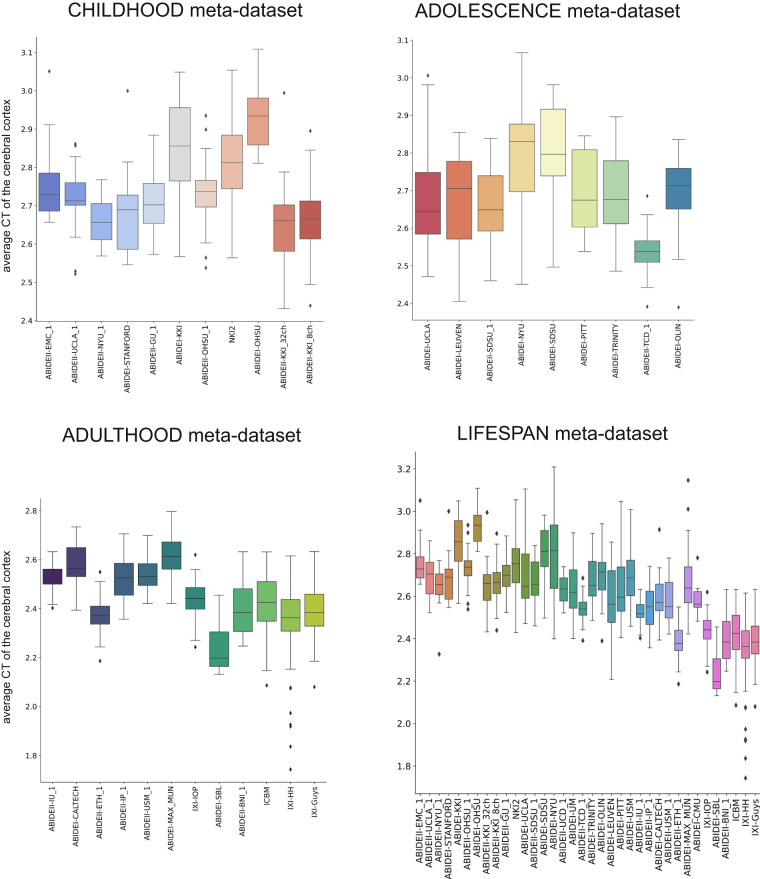
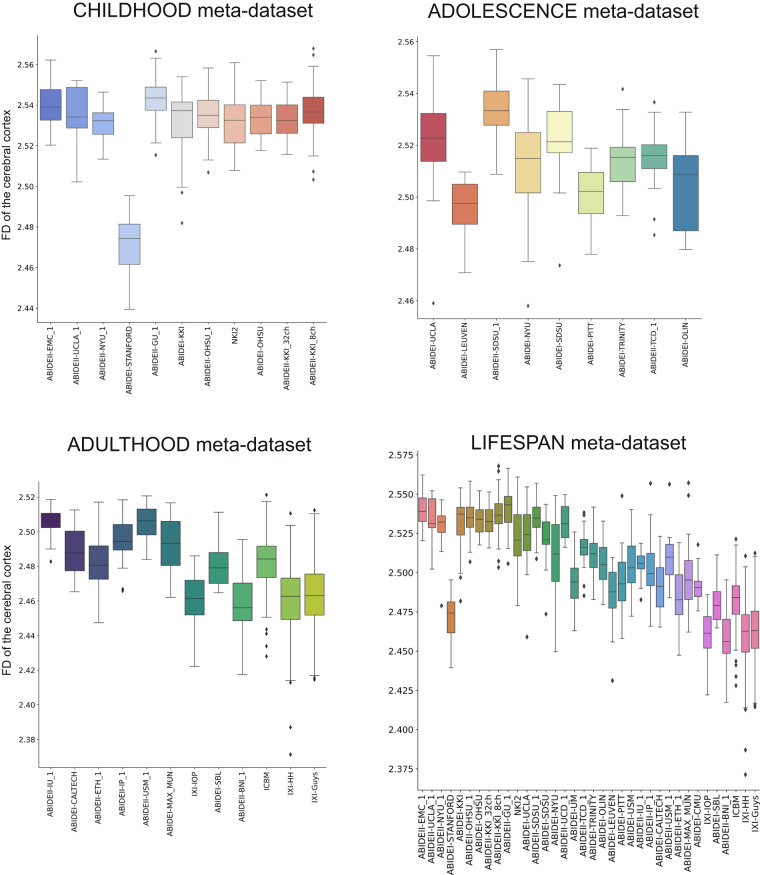
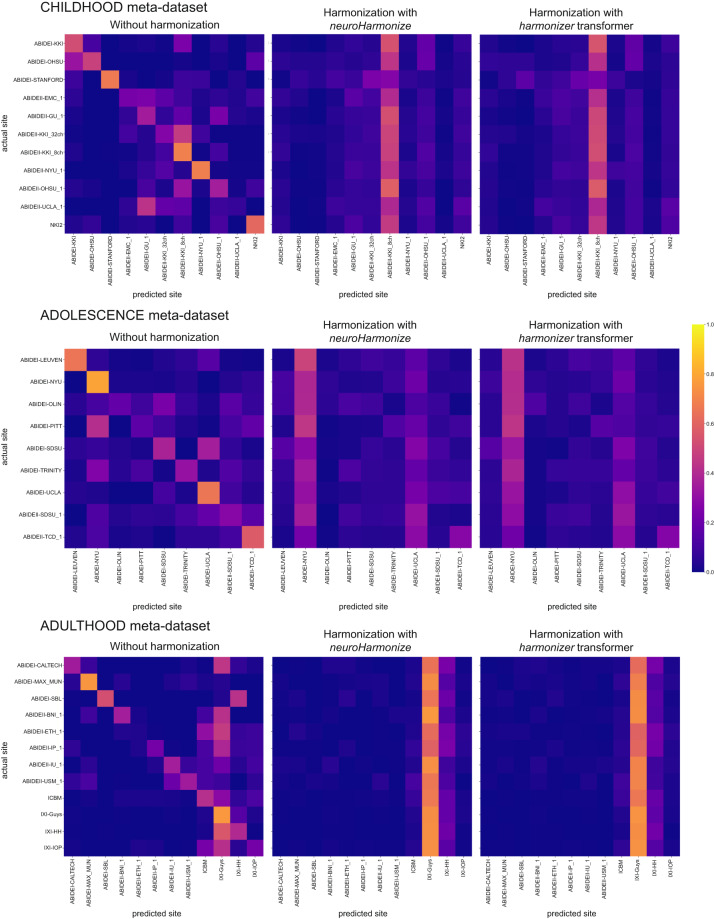
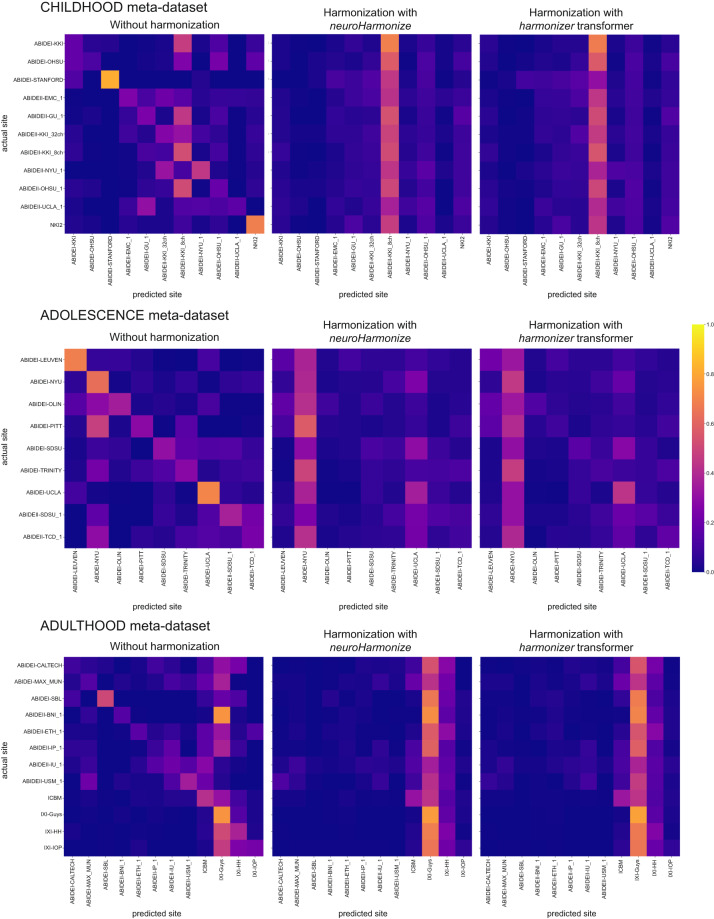
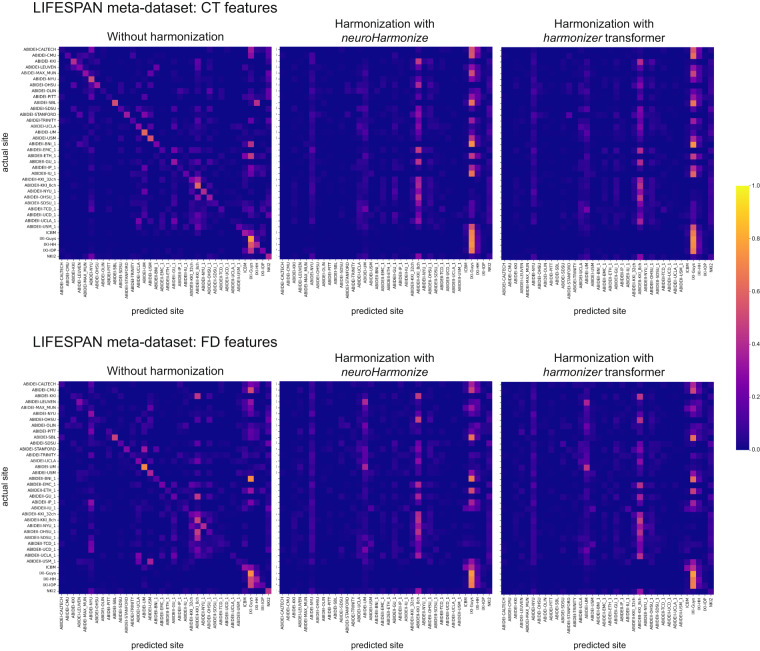
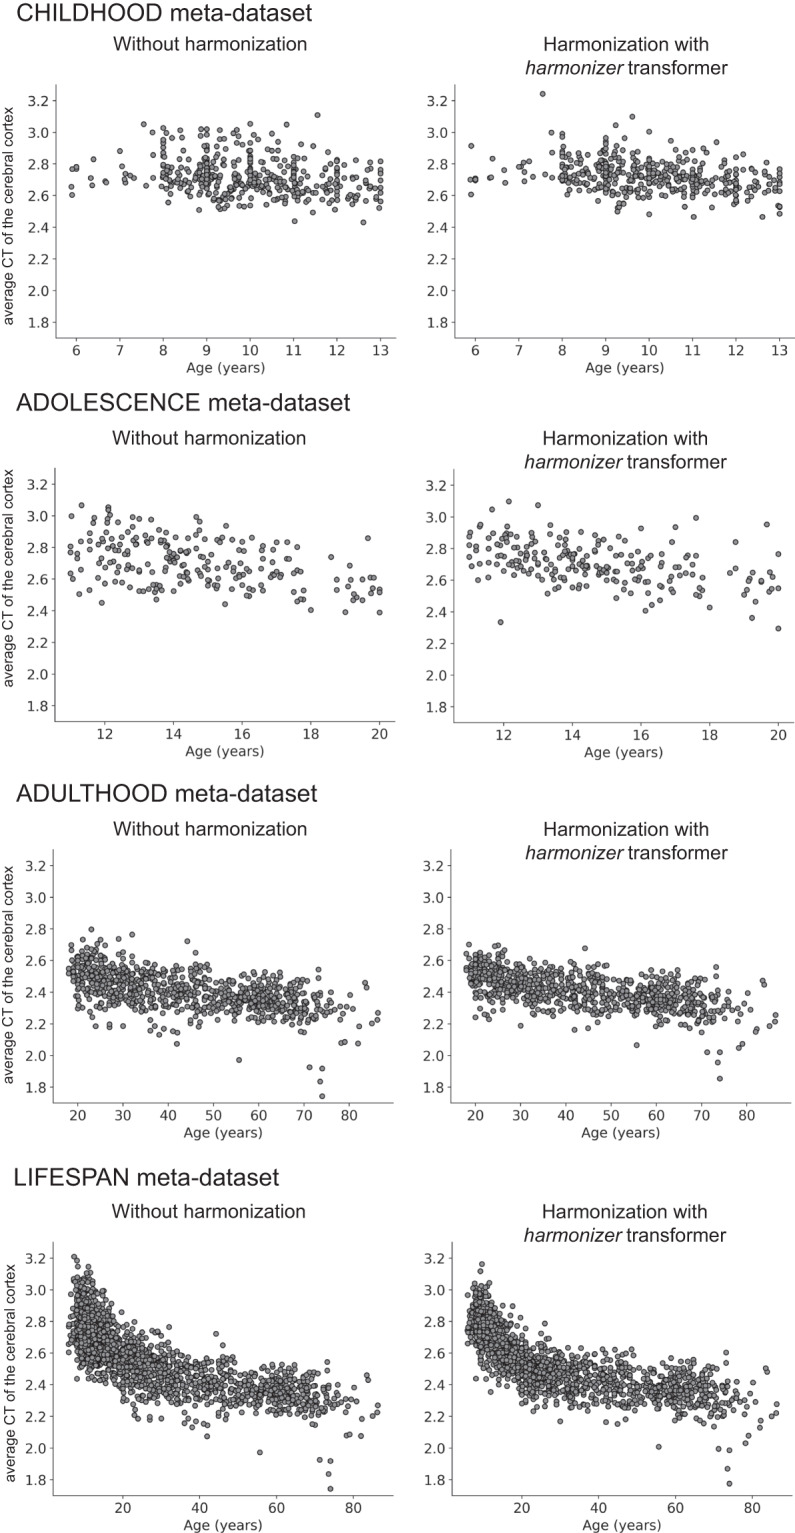
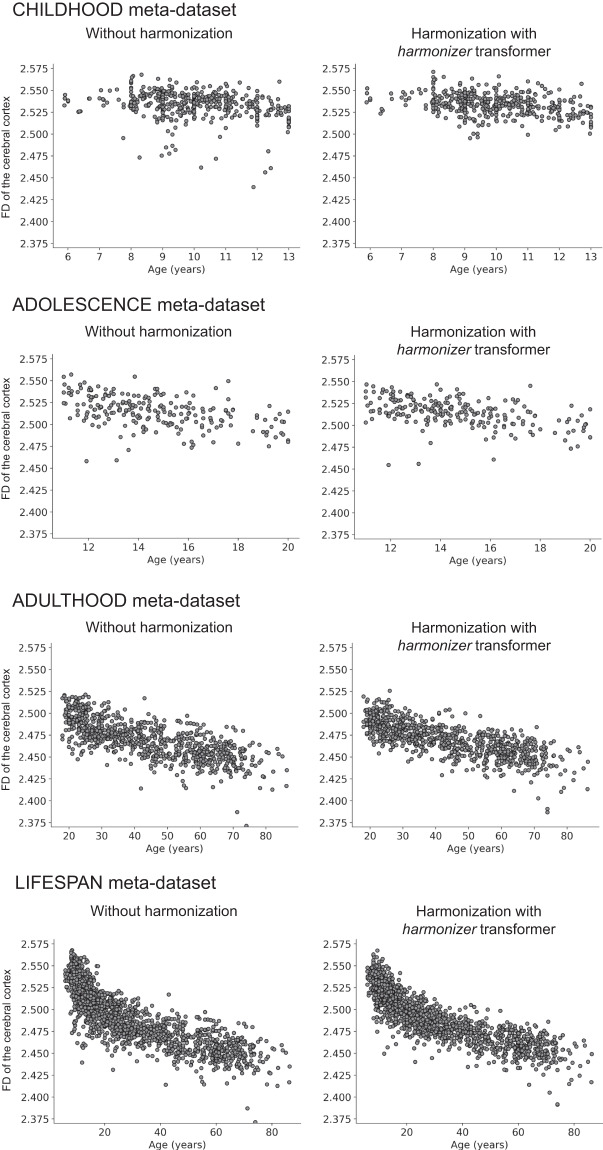
Pooling publicly-available MRI data from multiple sites allows to assemble extensive groups of subjects, increase statistical power, and promote data reuse with machine learning techniques. The harmonization of multicenter data is necessary to reduce the confounding effect associated with non-biological sources of variability in the data. However, when applied to the entire dataset before machine learning, the harmonization leads to data leakage, because information outside the training set may affect model building, and potentially falsely overestimate performance. We propose a 1) measurement of the efficacy of data harmonization; 2) harmonizer transformer, i.e., an implementation of the ComBat harmonization allowing its encapsulation among the preprocessing steps of a machine learning pipeline, avoiding data leakage by design. We tested these tools using brain T1-weighted MRI data from 1740 healthy subjects acquired at 36 sites. After harmonization, the site effect was removed or reduced, and we showed the data leakage effect in predicting individual age from MRI data, highlighting that introducing the harmonizer transformer into a machine learning pipeline allows for avoiding data leakage by design.


Conflict of interest statement

The authors declare no competing interests.

Figures

Fig. 1
Fig. 1
Age distributions. Age distributions of participants for CHILDHOOD, ADOLESCENCE, ADULTHOOD, and LIFESPAN meta-datasets, grouped by single-center dataset and sorted by median age.
Fig. 2
Fig. 2
3D box-counting for computation of the FD. An example of the 3D box-counting algorithm that uses an automated selection of the fractal scaling window through the fractalbrain toolkit. N(s) is the average number of 3D cubes of side s needed to fully enclose the brain structure computed using 20 uniformly distributed random offsets to the grid origin. The regression line within the optimal fractal scaling window, whose slope (sign changed) is the FD, is depicted in red.
Fig. 3
Fig. 3
Machine learning pipeline. A pipeline represents the entire data workflow, combining all transformation steps and machine learning model training. It is essential to automate an end-to-end training/test process without any form of data leakage and improve reproducibility, ease of deployment, and code reuse, especially when complex validation schemes are needed.
Fig. 4
Fig. 4
Overview of the analysis of simulated data for each experiment. After an external hold-out, we computed the performance of a site prediction classifier trained using (a) the harmonizer transformer within the machine learning pipeline (internal not leaked test set) and (b) harmonizing all data with neuroHarmonize before imaging site/age prediction (internal leaked test set). Secondly, we compared these performances with that observed on an external test set never used for harmonization and training.
Fig. 5
Fig. 5
Imaging site prediction results with CT and FD simulated data. We reported the difference between the average balanced accuracy obtained in the external test set and that gained in the internal test sets (dotted line for leaked internal test set and solid line for not leaked internal test set) and Cohen’s d effect size vs. the number of participants per single-center dataset n. The cross marker indicates a significant difference between balanced accuracy distributions (one-tailed paired t-test Bonferroni adjusted p-value < 10−9 and < 10−10 for CT and FD, respectively). The colors and line types in Cohen’s d plots are consistent with those employed in the other plots.
Fig. 6
Fig. 6
Age prediction results with CT and FD simulated data. We reported the difference between the average MAE obtained in the external test set and that gained in the internal test sets (dotted line for leaked internal test set and solid line for not leaked internal test set) and Cohen’s d effect size vs. the number of participants per single-center dataset n. The cross marker indicates a significant difference between balanced accuracy distributions (see Tables 5, 6 for details). The colors and line types in Cohen’s d plots are consistent with those employed in the other plots.
Fig. 7
Fig. 7
Boxplot of the average CT of the cerebral cortex. The boxplots of the average CT of the cerebral cortex without harmonization are shown for the CHILDHOOD, ADOLESCENCE, ADULTHOOD, and LIFESPAN meta-datasets.
Fig. 8
Fig. 8
Boxplot of the average FD of the cerebral cortex. The boxplots of the FD of the cerebral cortex without harmonization are shown for the CHILDHOOD, ADOLESCENCE, ADULTHOOD, and LIFESPAN meta-datasets.
Fig. 9
Fig. 9
Confusion matrices of site prediction using CT features. Each confusion matrix was normalized for the number of subjects belonging to each site. In this way, the sum of the matrix cells of each row gives 1. The confusion matrix obtained using the harmonizer within the machine learning pipeline seems similar to that obtained by harmonizing all the data with neuroHarmonize before imaging site prediction, even though the model is built on training data only and then applied to test data.
Fig. 10
Fig. 10
Confusion matrices of site prediction using FD features. Each confusion matrix was normalized for the number of subjects belonging to each site. In this way, the sum of the matrix cells of each row gives 1. The confusion matrix obtained using the harmonizer within the machine learning pipeline seems similar to that obtained by harmonizing all the data with neuroHarmonize before imaging site prediction, even though the model is built on training data only and then applied to test data.
Fig. 11
Fig. 11
Confusion matrices of site prediction using CT and FD features in the LIFESPAN meta-dataset. Each confusion matrix was normalized for the number of subjects belonging to each site. In this way, the sum of the matrix cells of each row gives 1. The confusion matrix obtained using the harmonizer within the machine learning pipeline seems similar to that obtained by harmonizing all the data with neuroHarmonize before imaging site prediction, even though the model is built on training data only and then applied to test data.
Fig. 12
Fig. 12
Scatterplot of the average CT of the cerebral cortex vs. age. The plot of the average CT of the cerebral cortex vs. age is shown for the CHILDHOOD, ADOLESCENCE, ADULTHOOD, and LIFESPAN meta-datasets without and with harmonization using the harmonizer transformer. In the latter case, we considered only the first CV among the 100 repetitions. Specifically, for each subject, we plotted the harmonized value obtained in the fold when the subject was included in the test set.
Fig. 13
Fig. 13
Scatterplot of the FD of the cerebral cortex vs. age. The plot of the FD of the cerebral cortex vs. age is shown for the CHILDHOOD, ADOLESCENCE, ADULTHOOD, and LIFESPAN meta-datasets without and with harmonization using the harmonizer transformer. In the latter case, we considered only the first CV among the 100 repetitions. Specifically, for each subject, we plotted the harmonized value obtained in the fold when the subject was included in the test set.

Similar articles

Cited by

References

    1. Alfaro-Almagro F, et al. Image processing and Quality Control for the first 10,000 brain imaging datasets from UK Biobank. NeuroImage. 2018;166:400–424. doi: 10.1016/j.neuroimage.2017.10.034. - DOI - PMC - PubMed
    1. Pomponio R, et al. Harmonization of large MRI datasets for the analysis of brain imaging patterns throughout the lifespan. NeuroImage. 2020;208:116450. doi: 10.1016/j.neuroimage.2019.116450. - DOI - PMC - PubMed
    1. Radua J, et al. Increased power by harmonizing structural MRI site differences with the ComBat batch adjustment method in ENIGMA. NeuroImage. 2020;218:116956. doi: 10.1016/j.neuroimage.2020.116956. - DOI - PMC - PubMed
    1. Thompson PM, et al. The ENIGMA Consortium: large-scale collaborative analyses of neuroimaging and genetic data. Brain Imaging Behav. 2014;8:153–182. doi: 10.1007/s11682-013-9269-5. - DOI - PMC - PubMed
    1. Fortin JP, et al. Harmonization of cortical thickness measurements across scanners and sites. NeuroImage. 2018;167:104–120. doi: 10.1016/j.neuroimage.2017.11.024. - DOI - PMC - PubMed