

A longitudinal field study of commercial honey bees shows that non-native probiotics do not rescue antibiotic treatment, and are generally not beneficial
- PMID: 38263184
- PMCID: PMC10806037
- DOI: 10.1038/s41598-024-52118-z
A longitudinal field study of commercial honey bees shows that non-native probiotics do not rescue antibiotic treatment, and are generally not beneficial
Abstract
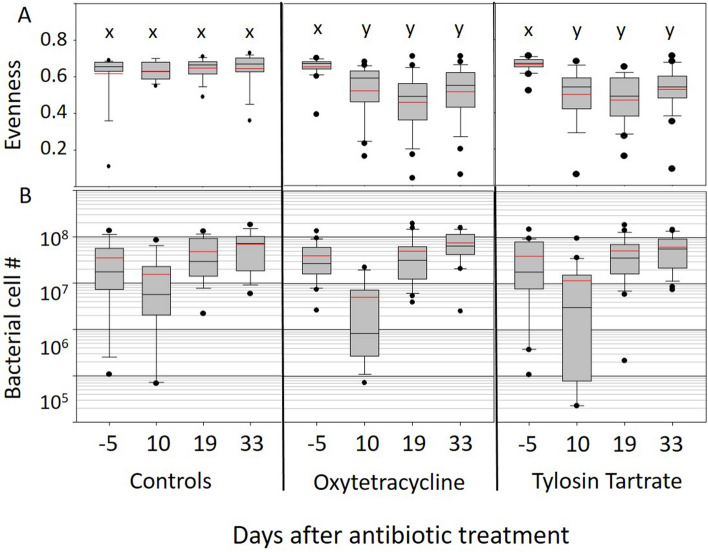
Probiotics are widely used in agriculture including commercial beekeeping, but there is little evidence supporting their effectiveness. Antibiotic treatments can greatly distort the gut microbiome, reducing its protective abilities and facilitating the growth of antibiotic resistant pathogens. Commercial beekeepers regularly apply antibiotics to combat bacterial infections, often followed by an application of non-native probiotics advertised to ease the impact of antibiotic-induced gut dysbiosis. We tested whether probiotics affect the gut microbiome or disease prevalence, or rescue the negative effects of antibiotic induced gut dysbiosis. We found no difference in the gut microbiome or disease markers by probiotic application or antibiotic recovery associated with probiotic treatment. A colony-level application of the antibiotics oxytetracycline and tylosin produced an immediate decrease in gut microbiome size, and over the longer-term, very different and persistent dysbiotic effects on the composition and membership of the hindgut microbiome. Our results demonstrate the lack of probiotic effect or antibiotic rescue, detail the duration and character of dysbiotic states resulting from different antibiotics, and highlight the importance of the gut microbiome for honeybee health.
© 2024. This is a U.S. Government work and not under copyright protection in the US; foreign copyright protection may apply.
Conflict of interest statement
The authors declare no competing interests.
Figures


Similar articles
-
Prospects of probiotics in beekeeping: a review for sustainable approach to boost honeybee health.Arch Microbiol. 2024 Apr 4;206(5):205. doi: 10.1007/s00203-024-03926-4. Arch Microbiol. 2024. PMID: 38573383 Review.
-
Field-Realistic Tylosin Exposure Impacts Honey Bee Microbiota and Pathogen Susceptibility, Which Is Ameliorated by Native Gut Probiotics.Microbiol Spectr. 2021 Sep 3;9(1):e0010321. doi: 10.1128/Spectrum.00103-21. Epub 2021 Jun 23. Microbiol Spectr. 2021. PMID: 34160267 Free PMC article.
-
Testing the Effectiveness of a Commercially Sold Probiotic on Restoring the Gut Microbiota of Honey Bees: a Field Study.Probiotics Antimicrob Proteins. 2025 Jun;17(3):991-1000. doi: 10.1007/s12602-023-10203-1. Epub 2023 Dec 19. Probiotics Antimicrob Proteins. 2025. PMID: 38112994 Free PMC article.
-
Honeybee Exposure to Veterinary Drugs: How Is the Gut Microbiota Affected?Microbiol Spectr. 2021 Sep 3;9(1):e0017621. doi: 10.1128/Spectrum.00176-21. Epub 2021 Aug 11. Microbiol Spectr. 2021. PMID: 34378962 Free PMC article.
-
Role of Honey Bee Gut Microbiota in the Control of American Foulbrood and European Foulbrood Diseases.Arch Razi Inst. 2022 Aug 31;77(4):1331-1339. doi: 10.22092/ARI.2022.358073.2146. eCollection 2022 Aug. Arch Razi Inst. 2022. PMID: 36883164 Free PMC article. Review.
Cited by
-
Genomic investigations of diverse corbiculate bee gut-associated Gilliamella reveal conserved pathways for energy metabolism, with diverse and variable energy sources.Access Microbiol. 2024 Aug 15;6(8):000793.v3. doi: 10.1099/acmi.0.000793.v3. eCollection 2024. Access Microbiol. 2024. PMID: 39148688 Free PMC article.
-
Enhancing Antioxidant and Antimicrobial Activities in Bee-Collected Pollen through Solid-State Fermentation: A Comparative Analysis of Bioactive Compounds.Antioxidants (Basel). 2024 Feb 27;13(3):292. doi: 10.3390/antiox13030292. Antioxidants (Basel). 2024. PMID: 38539826 Free PMC article.
-
Prospects of probiotics in beekeeping: a review for sustainable approach to boost honeybee health.Arch Microbiol. 2024 Apr 4;206(5):205. doi: 10.1007/s00203-024-03926-4. Arch Microbiol. 2024. PMID: 38573383 Review.
-
Antibiotic treatment of honey bee colonies alters early gut microbiome assembly and induces persistent dysbiosis in newly emerged workers.Sci Rep. 2025 Aug 8;15(1):29031. doi: 10.1038/s41598-025-12823-9. Sci Rep. 2025. PMID: 40781253 Free PMC article.
-
Image-based honey bee larval viral and bacterial diagnosis using machine learning.Sci Rep. 2025 Aug 21;15(1):30717. doi: 10.1038/s41598-025-16261-5. Sci Rep. 2025. PMID: 40841760 Free PMC article.
References
-
- Hachiro, S. & Knox, D. A. Diagnosis of honey bee diseases. Agric. Handb. Wash. (1991).
MeSH terms
Substances
Grants and funding
LinkOut - more resources
Full Text Sources
