. 2024 Jan 23;14(1):1986.
doi: 10.1038/s41598-024-52041-3.

In vivo identification of Drosophila rhodopsin interaction partners by biotin proximity labeling

Affiliations

In vivo identification of Drosophila rhodopsin interaction partners by biotin proximity labeling

Nilofar Feizy et al. Sci Rep. .

Abstract

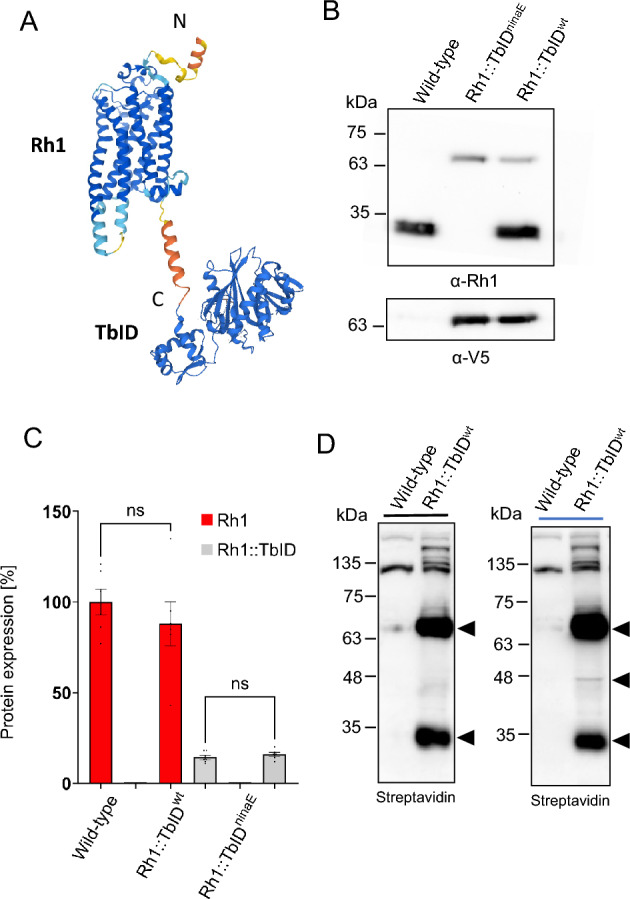
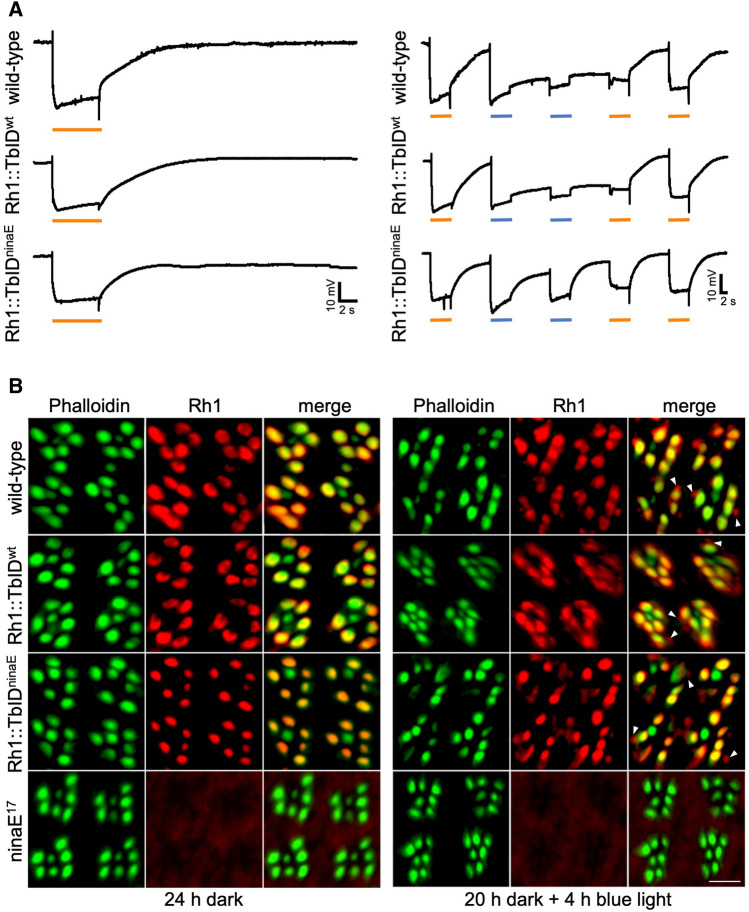
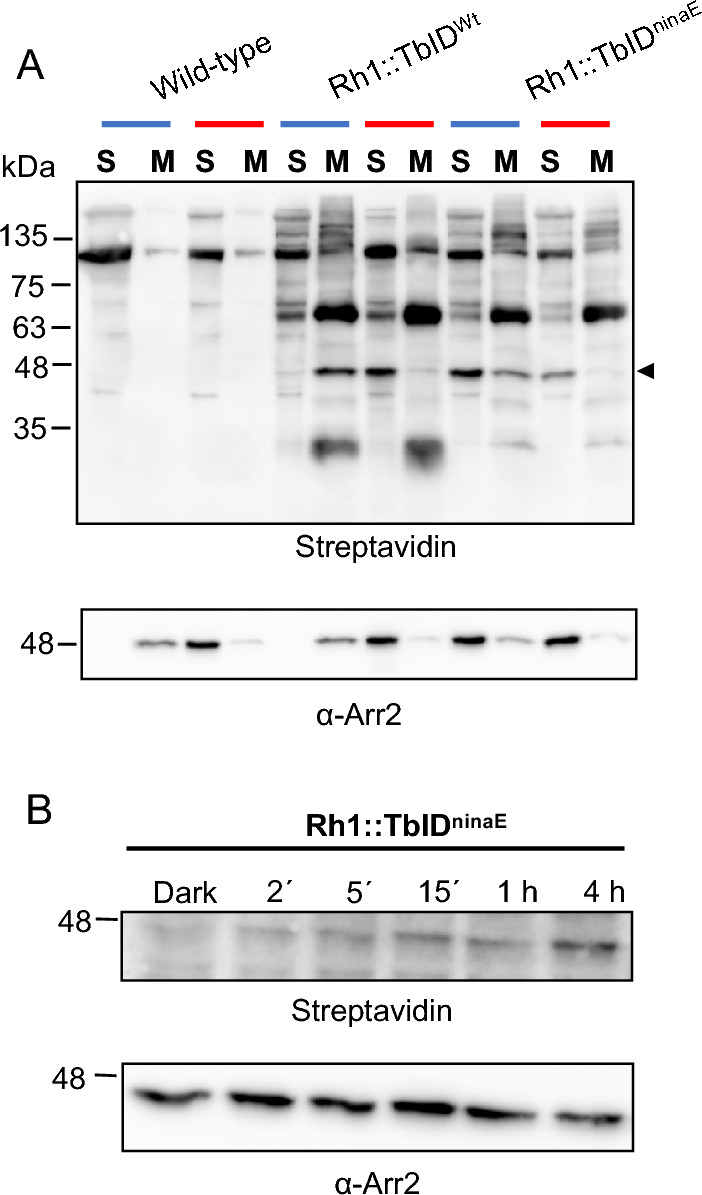
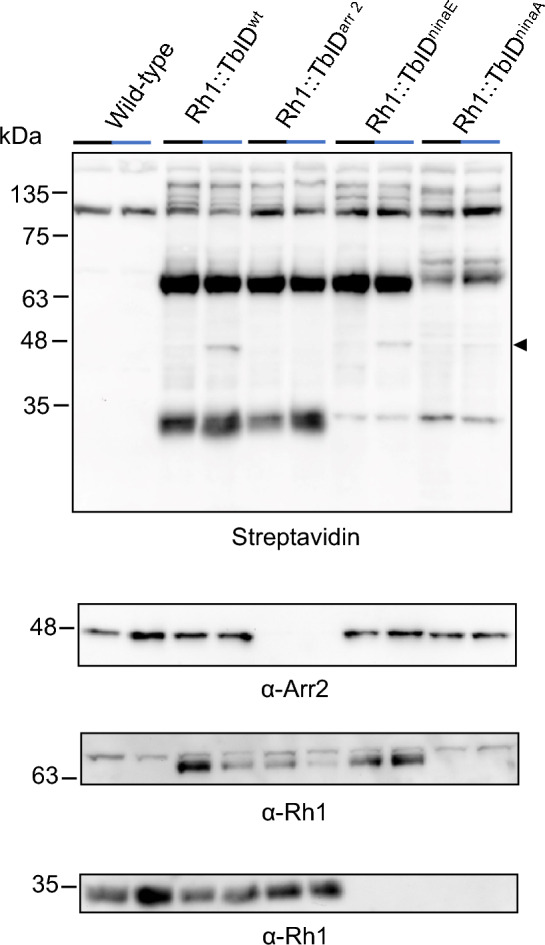
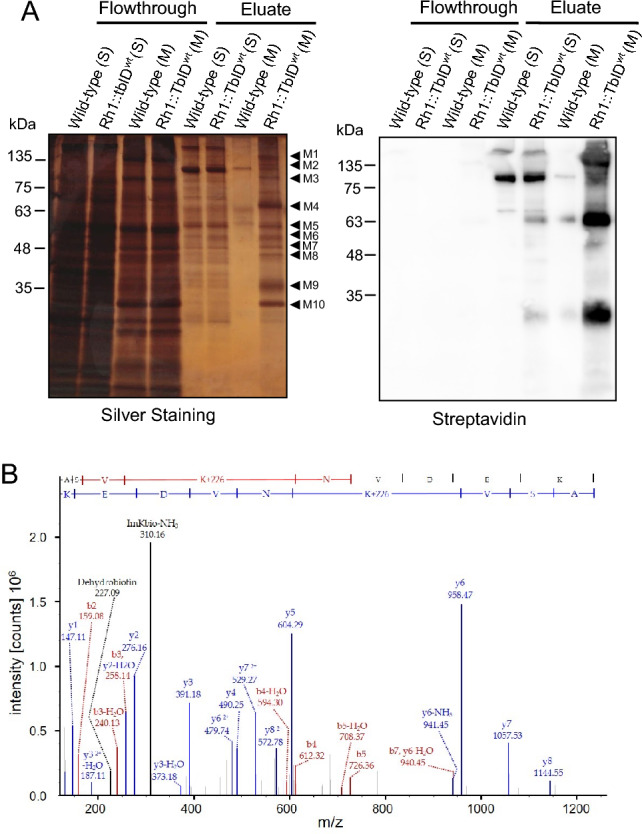
Proteins exert their function through protein-protein interactions. In Drosophila, G protein-coupled receptors like rhodopsin (Rh1) interact with a G protein to activate visual signal transduction and with arrestins to terminate activation. Also, membrane proteins like Rh1 engage in protein-protein interactions during folding within the endoplasmic reticulum, during their vesicular transport and upon removal from the cell surface and degradation. Here, we expressed a Rh1-TurboID fusion protein (Rh1::TbID) in Drosophila photoreceptors to identify in vivo Rh1 interaction partners by biotin proximity labeling. We show that Rh1::TbID forms a functional rhodopsin that mediates biotinylation of arrestin 2 in conditions where arrestin 2 interacts with rhodopsin. We also observed biotinylation of Rh1::TbID and native Rh1 as well as of most visual signal transduction proteins. These findings indicate that the signaling components in the rhabdomere approach rhodopsin closely, within a range of ca. 10 nm. Furthermore, we have detected proteins engaged in the maturation of rhodopsin and elements responsible for the trafficking of membrane proteins, resembling potential interaction partners of Rh1. Among these are chaperons of the endoplasmic reticulum, proteins involved in Clathrin-mediated endocytosis as well as previously unnoticed contributors to rhodopsin transportation, such as Rab32, Vap33, or PIP82.


Conflict of interest statement

The authors declare no competing interests.

Figures

Figure 1
Figure 1
Generation of Rh1::TbID expressing transgenic Drosophila. (A) Scheme of a C-terminal Rh1::TbID fusion protein. The DNA encoding TurboID-V5 (TbID) was cloned 3ʹ of the coding region of Rh1 cDNA. AlphaFold structure prediction for Drosophila Rh1 and E. coli BirA was used to obtain the depicted models. N- and C-terminal regions of Rh1 are indicated. (B) Immunoblot analysis assessing expression of fusion protein Rh1::TbID in heads of transgenic flies. Rh1 and Rh1::TbID were detected by a polyclonal Rh1-antibody (α-Rh1). Rh1-TurboID expression was also detected by an α-V5 antibody. (C) Quantification of native Rh1 and Rh1::TbID in wild-type flies vs. flies expressing Rh1::TbID in wild-type background (Rh1::TbIDwt) and in ninaE17 background (Rh1::TbIDninaE). Immunoblot analysis was carried out using α-Rh1. Rh1 level in wild type was set to 100% (n = 6, p > 0.05 = ns). (D) Western blot analysis of biotinylated proteins in wild-type heads and heads of transgenic flies (Rh1::TbIDwt) that were either kept in the dark or illuminated with blue light for 4 h. Blots were probed with HRP-conjugated streptavidin. Transgenic flies revealed increased biotinylation of proteins compared to wild-type controls. Bands corresponding to the self-biotinylated Rh1::TbID, native Rh1, and the 48 kDa band present in blue light illuminated flies are marked with arrowheads. In all blots shown protein extracts from heads (equivalent of 2.4 heads per lane) were blotted after electrophoretic separation in 12% SDS gels. The size of molecular weight markers in kDa is indicated on the left. Original full size blots are presented in Supplementary Fig. 4S.
Figure 2
Figure 2
Rh1::TbID forms a functional rhodopsin in the rhabdomere. (A) Electroretinograms (ERG) of 3 days old wild-type and transgenic (Rh1::TbIDwt and Rh1::TbIDninaE) flies. Dark-adapted flies were subjected to a single orange light stimulus (left side) or to an OBBOO-protocol (right side, see “Materials and methods” section). Orange or blue light stimuli are indicated by orange and blue bars, respectively. Flies containing Rh1::TbID and no native Rh1 (Rh1::TbIDninaE) show wild-type light responses except for a less pronounced prolonged depolarization afterpotential (PDA) after blue light stimulation. (B) Immunocytochemical cross sections through ommatidia of 1 day old wild-type, Rh1::TbIDwt, and Rh1::TbIDninaE flies. The Rh1 null mutant ninaE17 was used as a negative control. Subcellular localization of Rh1::TbID and native Rh1 in the dark-adapted flies (left side) and after 4 h exposure to blue light (right side) is demonstrated. Rhabdomeric actin was stained with Alexa Fluor 546 conjugated phalloidin (green). Rh1::TbID and native Rh1 were labeled with 4C5 antibody, which was detected by a secondary ALF 680-coupled antibody (red). The overlay of both channels appears yellow. In dark-adapted flies both Rh1::TbID and native Rh1 were localized within the rhabdomere. After 4 h of blue light exposure, vesicles containing Rh1 or Rh1::TbID were detected (arrowheads). Scale bar: 5 µm.
Figure 3
Figure 3
Identification of arrestin 2 as a Rh1 interaction partner by biotin proximity labeling. (A) Reversible, light-induced binding of arrestin 2 to photoreceptor membranes of Drosophila. 1 day old wild-type, Rh1::TbIDwt and Rh1::TbIDninaE flies were exposed to blue light for 4 h (blue bars) to induce arrestin 2 binding to membranes. Part of these flies were then illuminated with red light for 5 min (red bars) to release arrestin 2 from membranes. Protein extracts of soluble proteins (S) and of membrane proteins (M) were loaded on 12% SDS gels (equivalent of 2.4 heads per lane) and blotted after electrophoretic separation. Biotinylated proteins were detected with Streptavidin-HRP (top panel). The arrestin 2 bands are indicated by an arrowhead. (B) Time course for biotinylation of arrestin 2 in Rh1::TbIDninaE flies. Flies were kept in the dark for 24 h and then exposed to blue light for 2ʹ, 5ʹ, 15ʹ, 1 h, and 4 h. Protein extracts from heads (equivalent of 2.4 heads per lane) were blotted after electrophoretic separation in 12% SDS gel. Biotinylated proteins were detected with Streptavidin-HRP. Anti-arrestin 2 antibody was used to detect arrestin 2 (bottom panels in A,B). The size of molecular weight markers in kDa is indicated on the left. Original full size blots are presented in Supplementary Fig. 4S.
Figure 4
Figure 4
Analysis of biotinylated proteins in Drosophila mutants. Western blot analysis of biotinylated proteins with HRP-Streptavidin in heads of wild type, Rh1::TbIDwt and Drosophila mutants lacking native arrestin 2, Rh1, or NinaA (Rh1::TbIDarr2, Rh1::TbIDninaE, Rh1::TbIDninaA, respectively). 1 day old flies raised on medium supplemented with 100 μM biotin were kept in the dark (black bars) or illuminated with blue light for 4 h (blue bars). The lower panels show immunoblots of the same gel probed with α-Arr2 or α-Rh1 antibody. Protein extracts from heads (equivalent of 2.4 heads per lane) were blotted after electrophoretic separation in 12% SDS gel. The size of molecular weight markers in kDa is indicated on the left. Biotinylated arrestin 2 band is reduced in Rh1::TbIDninaA and absent in Rh1::TbIDarr2 (arrowhead). Original full size blots are presented in Supplementary Fig. 4S.
Figure 5
Figure 5
Streptavidin pull down of biotinylated proteins for mass spectrometry analysis. (A) Wild-type and Rh1::TbIDwt flies were illuminated with white light for 12 h. Protein extracts of soluble proteins (S) and of membrane proteins (M) were incubated with streptavidin beads to pull down biotinylated proteins. Flowthrough and proteins eluted from the beads after pull down were loaded on 12% SDS gels (equivalent of 4.5 and 25 heads per lane for flowthrough and eluate, respectively). One Gel was stained with silver nitrate (left panel) and an equivalent gel was blotted and probed with streptavidin (right panel). Arrowheads indicate protein bands that were excised from lanes Wild-type (M) and Rh1::TbIDwt (M) for LC–MS/MS analysis. The size of molecular weight markers in kDa is indicated on the left. (B) MS/MS spectrum of the biotinylated peptide ASVKNVDEK from TRP. Biotin is attached to the first lysine. Detected biotin signature fragment ions: dehydrobiotin, 227.09 Da; immonium ion of biotinylated lysine minus NH3 (ImKbio-NH3), 310.16 Da. Original full size blots and gels are presented in Supplementary Fig. 4S.
Figure 6
Figure 6
Quantitative immunoblot analysis of the Rh1 content in selected mutants. Head extracts of the PIP821bp∆ and tsCRISPR-induced mutants for Rab32, Vap33 and Kazachoc (kcc) were probed with the monoclonal Rh1 antibody and an anti-Tubulin antibody to assess Rh1 amounts. Wild-type flies were used as a control for PIP821bp∆, as controls for tsCRISPR mutants the respective sgRNA lines without induction of sgRNA expression were used. (A) Shows a representative immunoblot. Upper panel was probed anti-Rh1 antibody, lower panel was probed with anti-Tubulin antibody, which was used as a loading control. (B) Quantification of Rh1 in indicated mutants vs. control flies. Rh1 signals were normalized with Tubulin signals and compared to the respective controls on the same blot that were set to 100% (n = 4 for PIP821bp∆, Rab32, Vap33; n = 7 for Kazachoc; error bar: SEM; **p < 0.002; ***p < 0.0002; ns not significant). Original full size blots are presented in Supplementary Fig. 4S.
Figure 7
Figure 7
Scheme of a Drosophila photoreceptor cell showing localization of putative Rh1 interaction partners. Arrows indicate anterograde and retrograde transport routes of Rh1. ER endoplasmic reticulum, Golgi Golgi apparatus, SRC subrhabdomeric cisternae, EE early endosome, RE recycling endosome, LE late endosome.

Similar articles

Cited by

References

    1. Zuker CS, Cowman AF, Rubin GM. Isolation and structure of a rhodopsin gene from D. melanogaster. Cell. 1985;40:851–858. doi: 10.1016/0092-8674(85)90344-7. - DOI - PubMed
    1. O'Tousa JE, et al. The Drosophila ninaE gene encodes an opsin. Cell. 1985;40:839–850. doi: 10.1016/0092-8674(85)90343-5. - DOI - PubMed
    1. Hardie RC, Raghu P. Visual transduction in Drosophila. Nature. 2001;413:186–193. doi: 10.1038/35093002. - DOI - PubMed
    1. Montell C. Visual transduction in Drosophila. Annu. Rev. Cell Dev. Biol. 1999;15(231–68):231–268. doi: 10.1146/annurev.cellbio.15.1.231. - DOI - PubMed
    1. Zuker CS. The biology of vision of Drosophila. Proc. Natl. Acad. Sci. U.S.A. 1996;93:571–576. doi: 10.1073/pnas.93.2.571. - DOI - PMC - PubMed

LinkOut - more resources