

Durvalumab plus pazopanib combination in patients with advanced soft tissue sarcomas: a phase II trial
- PMID: 38263321
- PMCID: PMC10806253
- DOI: 10.1038/s41467-024-44875-2
Durvalumab plus pazopanib combination in patients with advanced soft tissue sarcomas: a phase II trial
Abstract
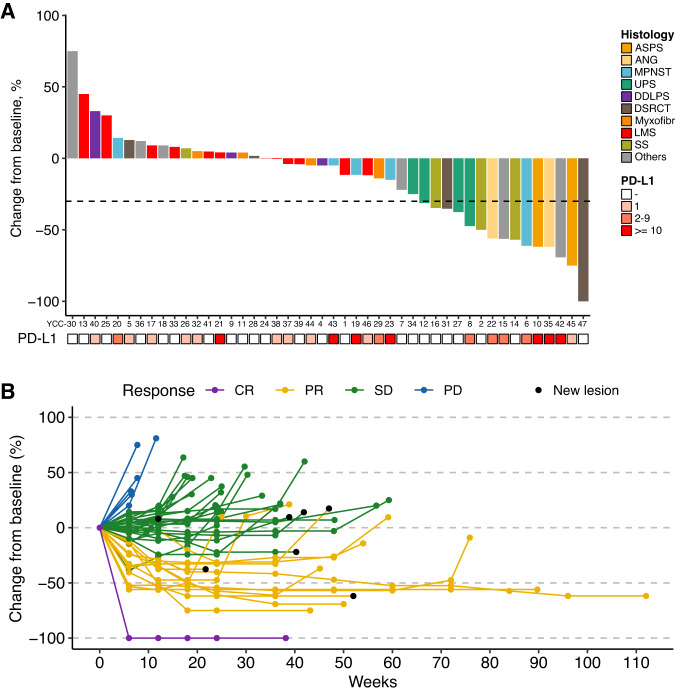
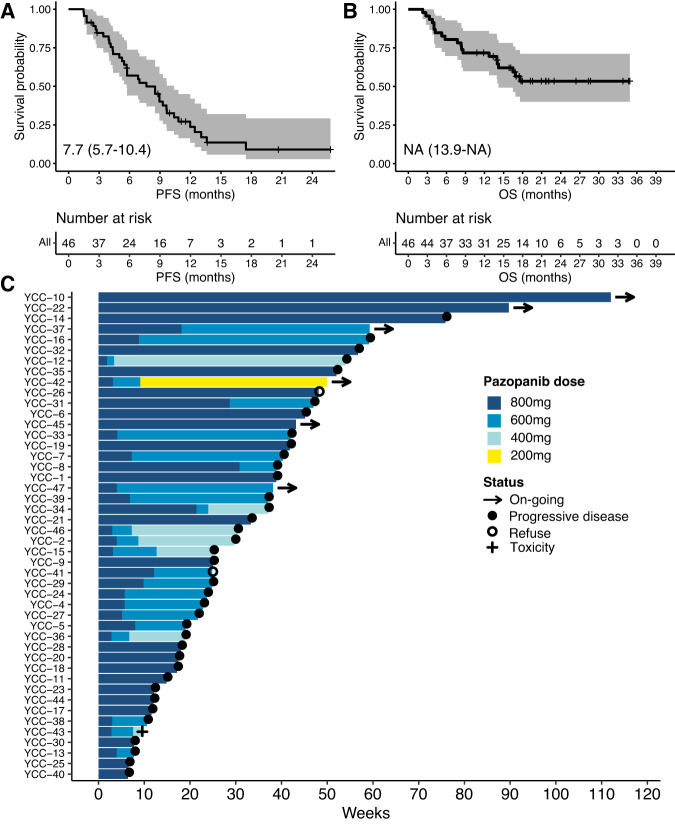
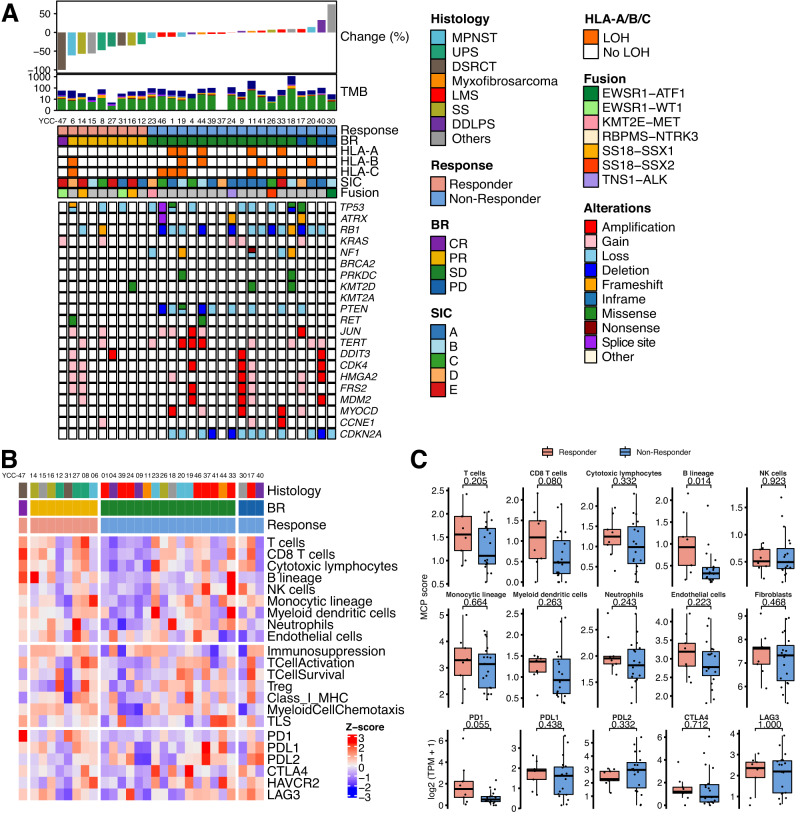
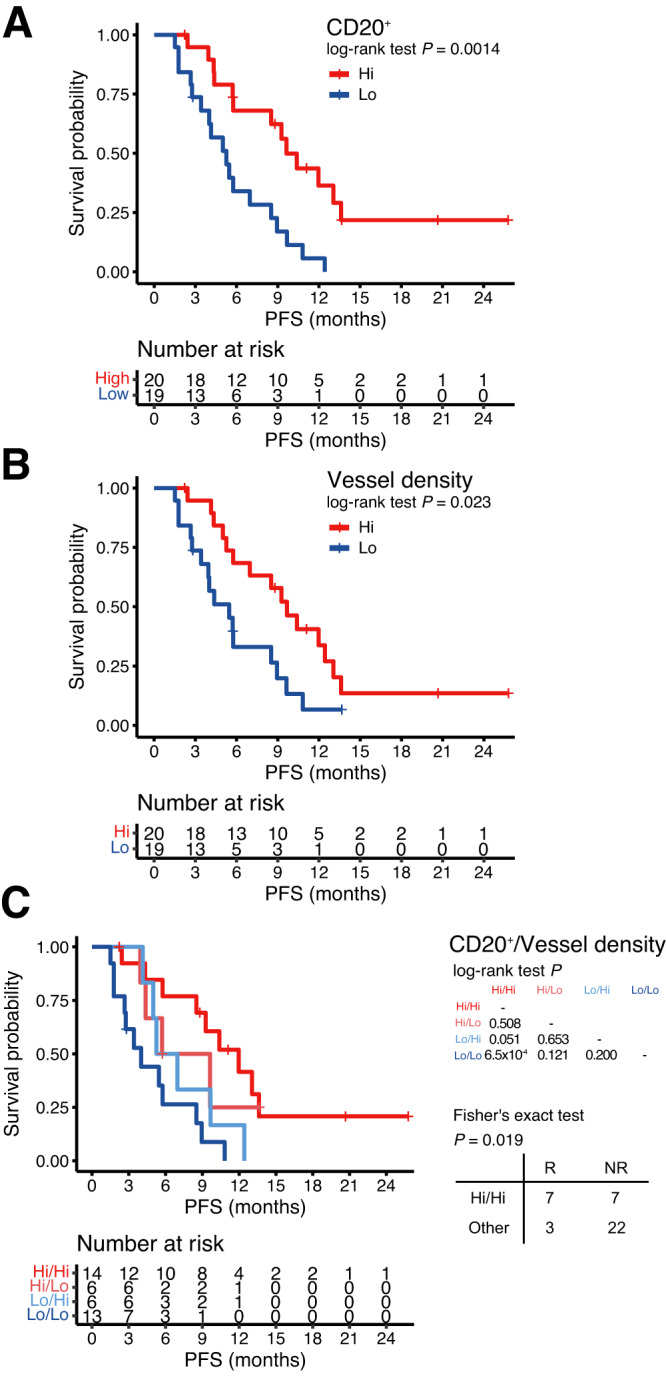
We aimed to determine the activity of the anti-VEGF receptor tyrosine-kinase inhibitor, pazopanib, combined with the anti-PD-L1 inhibitor, durvalumab, in metastatic and/or recurrent soft tissue sarcoma (STS). In this single-arm phase 2 trial (NCT03798106), treatment consisted of pazopanib 800 mg orally once a day and durvalumab 1500 mg once every 3 weeks. Primary outcome was overall response rate (ORR) and secondary outcomes included progression-free survival (PFS), overall survival, disease control rate, immune-related response criteria, and safety. The ORR was 30.4% and the trial met the pre-specified endpoint. The median PFS was 7.7 months (95% confidence interval: 5.7-10.4). The common treatment-related adverse events of grades 3-4 included neutropenia (9 [19.1%]), elevated aspartate aminotransferase (7 [14.9%]), alanine aminotransferase (5 [10.6%]), and thrombocytopenia (4 [8.5%]). In a prespecified transcriptomic analysis, the B lineage signature was a significant key determinant of overall response (P = 0.014). In situ analysis also showed that tumours with high CD20+ B cell infiltration and vessel density had a longer PFS (P = 6.5 × 10⁻⁴) than those with low B cell infiltration and vessel density, as well as better response (50% vs 12%, P = 0.019). CD20+ B cell infiltration was identified as the only independent predictor of PFS via multivariate analysis. Durvalumab combined with pazopanib demonstrated promising efficacy in an unselected STS cohort, with a manageable toxicity profile.
© 2024. The Author(s).
Conflict of interest statement
H.S.K. received grant/research support from MSD, Eli Lilly and Company, Ono Pharmaceutical Company, Medpacto Pharmaceutical, and Boryung Pharmaceutical Company outside the submitted work. S.Y.R. received grant/research support from MSD, Celltrion, Boehringer-Ingelheim, Eli Lilly and Company, Taiho, Bristol-Myers Squibb, ASLAN, and Incyte; consultation fees for Daiichi Sankyo, MSD, Eli Lilly, Bristol-Myers Squibb, and Eisail; and served on a speaker’s bureau for Eli Lilly, Bristol-Myers Squibb, and MSD outside the submitted work. All remaining authors declare no competing interests.
Figures
Similar articles
-
Real-world experience with pazopanib in locally advanced and metastatic soft tissue sarcomas: a Hungarian retrospective single-center study.Pathol Oncol Res. 2025 Apr 1;31:1611965. doi: 10.3389/pore.2025.1611965. eCollection 2025. Pathol Oncol Res. 2025. PMID: 40236790 Free PMC article.
-
Comprehensive Molecular Characterization of Soft Tissue Sarcoma for Prediction of Pazopanib-Based Treatment Response.Cancer Res Treat. 2023 Apr;55(2):671-683. doi: 10.4143/crt.2022.251. Epub 2022 Sep 27. Cancer Res Treat. 2023. PMID: 36164943 Free PMC article.
-
Efficacy and Safety of TRC105 Plus Pazopanib vs Pazopanib Alone for Treatment of Patients With Advanced Angiosarcoma: A Randomized Clinical Trial.JAMA Oncol. 2022 May 1;8(5):740-747. doi: 10.1001/jamaoncol.2021.3547. JAMA Oncol. 2022. PMID: 35357396 Free PMC article. Clinical Trial.
-
The Efficacy and Safety of Pazopanib Plus Chemotherapy in Treating Recurrent or Persistent Ovarian Cancer: A Systematic Review and Meta-Analysis.Am J Clin Oncol. 2023 Jun 1;46(6):254-262. doi: 10.1097/COC.0000000000000999. Epub 2023 Mar 6. Am J Clin Oncol. 2023. PMID: 36877187 Free PMC article.
-
Pazopanib in the treatment of soft tissue sarcoma.Expert Rev Anticancer Ther. 2012 Jun;12(6):711-23. doi: 10.1586/era.12.41. Expert Rev Anticancer Ther. 2012. PMID: 22716487 Review.
Cited by
-
Monocyte-lineage tumor infiltration predicts immunoradiotherapy response in advanced pretreated soft-tissue sarcoma: phase 2 trial results.Signal Transduct Target Ther. 2025 Mar 17;10(1):103. doi: 10.1038/s41392-025-02173-3. Signal Transduct Target Ther. 2025. PMID: 40097400 Free PMC article. Clinical Trial.
-
Histology-Specific Clinical Trial of Lenvatinib and Pembrolizumab in Patients with Sarcoma.Clin Cancer Res. 2024 Dec 16;30(24):5612-5619. doi: 10.1158/1078-0432.CCR-24-2519. Clin Cancer Res. 2024. PMID: 39405335 Free PMC article.
-
Combination of immune checkpoint inhibitors and anthracyclines as a potential first-line regimen for dedifferentiated liposarcoma: systematic review and meta-analysis.Cancer Immunol Immunother. 2025 Apr 21;74(6):179. doi: 10.1007/s00262-025-04007-1. Cancer Immunol Immunother. 2025. PMID: 40257618 Free PMC article.
-
Novel Therapeutics in Soft Tissue Sarcoma.Cancers (Basel). 2024 Dec 24;17(1):10. doi: 10.3390/cancers17010010. Cancers (Basel). 2024. PMID: 39796641 Free PMC article. Review.
-
A multicenter, randomized, non-comparative, phase II study of nivolumab ± ipilimumab for patients with metastatic sarcoma (Alliance A091401): expansion cohorts and correlative analyses.J Immunother Cancer. 2024 Sep 28;12(9):e009472. doi: 10.1136/jitc-2024-009472. J Immunother Cancer. 2024. PMID: 39343511 Free PMC article. Clinical Trial.
References
-
- Sleijfer S, et al. Prognostic and predictive factors for outcome to first-line ifosfamide-containing chemotherapy for adult patients with advanced soft tissue sarcomas: an exploratory, retrospective analysis on large series from the European Organization for Research and Treatment of Cancer-Soft Tissue and Bone Sarcoma Group (EORTC-STBSG) Eur. J. Cancer. 2010;46:72–83. doi: 10.1016/j.ejca.2009.09.022. - DOI - PubMed
-
- Seddon B, et al. Gemcitabine and docetaxel versus doxorubicin as first-line treatment in previously untreated advanced unresectable or metastatic soft-tissue sarcomas (GeDDiS): a randomised controlled phase 3 trial. Lancet Oncol. 2017;18:1397–1410. doi: 10.1016/S1470-2045(17)30622-8. - DOI - PMC - PubMed
-
- Demetri GD, et al. Efficacy and safety of Trabectedin or Dacarbazine for metastatic Liposarcoma or Leiomyosarcoma after failure of conventional chemotherapy: results of a Phase III randomized multicenter clinical trial. J. Clin. Oncol. 2016;34:786–793. doi: 10.1200/JCO.2015.62.4734. - DOI - PMC - PubMed
Publication types
MeSH terms
Substances
Grants and funding
LinkOut - more resources
Full Text Sources
Medical
Research Materials
Miscellaneous
