. 2024 Feb;25(2):704-724.
doi: 10.1038/s44319-024-00058-0. Epub 2024 Jan 23.

Mitochondrial translocation of TFEB regulates complex I and inflammation

Affiliations

Mitochondrial translocation of TFEB regulates complex I and inflammation

Chiara Calabrese et al. EMBO Rep. 2024 Feb.

Abstract

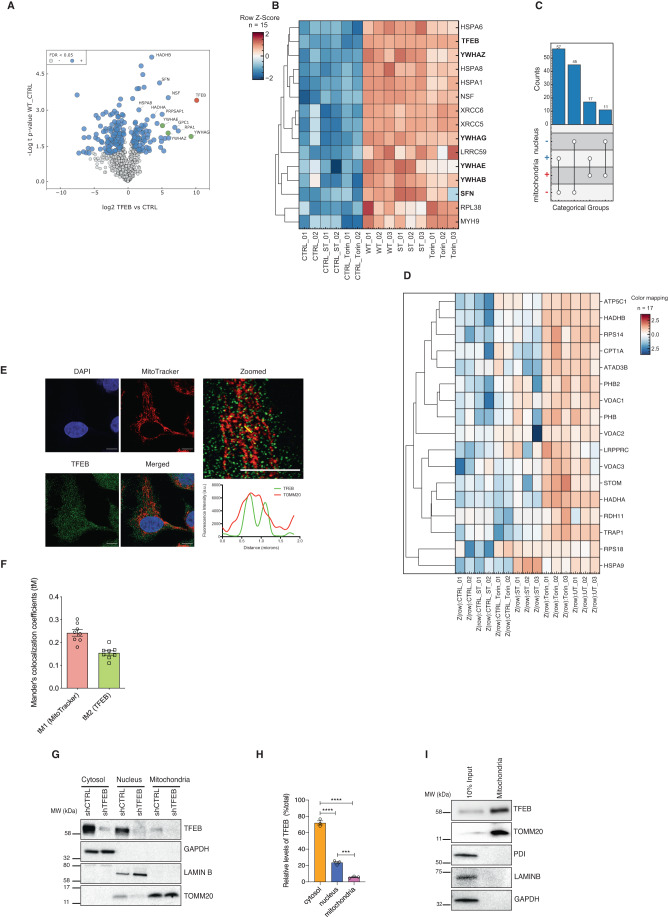
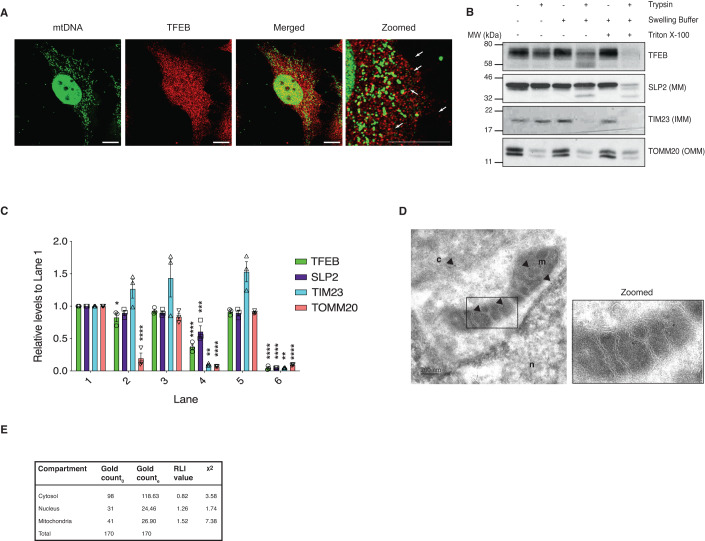
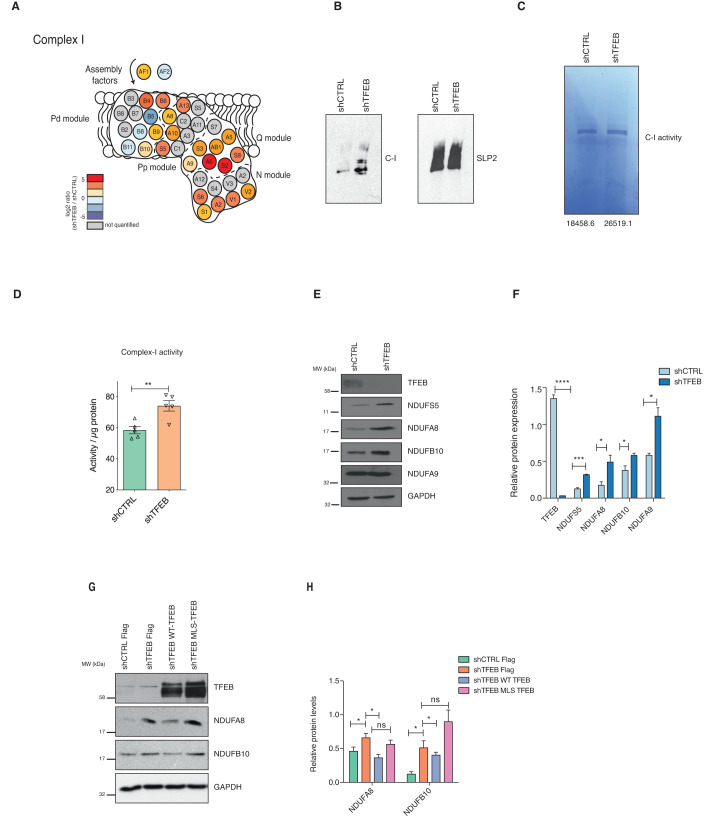
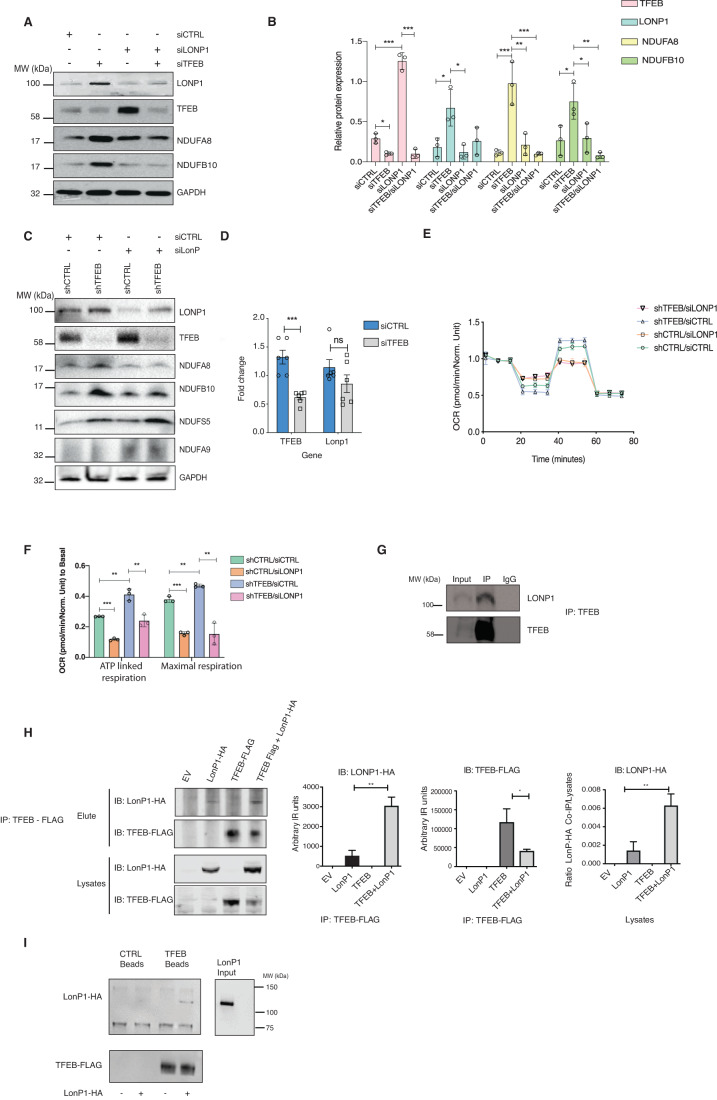
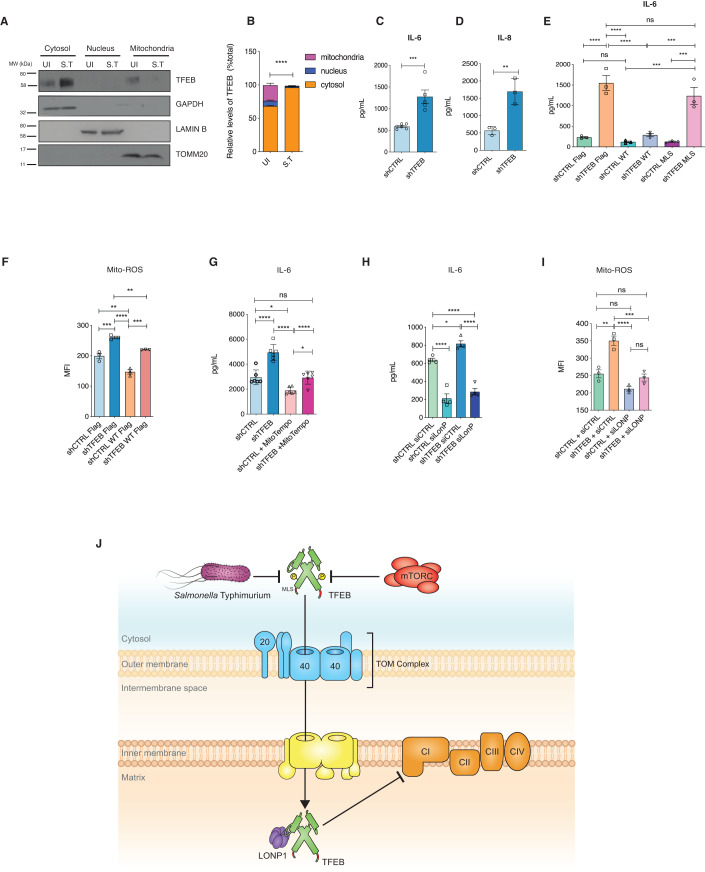
TFEB is a master regulator of autophagy, lysosome biogenesis, mitochondrial metabolism, and immunity that works primarily through transcription controlled by cytosol-to-nuclear translocation. Emerging data indicate additional regulatory interactions at the surface of organelles such as lysosomes. Here we show that TFEB has a non-transcriptional role in mitochondria, regulating the electron transport chain complex I to down-modulate inflammation. Proteomics analysis reveals extensive TFEB co-immunoprecipitation with several mitochondrial proteins, whose interactions are disrupted upon infection with S. Typhimurium. High resolution confocal microscopy and biochemistry confirms TFEB localization in the mitochondrial matrix. TFEB translocation depends on a conserved N-terminal TOMM20-binding motif and is enhanced by mTOR inhibition. Within the mitochondria, TFEB and protease LONP1 antagonistically co-regulate complex I, reactive oxygen species and the inflammatory response. Consequently, during infection, lack of TFEB specifically in the mitochondria exacerbates the expression of pro-inflammatory cytokines, contributing to innate immune pathogenesis.

Keywords: LONP1; Metabolism; Mitochondria; Salmonella; TFEB.


Conflict of interest statement

The authors declare no competing interests.

Figures

Figure 1
Figure 1. TFEB localizes to mitochondria.
(A) Volcano plot of FLAG-immunoprecipitates from cells transfected with WT-TFEB FLAG and an unrelated protein as control. The blue dots, green dots and red dots represent positive interactors, established TFEB interactors and high enrichment of TFEB respectively, indicating the reliability of the proteomics data. (B) Hierarchical clustering using Euclidean distance and complete method for row dendrogram calculations representing the core TFEB interactome. Shown are individual replicates of the WT-TFEB pull down in untreated conditions (UT), upon torin-1 treatment and upon S. Typhimurium infection (ST). The CTRL is represented by a pull down of another non-specific-FLAG tagged protein used as negative control for the interactions. Log2 LFQ intensities were Z-Score normalized. 14-3-3 proteins as well as the bait TFEB are highlighted in bold font. (C) Countplot indicating cellular localization (based on Gene Ontology cellular component annotations) of identified potential interaction partners. “+” symbol corresponds to a known localization either in mitochondria or nucleus. “-” symbol corresponds to an unknown localization in the same compartments. Points and lines indicate categorical group and the bar graph indicates the number of proteins matching the categorical group. (D) Hierarchical clustering of TFEB-interacting mitochondrial proteins. Shown are individual replicates similar to (A). (E) HeLa cells stained for mitochondria using MitoTracker red and nucleus. Scale bar = 10 μM. (F) Colocalization of TFEB and MitoTracker from (D) was evaluated in ROIs (25 × 25 pixels) as described in Methods section. Mander’s colocalization coefficients using the calculated thresholds (tM) were determined for the red (tM1) (TOMM20) and the green (tM2) (TFEB) channels. Eight cells per group were analyzed. Error bars represent standard error mean (SEM). (G) TFEB expression in subcellular fractions from shCTRL and shTFEB HeLa cells. LAMINB, TOMM20, and GAPDH served as loading controls for the nucleus, mitochondria, and cytoplasm, respectively. Western blot is representative of three independent experiments showing similar results. (H) Quantitation of endogenous TFEB levels in subcellular fractions of HeLa cells. Error bars denote SEM; n = 3 biological replicates; One-way ANOVA followed by Tukey’s multiple comparison test was conducted (***p < 0.005, ****p < 0.001). (I) TFEB expression in 10% of total lysate (positive control) and in highly enriched mitochondria isolated from HEK293T cells using TOMM22-magnetic beads. TOMM20 was used to confirm the enrichment of mitochondria. PDI was used to exclude ER contaminations; LAMINB to exclude nuclear contaminations and GAPDH to exclude cytosolic contaminations. Blot shown is a representative image of atleast 3 replicates. Source data are available online for this figure.
Figure 2
Figure 2. TFEB translocates into the mitochondrial matrix in a membrane-potential-dependent manner.
(A) HeLa cells were stained for mitochondrial DNA (mtDNA) using the fluorescent DNA-specific dye PicoGreen and endogenous TFEB. Arrows indicate co-localization. Scale bar = 10 μM. (B) Protease protection assay on purified mitochondria isolated from HeLa cells using 50 μg trypsin in the presence or absence of swelling buffer. Samples were analyzed for the outer mitochondrial membrane (OMM) protein TOMM20, the inner mitochondrial membrane (IMM) protein TIM23, and the mitochondrial matrix (MM) protein SLP2. SLP2 and endogenous TFEB were exposed to trypsin after mitochondria were lysed with Triton X-100. Western blot is representative of two independent experiments showing similar results. (C) Densitometric analysis of protein levels in (B). Band intensities were normalized to the first lane (untreated mitochondria) of the respective protein. Error bars denote SEM; n = 3 biological replicates; One-way ANOVA followed by Tukey’s multiple comparison test was conducted (*p < 0.05; **p < 0.01; ***p < 0.005; ****p < 0.001). (D) Immunogold endogenous-TFEB labeling in mitochondria of HeLa cells. Arrows indicate immunogold particles detected in the nucleus (n), cytosol (c) and mitochondria (m). Scale bar = 200 nm. (E) Synthetic dataset of observed gold particles deposited on organelle-based compartments. Gold particles were counted using stereology method, applied on 20 images. Go values indicate the number of gold particles observed; Ge values indicate the number of gold particles expected. Source data are available online for this figure.
Figure 3
Figure 3. TFEB import into mitochondria depends on a mitochondria localization sequence (MLS) and mTOR.
(A) Graphical representation of the WT-TFEB FLAG plasmid showing the predicted MLS domain. (B) Analysis of subcellular fractions isolated from HeLa cells expressing FLAG, WT-TFEB- FLAG or MLS-TFEB-FLAG. LAMINB, TOMM20, and GAPDH served as controls for nucleus, mitochondria, and cytoplasm, respectively. Western blot is representative of three independent experiments showing similar results. (C) Relative abundance of TFEB in the various fractions of the immunoblot shown in (B). Error bars denote SEM; n = 3 biological replicates; unpaired t-test was conducted, and statistical significance is denoted as ***p < 0.005. (D) Import assay using in vitro synthesized [35S]WT-TFEB and [35S]MLS-TFEB performed on isolated mitochondria. Samples were treated with trypsin and assay was performed in the presence (+) or absence (−) of mitochondrial membrane potential (Δψ) at different time points. Mitochondria lysed with Triton X-100 were loaded as control. (E) Graph represents quantification of the in vitro [35S]WT-TFEB import assay shown in (C). Error bars denote SEM; n = 3 biological replicates; One-way ANOVA followed by Tukey’s multiple comparison test was conducted and statistical significance denoted as **p < 0.01; ***p < 0.005; ****p < 0.001. (F) Conservation of the MLS sequence (red). (G) Endogenous TFEB in subcellular fractions isolated from HeLa cells in untreated conditions (UT) and upon 1 h torin-1 treatment. LAMIN B, TOMM20, and GAPDH served as controls for nucleus, mitochondria, and cytoplasm, respectively. Western blot is representative of three independent experiments showing similar results. (H) Relative abundance of TFEB in the various fractions of the immunoblot shown in (G). Error bars denote SEM; n = 3 biological replicates; Unpaired t-test was conducted and statistical significance is represented as ***p < 0.005. (I) Confocal image of HeLa cells untreated and treated with torin-1 stained for TFEB and TOMM20. Scale bar = 10 µM. (J) Colocalization of TFEB and TOMM20 from (I) was evaluated in ROIs (25x25 pixels) as described in the “Methods” section. Mander’s colocalization coefficients using the calculated thresholds (tM) were determined for the cyan (TOMM20) and yellow (TFEB) channels. Eight cells per group were analyzed. Graph shows Mander’s colocalization coefficients using the calculated thresholds (tM) for TFEB channel in untreated and torin-1 treated HeLa cells. Error bars represent SEM; unpaired t-test was conducted, and statistical significance represented as **p < 0.01. (K) TFEB structure showing phosphorylation sites in untreated and torin-1-treated cells identified and quantified by LC-MS/MS. Colors indicate intensities in the cytosol (C) or mitochondria (M). (L) Endogenous TFEB was immunoprecipitated (IP) from untreated and torin-1 treated HeLa cells and immunoblotted (IB) for TOMM20 and TFEB; Isotype specific IgG was used as negative control. The immunoprecipitations were performed twice independently showing similar results. Source data are available online for this figure.
Figure 4
Figure 4. Loss of TFEB dysregulates mitochondrial architecture and function.
(A) TOMM20 and nucleus staining in shCTRL or shTFEB HeLa cells. Scale bar = 10 μm. The boundaries of the cell are shown with a marking. Phase contrast images of the two cell lines are also shown to compare the size of the cells. (B) Percentage of perinuclear and cytosolic mitochondria clustering. n = 50 cells each. Error bars represent SEM; unpaired t-test was conducted, and statistical significance represent as ***p < 0.005. (C) TOMM20 and nucleus staining in shTFEB cells transfected with FLAG, WT-TFEB- FLAG or MLS-TFEB-FLAG. Scale bar = 10 μm. (D) OXPHOS profile normalized to Basal respiration of shCTRL and shTFEB cells transfected with empty FLAG, WT-TFEB and MLS-TFEB plasmids. Data represents 3 biological replicates; error bars denote SEM. (E) Basal, ATP-linked respiration and Maximal respiration normalized to Basal respiration in shCTRL and shTFEB cells transfected with FLAG, WT-TFEB- FLAG or MLS-TFEB-FLAG. Shown are mean ± SEM, n = 3 biological replicates; one-way ANOVA followed by Tukey’s multiple comparison analysis was done, and statistical significance represented as *p < 0.05; **p < 0.01; ***p < 0.005; ****p < 0.001. (F) mRNA levels of TFEB target genes (relative to HPRT) from shTFEB HeLa cells transfected with FLAG, WT-TFEB- FLAG, MLS-TFEB-FLAG, ΔNLS-TFEB FLAG, S142A/S211A-TFEB FLAG or MTS-TFEB FLAG. Shown are mean ± SEM, n = 3 biological replicates. One-way ANOVA followed by Tukey’s multiple comparison analysis was done, and statistical significance represented as *p < 0.05; **p < 0.01; ***p < 0.005; ****p < 0.001. Source data are available online for this figure.
Figure 5
Figure 5. Mitochondrial complex I is altered in TFEB-depleted cells.
(A) Schematic representation of the respiratory chain complex I. Colors indicate the log2 fold change of shTFEB cells compared to control cells. (B) Blue Native Gel Electrophoresis showing complex I assembly in mitochondria enriched from shCTRL and shTFEB cells. Complex I assembly is representative of three independent experiments showing similar results. SLP2 was used as loading control. (C) In-gel complex I activity after incubation with NADH and NBT in mitochondria enriched from shCTRL and shTFEB cells. Numbers represent the intensity of the bands quantified. Complex I activity is representative of two independent experiments showing similar results. (D) Complex I activity determined using microplate assay in shCTRL and shTFEB HeLa cells. Shown are mean ± SEM, n = 5 biological replicates. Unpaired t-test was done to determine statistical significance and noted as **p < 0.01. (E) TFEB, NDUFS5, NDUFA8, NDUFB10, NDUFA9, and GAPDH expression in shCTRL and shTFEB HeLa cells. Western blot is representative of three independent experiments showing similar results. (F) Mean densitometric analysis of the immunoblot shown in (E). Shown are mean ± SEM, n = 3 biological replicates. Unpaired t-test was done to determine statistical significance and noted as *p < 0.05; ***p < 0.005; ****p < 0.001. (G) NDUBFA8, NDUFB10, TFEB, and GADPH expression in shCTRL and shTFEB transfected with FLAG, WT-TFEB- FLAG or MLS-TFEB-FLAG. Western blot is representative of three independent experiments showing similar results. (H) Mean densitometric analysis of the immunoblot shown in (G). Shown are mean ± SEM, n = 3 biological replicates. Unpaired t-test was done to determine statistical significance and noted as *p < 0.05. Source data are available online for this figure.
Figure 6
Figure 6. TFEB and LONP1 co-regulate complex I.
(A) TFEB, LONP1, NDUFA8, NDUFB10, and GAPDH expression in HeLa cells transfected with control siRNA (siCTRL), siRNA against LONP1 (siLONP1), TFEB specific siRNA (siTFEB) and siRNA against both LONP1 and TFEB. Western blot is representative of three independent experiments showing similar results. (B) Mean densitometric analysis of the immunoblot from (A). Shown are mean ± SEM, n = 3 biological replicates. Unpaired t-test was done to determine statistical significance and represented as *p < 0.05; **p < 0.01; ***p < 0.005; ****p < 0.001. (C) LONP1, TFEB, NDUFA8, NDUFB10, NDUFS5, NDUFA9, and GAPDH protein expression in shCTRL and shTFEB HeLa cells transfected with siCTRL and siLONP1. Western blot is representative of three independent experiments showing similar results. (D) Relative mRNA expression of LONP1 and TFEB (relative to RPL13A) in HeLa cells transfected with siCTRL and siLONP1. Shown are mean ± SEM, n = 6 biological replicates. Unpaired t-test was done to determine statistical significance and represented as ***p < 0.005. (E) OXPHOS profile of shCTRL and shTFEB cells transfected with siCTRL and siLONP1. Shown are mean ± SEM, n = 3 biological replicates. (F) ATP-linked respiration and Maximal respiration rates normalized to Basal respiration in shCTRL and shTFEB HeLa cells transfected with siCTRL or siLONP1. Shown are mean ± SEM, n = 3 biological replicates.. One-way ANOVA test followed by Tukey’s multiple comparison was done to determine statistical significance and represented as **p < 0.01; ***p < 0.005. (G) Endogenous TFEB was immunoprecipitated and immunoblotted for LONP1 and TFEB in HeLa cells. Western blot is representative of two independent experiments showing similar results. IgG was used as negative control. (H) TFEB-Flag was pulled down from cells transfected with Empty vector (EV), LONP1-HA, TFEB-FLAG and TFEB-FLAG + LONP1-HA and immunoblotted for LONP1-HA and TFEB-FLAG to confirm TFEB-LONP1 interaction. EV was used as a negative control. Quantifications of the immunoblot are also shown. The experiment was performed in biological triplicates (n = 3). Unpaired t-test was done to determine statistical significance and represented as *p < 0.05; **p < 0.01. (I) LONP1 was purified and incubated with control beads as negative control and with TFEB- FLAG-tagged beads. The experiment was performed in duplicate showing similar results. Source data are available online for this figure.
Figure 7
Figure 7. Mitochondrial TFEB regulates inflammation.
(A) Endogenous TFEB subcellular localization upon 24 h of S. Typhimurium infection (MOI 100) in HeLa cells. LAMINB, TOMM20, and GAPDH served as controls for nucleus, mitochondria, and cytosol, respectively. Western blot is representative of three independent experiments showing similar results. (B) Densitometric quantitation of immunoblots depicting the subcellular endogenous TFEB localization in uninfected (Ul) and S. Typhimurium-infected (MOI = 100) cells from (A). Shown are mean ± SEM, n = 3 biological replicates. Unpaired t-test was done to determine statistical significance and represented as ****p < 0.001. (C, D) (C) IL-6 and (D) IL-8 in the supernatants of 24 h S. Typhimurium-infected shCTRL and shTFEB HeLa cells. Shown are mean ± SEM, n = 6 biological replicates for IL-6 (C) and 3 biological replicates for IL-8 (D). Shown are mean ± SEM, n = 3 biological replicates. Unpaired t-test was done to determine statistical significance and represented as **p < 0.01; ***p < 0.005. (E) IL-6 in supernatants of shCTRL and shTFEB cells transfected with FLAG, WT-TFEB-FLAG or MLS-TFEB-FLAG plasmids and infected for 24 h with S. Typhimurium (MOI 100). Shown are mean ± SEM, n = 3 biological replicates. Shown are mean ± SEM, n = 3 biological replicates. One-way ANOVA followed by Tukey’s multiple comparison analysis was performed to determine statistical significance and represented as *p < 0.05; **p < 0.01; ***p < 0.005; ****p < 0.001. (F) Flow cytometric analysis of Mitochondrial ROS (mtROS) production was estimated on MitoSOX-stained shCTRL and shTFEB HeLa cells transfected with empty FLAG and WT-TFEB-FLAG and the Mean Fluorescence Intensity (MFI) was plotted; mean ± SEM, n = 3 biological replicates. Unpaired t-test was done to determine statistical significance and represented as **p < 0.01; ***p < 0.005; ****p < 0.001. (G) IL-6 secretion in supernatants of shCTRL and shTFEB cells infected with S. Typhimurium (MOI 100) for 24 h and treated with MitoTempo 2 h prior infection and during infection. Shown are mean ± SEM, n = 3 biological replicates with n = 3 technical replicates each. One-way ANOVA followed by Tukey’s multiple comparison analysis was performed to determine statistical significance and represented as *p < 0.05; ****p < 0.001. (H) IL-6 expression in supernatants of shCTRL and shTFEB HeLa cells transfected with siCTRL and siLONP1 and infected with S. Typhimurium (MOI 100) for 24 h. Shown are mean ± SEM, n = 3 technical replicates. The experiment was repeated twice with similar results. One-way ANOVA followed by Tukey’s multiple comparison analysis was performed to determine statistical significance and represented as *p < 0.05; ****p < 0.001. (I) MitoSOX-based flow cytometric detection of mitochondrial ROS production in shCTRL and shTFEB HeLa cells transfected with siCTRL and siLONP1. Shown is the Mean Fluorescence Intensity (MFI). Shown are mean ± SEM, n = 3 biological replicates. One-way ANOVA followed by Tukey’s multiple comparison analysis was performed to determine statistical significance and represented as *p < 0.05; ****p < 0.001. (J) A model showing that S. Typhimurium prevents mTOR-dependent mitochondrial translocation where it interacts with LONP1 to co-regulate complex I assembly and function. Source data are available online for this figure.

References

    1. Backes S, Herrmann JM. Protein translocation into the intermembrane space and matrix of mitochondria: mechanisms and driving forces. Front Mol Biosci. 2017;4:83. - PMC - PubMed
    1. Benhar M, Dalyot I, Engelberg D, Levitzki A. Enhanced ROS production in oncogenically transformed cells potentiates c-Jun N-terminal kinase and p38 mitogen-activated protein kinase activation and sensitization to genotoxic stress. Mol Cell Biol. 2001;21:6913–6926. - PMC - PubMed
    1. Bohovych I, Chan SS, Khalimonchuk O. Mitochondrial protein quality control: the mechanisms guarding mitochondrial health. Antioxid Redox Signal. 2015;22:977–994. - PMC - PubMed
    1. Bota DA, Davies KJ. Mitochondrial Lon protease in human disease and aging: including an etiologic classification of Lon-related diseases and disorders. Free Radical Biol Med. 2016;100:188–198. - PMC - PubMed
    1. Cox J, Mann M. MaxQuant enables high peptide identification rates, individualized p.p.b.-range mass accuracies and proteome-wide protein quantification. Nat Biotechnol. 2008;26:1367–1372. - PubMed

MeSH terms

Substances

LinkOut - more resources