. 2024 Mar;25(3):1570-1588.
doi: 10.1038/s44319-024-00059-z. Epub 2024 Jan 23.

ChemRAP uncovers specific mRNA translation regulation via RNA 5' phospho-methylation

Affiliations

ChemRAP uncovers specific mRNA translation regulation via RNA 5' phospho-methylation

Hélène Ipas et al. EMBO Rep. 2024 Mar.

Abstract

5'-end modifications play key roles in determining RNA fates. Phospho-methylation is a noncanonical cap occurring on either 5'-PPP or 5'-P ends. We used ChemRAP, in which affinity purification of cellular proteins with chemically synthesized modified RNAs is coupled to quantitative proteomics, to identify 5'-Pme "readers". We show that 5'-Pme is directly recognized by EPRS, the central subunit of the multisynthetase complex (MSC), through its linker domain, which has previously been involved in key noncanonical EPRS and MSC functions. We further determine that the 5'-Pme writer BCDIN3D regulates the binding of EPRS to specific mRNAs, either at coding regions rich in MSC codons, or around start codons. In the case of LRPPRC (leucine-rich pentatricopeptide repeat containing), a nuclear-encoded mitochondrial protein associated with the French Canadian Leigh syndrome, BCDIN3D deficiency abolishes binding of EPRS around its mRNA start codon, increases its translation but ultimately results in LRPPRC mislocalization. Overall, our results suggest that BCDIN3D may regulate the translation of specific mRNA via RNA-5'-Pme.

Keywords: BCDIN3D; LRPPRC; Local Translation; RNA Modification Reader; RNA Phospho-methylation.


Conflict of interest statement

The authors declare no competing interests.

Figures

Figure 1
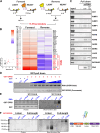
Figure 1. ChemRAP identifies 5′-Pme RNA modification readers.
(A) ChemRAP experimental design for the identification of RNA modification “reader” proteins. HeLa-S3-FlpIn cells are grown in media containing either “heavy” or “light” arginine and lysine (see “Methods”). In this schematic, lysates from cells grown in “heavy” media were incubated with miRNA-5′-P [3′-Biotin], while lysates from cells grown in “light” media were incubated with miRNA-5′-Pme [3′-Biotin]. The pulldowns are pooled, resolved on a gradient PAGE gel, and subjected to in-gel trypsin digestion. The incorporation of heavy amino acids results in a mass shift of the peptides coming from the pulldowns with miRNA-5′-P [3′-Biotin]. The ratio of peak intensities in the mass spectrum reflects the relative protein abundance: Proteins that bind to the beads or the parts of RNAs other than the 5′-P end should be equally represented in both conditions and have a ratio of ~1, while the protein(s) interacting specifically with 5′-Pme should have a ratio significantly inferior to 1. (B) Left: Image of a representative silver-stained PAGE gel with 10 µL of pulldowns with either miRNA-5′-P [3′-Biotin], miRNA-5′-Pme [3′-Biotin] or “no RNA” baits. Right: Image of the corresponding Colloidal Coomassie stained PAGE gel with the indicated mixed pulldowns. NB: H heavy, L light. Red arrows point to the most prominent bands specifically observed in the miRNA-5′-Pme [3′-Biotin] pulldown. These proteins correspond to EPRS and MARS from top to bottom. (C) Plot showing the normalized log2 (H/L) ratio of a forward (x axis) and Reverse (y axis) experiment aiming at identifying miRNA binding proteins. Here, in the forward experiment, miRNA-5′-P pulldowns are with “heavy” lysates, and in the Reverse experiment with “light” lysates. Putative RNA binder proteins found in the lower right quadrant are circled in red, while beads binder proteins found in the upper left quadrant are circled in blue. (D) Plot showing the normalized log2 (H/L) ratio of a forward (x axis) and reverse (y axis) experiment aiming at identifying 5′-Pme “reader” proteins. Here, in the forward experiment, miRNA-5′-Pme pulldowns are with “heavy” lysates, and in the Reverse with “light” lysates. Putative 5′-Pme binders found in the lower right quadrant are circled in red, while 5′-Pme repulsive proteins found in the upper left quadrant are circled in blue. NB: The black lines show the median of each experiment. Full identity of proteins, with H/L ratios in forward and reverse experiments, as well as their distance to the median are found in the Datasets EV1, EV2. Source data are available online for this figure.
Figure 2
Figure 2. The EPRS subunit of the multisynthetase complex preferentially binds to 5′-Pme RNAs.
(A) Schematic of a set of forward and reverse ChemRAP experiments for the identification of 5′-Pme binder proteins. (B) Left: Heatmap cluster analysis showing the normalized log2 (H/L) ratio of all forward and reverse experiments focused on 5′-Pme binding proteins, i.e., with a log2(H/L) < 0 in the reverse experiment, and log2(H/L) > 0 in the forward experiment. On the left, shown are the mean fold change (Mean FC) of the 5′-Pme/5′-P ratio of each protein binding, as well as the associated P value (multiple ratio t test). The arrows highlight the multisynthetase complex subunits. Right: Volcano plot showing the geometric mean FC on the x axis and the −log10(P value) on the y axis. The red dots highlight the multisynthetase complex subunits. (C) Coomassie Stain analysis of in vitro pulldowns of the indicated recombinant proteins with either “no RNA”, miR-145-5′-P [3′-Biotin], or miR-145-5′-Pme [3′-Biotin] baits. SYBR stain analysis of the RNA baits pulled down with Streptavidin beads is also shown as a control. (D) GST pulldown with GST or GST-EPRS of pre-miRNA-145-5′-P or pre-miRNA-145-5-Pme. The pulldown with GST is with 240 nM of RNA, while the gradients are twofold increases from 30 to 240 nM. (E) GST pulldown as in (D), followed by UV cross-linking and analysis of bound pre-miR-145 with West-Northern blot. (F) GST pulldown as in (E) using either the linker region (aa 683–1024) of EPRS or full-length GST-EPRS. Source data are available online for this figure.
Figure 3
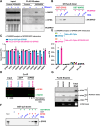
Figure 3. BCDIN3D interacts with EPRS and regulates its association with a subset of the multisynthetase complex.
(A) HeLa-S3-FlpIn Control and BCDIN3Df (BCDIN3D-FLAG) lysates were treated with mock or 30 µg RNase A prior to FLAG co-immunoprecipitation and elution with a FLAG peptide. Inputs and FLAG eluates were analyzed by western blots with the indicated antibodies. Equal co-immuno-precipitation of BCDIN3D was verified by Coomassie staining. (B) Direct comparison of BCDIN3D binding to GST-EPRS and GST-MARS (See complete analysis in Appendix Fig. S2). (C) FLAG eluates from HeLa-S3-FlpIn ± EPRSf (EPRS-FLAG) or HeLa-S3-FlpIn-BCDIN3D-KO ± EPRSf were analyzed by LC-MS/MS. Plotted is the mean from n = 2 independent biological replicates of the Percentage of Total Spectra (PTS) for each protein normalized to EPRS PTS and HeLa-S3-FlpIn-EPRSf. (D) Quantitative LI-COR western blot analysis with antibodies against EPRS (red) and MARS (green) of input and anti-GFP or anti-EPRS immune-precipitates of HeLa-S3-FlpIn Control and BCDIN3D-KO cells. Below the western blot is shown the ratio of MARS/EPRS normalized to control. (E) Enrichment of GAIT subunits (EPRS, GAPDH, NSAP1 and RPL13A) in HeLa-S3-FlpIn and HeLa-S3-FlpIn-BCDIN3D-KO: -(Control) and -EPRSf FLAG eluates. Plotted is the mean from n = 2 independent biological repeats of the PTS for each protein. (F) GST pulldown with GST-MARS assessing binding of untagged recombinant EPRS in the absence or presence of RNA-5′-P or 5′-Pme. (G) Northern blot analysis of MARSf and EPRSf interacting RNAs. The bottom panel shows the SYBR-Gold-stained gel used for the northern blots on the top. Source data are available online for this figure.
Figure 4
Figure 4. BCDIN3D regulates interaction of specific mRNAs with EPRS.
(A) Autoradiogram of the membrane stage of the iCLIP-seq library preparation showing migration of protein-RNA crosslinks pulled down by the control (anti-GFP) and anti-EPRS antibodies in HeLa-S3-FlpIn control and BCDIN3D-KO cells. The bracket shows the EPRS-cross-linked RNAs and corresponds to part of the membrane that was recovered to subsequently perform the iCLIP-seq. The bottom graph shows the quantification of the radioactivity incorporated in the anti-EPRS (RNase +) samples used for the iCLIP-seq. (B) Summary of iCLIP-seq results in HeLa-S3-FlpIn control and BCDIN3D-KO cells as in (A) analyzed by two different pipelines, whole transcriptome analysis and small RNA analysis. The results specific to anti-EPRS compared to anti-GFP for RNAs of interest are shown (n.d. stands for “not detected”). For mRNAs, raw mRNA read numbers pooled from two iCLIP-seq repeats are shown. (C) iCLIP-seq EPRS footprints on the LRPPRC and PGK1 mRNAs shown on UCSC genome browser (hg38). For each example, shown are: the scale, the position on the chromosome, the DNA sequence of the Watson strand (note that the coding sequence of LRPPRC gene is on the Crick strand), the EPRS footprint, the representation of the gene with thin lines representing introns, thick lines representing coding exons [with the encoded Methionines (M) in green and other amino acids in blue], and intermediate thickness lines representing UTRs. (D) Validation of iCLIP-Seq results by X-RIP-RTqPCR with control (anti-GFP) and anti-EPRS antibody in HeLa-S3-FlpIn control and BCDIN3D-KO cells. Shown are the levels of LRPPRC and PGK1 mRNAs normalized to input, GFP and ALAS1 control gene (mean ± SD, n = 3 independent biological replicates, *P value < 0.05, **P value < 0.01 in multiple unpaired t test). Source data are available online for this figure.
Figure 5
Figure 5. BCDIN3D methylates specific mRNAs ends.
(A) Schematic of the activity of TAP (tobacco acid pyrophosphatase) and Terminator on various 5′ ends. TMG represents TriMethylGuanosine caps. (B) Bioanalyzer traces of RNAs treated with mock or TAP and/or Terminator. Shown is also a SYBR-Gold-stained PAGE gel focused on the 7SK, 5.8 S and U4 snRNAs shown by arrows. (C) Analysis of the Terminator-resistant fraction of LRPPRC mRNA in total RNA from HeLa-S3-FlpIn Control and BCDIN3D-KO cells pre-treated with TAP by RTqPCR. Shown is the (TAP+Terminator)/(TAP+Mock) ratio of the levels of B2M, LRPPRC, and PGK1 mRNAs (mean ± SD, n = 3 independent biological replicates, *P value < 0.05 in a multiple unpaired t test). See “RNA analysis” under “Methods”, for more details. (D) In vitro RNA methyltransferase assay with BCDIN3D using radioactive [3H]-SAM as methyl group donor, and RNA#1 and RNA#2. RNA#1 corresponds to the 5′ UTR of LRPPRC (in teal color). RNA#2 corresponds to the 5′ UTR of LRPPRC extended to the open reading frame (extension sequence shown in magenta). Both RNA#1 and RNA#2 have 5′-P ends. Top: Predicted two-dimensional structure of RNA#2, with the sequence in common with RNA#1 shown in teal; the sequence unique to RNA#2 shown in magenta; EPRS-cross-linked site shown with red text; and the start codon shown with green text. Middle: Scintillation counts in disintegrations per minute (dpm) of C[3H]3 incorporated into the RNA from the RNA methyltransferase assay in the bottom panel (mean ± SD, n = 3 technical replicates). Bottom: The bottom panels show the autoradiography and the SYBR-Gold-stained gel that was used for the autoradiography of the RNA methyltransferase assay. Source data are available online for this figure.
Figure 6
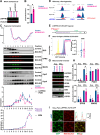
Figure 6. BCDIN3D regulates LRPPRC translation.
(A) Representative quantitative LI-COR western blots with antibodies against LRPPRC (green) and β-Tubulin (red) of whole-cell extracts collected after 48 h of reverse transfection of siNC and siLRPPRC siRNAs in HeLa-S3-FlpIn control and BCDIN3D-KO cells. (B) Ratio of LRPPRC over β-Tubulin normalized to control in quantitative LI-COR western blots of HeLa-S3-FlpIn control and BCDIN3D-KO whole-cell extracts (mean ± SD, n = 3 independent biological replicates, *P value = 0.03 for LRPPRC in a paired ratio t test). (C) Polysome lysates from HeLa-S3-FlpIn control and BCDIN3D-KO cells were fractionated on a 7–50% sucrose gradient and shown are from top to bottom: the real-time recording of OD254; western blots with the indicated antibodies of 20 µL of each fraction (asterisk indicates a non-specific band detected by the BCDIN3D antibody); RTqPCR analysis of LRPPRC, PGK1 and B2M mRNA from each fraction of the same polysome fractionation (shown is mean from two technical replicates). Normalization was done over the average Ct of each mRNA, which did not show significant differences in Control and BCDIN3D-KO cells. See also Appendix Fig. S5 for more details. (D) Harringtonine-treated Ribo-seq data for the LRPPRC and PGK1 mRNAs translation initiation sites are shown on the UCSC genome browser (hg38). (E) Schematic of the LRPPRC-5′UTR-GFP reporter. (F) Flow cytometry analysis of GFP intensity in HeLa-S3-FlpIn control and BCDIN3D-KO cells with a single copy of the LRPPRC-5′UTR-GFP reporter at the FRT locus. Shown are also HeLa-S3-FlpIn cells without reporter (− in yellow) as a negative control. Left: Histogram distribution of GFP intensity (Arbitrary Units) from ~30,000 cells per sample. Right: violin plot of GFP intensity (Arbitrary Units) from ~30,000 single cells per sample. (****P value < 0.0001 in one-way ordinary ANOVA with Tukey’s multiple comparisons test, only the result of the control/BCDIN3D-KO pair is shown). (G) Representative quantitative LI-COR western blots of LRPPRC, PGK1, β-Tubulin, EPRS and MARS distribution upon mitochondrial enrichment in HeLa-S3-FlpIn control and BCDIN3D-KO cells. Shown are also BCDIN3D and two mitochondrial markers (ATPIF1 and HSP60). Sup. stands for supernatant, and Mito. stands for mitochondria-enriched fraction. (H) Ratio of LRPPRC, PGK1, EPRS, and MARS over β-Tubulin normalized to the control mitochondria-enriched fraction of quantitative LI-COR western blots (mean ± SD, n = 3–4 independent biological repeats, *P value = 0.047 for LRPPRC and *P value = 0.057 for MARS in a multiple paired ratio t test). Sup. stands for supernatant, and Mito. stands for mitochondria-enriched fraction. (I) Left: Representative images of HeLa-FlpIn siNC and siBCDIN3D cells having a single copy of the LRPPRC-5′UTR-GFP reporter at the FRT locus and stained for 15 min with Mitotracker-Red. Right: Raw ImageJ profile analysis of the line shown on the siBCDIN3D merged image for each channel. Source data are available online for this figure.

References

    1. Abell NS, Mercado M, Caneque T, Rodriguez R, Xhemalce B. Click quantitative mass spectrometry identifies PIWIL3 as a mechanistic target of RNA interference activator enoxacin in cancer cells. J Am Chem Soc. 2017;139:1400–1403. doi: 10.1021/jacs.6b11751. - DOI - PubMed
    1. Arguello AE, DeLiberto AN, Kleiner RE. RNA chemical proteomics reveals the N(6)-methyladenosine (m(6)A)-regulated protein-RNA interactome. J Am Chem Soc. 2017;139:17249–17252. doi: 10.1021/jacs.7b09213. - DOI - PubMed
    1. Arif A, Jia J, Mukhopadhyay R, Willard B, Kinter M, Fox PL. Two-site phosphorylation of EPRS coordinates multimodal regulation of noncanonical translational control activity. Mol Cell. 2009;35:164–180. doi: 10.1016/j.molcel.2009.05.028. - DOI - PMC - PubMed
    1. Arif A, Terenzi F, Potdar AA, Jia J, Sacks J, China A, Halawani D, Vasu K, Li X, Brown JM, et al. EPRS is a critical mTORC1-S6K1 effector that influences adiposity in mice. Nature. 2017;542:357–361. doi: 10.1038/nature21380. - DOI - PMC - PubMed
    1. Arif A, Yao P, Terenzi F, Jia J, Ray PS, Fox PL. The GAIT translational control system. Wiley Interdiscip Rev RNA. 2018;9:e1441. doi: 10.1002/wrna.1441. - DOI - PMC - PubMed