. 2024 Jan 23;15(1):690.
doi: 10.1038/s41467-024-44901-3.

Folding pathway of a discontinuous two-domain protein

Affiliations

Folding pathway of a discontinuous two-domain protein

Ganesh Agam et al. Nat Commun. .

Abstract

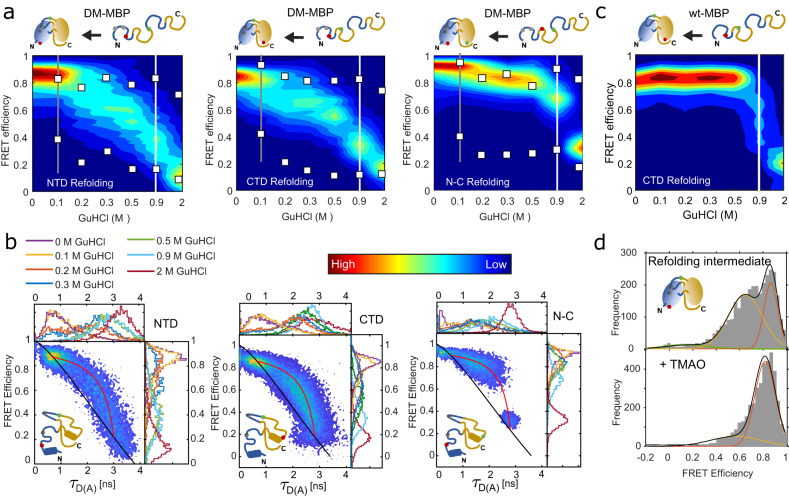
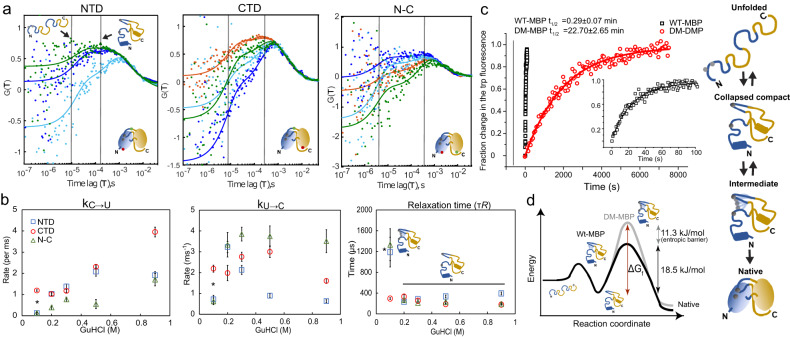
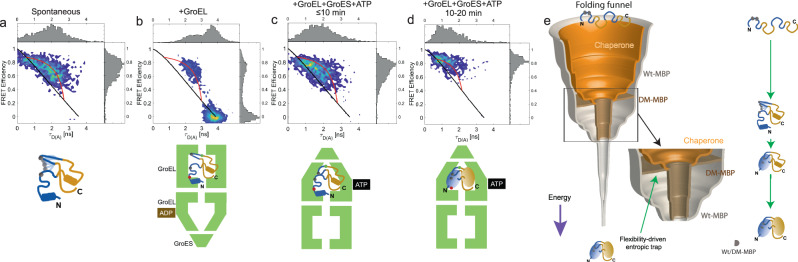
It is estimated that two-thirds of all proteins in higher organisms are composed of multiple domains, many of them containing discontinuous folds. However, to date, most in vitro protein folding studies have focused on small, single-domain proteins. As a model system for a two-domain discontinuous protein, we study the unfolding/refolding of a slow-folding double mutant of the maltose binding protein (DM-MBP) using single-molecule two- and three-color Förster Resonance Energy Transfer experiments. We observe a dynamic folding intermediate population in the N-terminal domain (NTD), C-terminal domain (CTD), and at the domain interface. The dynamic intermediate fluctuates rapidly between unfolded states and compact states, which have a similar FRET efficiency to the folded conformation. Our data reveals that the delayed folding of the NTD in DM-MBP is imposed by an entropic barrier with subsequent folding of the highly dynamic CTD. Notably, accelerated DM-MBP folding is routed through the same dynamic intermediate within the cavity of the GroEL/ES chaperone system, suggesting that the chaperonin limits the conformational space to overcome the entropic folding barrier. Our study highlights the subtle tuning and co-dependency in the folding of a discontinuous multi-domain protein.


Conflict of interest statement

The authors declare no competing interests.

Figures

Fig. 1
Fig. 1. Equilibrium unfolding-refolding two-color smFRET measurements on the DM-MBP NTD.
a A ribbon structure of MBP (PDB ID:1OMP) showing the NTD and CTD in blue and yellow, respectively with the discontinuous portion of the NTD being highlighted in orange. The upper schematic represents the domain boundaries and discontinuity in the MBP sequence for the NTD and CTD. The positions of the mutations V8G and Y283D are depicted as grey hexagons. The two residues of the folding mutations (V8G and Y283D, highlighted in dark grey) as well as the three labeling positions A52, K175, P298 (highlighted in green) for coupling the fluorescent dyes are indicated via a space-filling model. Tryptophan side-chains are highlighted using stick models in pink. b Protein unfolding/refolding measurements as a function of GuHCl concentration are shown for ensemble tryptophan fluorescence measurements on DM-MBP as well as for smFRET measurements for DM-MBP NTD from panel c. The tryptophan curves (circles) and average FRET efficiencies (pale squares) for unfolding and refolding titrations are depicted in blue and red, respectively. The lines are fits to a single or a double Boltzmann function with a single function being used for the tryptophan experiments and smFRET efficiency unfolding measurements, and a double Boltzmann function is used for the smFRET refolding measurements. For measurements of the tryptophan fluorescence, the sample was first equilibrated for 20 hours. For the single-molecule experiments, the sample was allowed to equilibrate for 2 hours (after which, no change in the smFRET histograms were observed) and then measured for 2−6 hours. Data are presented as mean values +/− SD derived from at least three independent experiments. c SmFRET histograms and Gaussian fits for DM-MBP NTD unfolding (left) and refolding (right) titrations at the indicated denaturant concentrations. Each underlying population is highlighted with a dotted line. The native or refolded state is shown in green, intermediate populations are shown in orange and in yellow, and the completely unfolded state is shown in magenta (1.5 M GuHCl) and violet (2 M GuHCl).
Fig. 2
Fig. 2. A conformational search during DM-MBP refolding is the cause for the entropic barrier governing unfolding/refolding hysteresis.
a Equilibrium refolding of the DM-MBP NTD, CTD and N-C interface displayed as waterfall plots of FRET Efficiency versus GuHCl concentration. The burst-averaged FRET efficiencies were compared with the FRET efficiencies obtained from the two donor lifetime components determined from a fit to the photons detected from all bursts (white squares) (Table S4). A grey line is shown at 0.1 M GuHCl concentration where the NTD and N-C interface constructs exhibit a mostly refolded conformation, whereas a substantial fraction of molecules for the CTD construct are still in the intermediate population. A white line separates the 0.9 M GuHCl measurement from the higher denaturant concentrations. b 2D-plots of FRET efficiency vs donor lifetime in the presence of an acceptor (τD(a)) (E-τ plot) is shown for the DM-MBP NTD, CTD and N-C experiments at all GuHCl concentrations displayed in panel A. The static-FRET line and a dynamic-FRET line for the measurement at 0.9 M GuHCl are shown in black and red, respectively (See Supplementary Note 2 for details). The color legend for occurrences for both panels A and B is shown in between the two panels. c A waterfall plot of FRET efficiency versus GuHCl concentration is shown for equilibrium refolding measurements of the CTD of WT-MBP. A white line separates the measurements below and above 0.9 M GuHCl concentration, a concentration below which the dynamic intermediate population is significantly populated during DM-MBP refolding. Contrary to the refolding traces of the NTD, CTD, and the N-C interface for DM-MBP, an intermediate population is not clearly visible for WT-MBP refolding. d The influence of the chemical chaperone trimethylamine-N-oxide (TMAO). Upper panel: A smFRET histogram for DM-MBP NTD refolding in 0.2 M GuHCl, where a significant fraction of the intermediate population (yellow) is observed compared to the unfolded (green) and refolded states (orange). Lower panel: A smFRET histogram for NTD refolding in 0.2 M GuHCl where 500 mM TMAO has been added. The unfolded state is no longer visible and the intermediate population has diminished (yellow vs orange).
Fig. 3
Fig. 3. Quantification of the entropic energy barrier.
a A cross-correlation analysis using filtered FCS on all the three DM-MBP constructs of NTD, CTD and N-C interface measured in 0.2 M (red), 0.3 M (blue), 0.5 M (green) and 0.9 M (cyan) GuHCl concentrations was performed. For clarity, only one of the two cross-correlation functions (CCFs) is shown. The CCFs at different GuHCl concentrations were fit globally for each construct (Table S5). Due to the fast refolding of the NTD at 0.2 M GuHCl, fluctuations are minimal and the FCS data have been omitted in the global fits for this construct. b Interconversion rates between the unfolded and collapsed compact conformations extracted from a dynamic PDA analysis during NTD refolding (blue squares), CTD refolding (red circle) and for the formation of the N-C interface (green triangle). The apparent refolding rate (kC->U, left), apparent unfolding rate (kU->C, middle) and the relaxation time (right) are plotted for all the three constructs of DM-MBP measured in 0.1, 0.2, 0.3, 0.5, 0.9 M GuHCl. The rates measured in 0.1 M GuHCl (*) were used to calculate the free energy change in panel d. The obtained rates are the mean values of the fit to the model function and the errors give the 95% confidence intervals determined from the fit. c The kinetics of WT-MBP (black squares) and DM-MBP (red circles) refolding monitored by the increase in tryptophan fluorescence. The initial fluorescence at time t = 0 was subtracted from the subsequent data points. 3 µM MBP was denatured in 3 M GuHCl for 1 h at 50 °C before being diluted 75-fold in buffer A to start the refolding reaction (at t = 0, the final concentrations were ~40 nM of MBP and 40 mM of GuHCl). Data were fitted using a single exponential function. The fit to the WT-MBP refolding kinetics is shown in the inset for the clarity. The presented data is from a single measurement representative of three independent measurements. The given rates are the mean +/- SD from the repeats. d A schematic showing the Gibbs free energy versus reaction coordinate where an additional energy barrier of 11.3 kJ/mol is imposed for the refolding of DM-MBP.
Fig. 4
Fig. 4. Three-color smFRET demonstrating the co-existence of an intermediate population and correlative refolding.
a Structure of MBP (PDB ID:1OMP; NTD in yellow, CTD in blue) showing the accessible volumes available for Atto488 (blue), Atto565 (green) and Alexa647 (red) at the labeling positions A52, K175 and P298, respectively. b-c Waterfall plots of FRET efficiency versus GuHCl concentration to visualize the conformational changes during equilibrium unfolding b and refolding c of triple-labeled DM-MBP. The left panels show the smFRET histograms for the NTD (BG), the middle panels show the smFRET histograms for the CTD (GR) and the right panels show the smFRET histograms for the N-C interface (BR). The white line separates the 0.9 M GuHCl measurement from the higher denaturant concentrations. d A comparison of the three-color smFRET histograms for molecules measured in 0.1−0.5 M GuHCl concentrations in the native-like conformation (E > 0.9) for one FRET pair compared to the smFRET histograms of refolded protein for the respective FRET pair in the three-color measurement (green). The smFRET histogram of all molecules measured between 0.1 and 0.5 M GuHCl is shown in black with molecules selected with E > 0.9 are highlighted in grey. The corresponding smFRET efficiency histograms of the selected molecules for the other two FRET pairs are shown in orange. Histograms for the NTD (GR) are on the left, for the CTD in the middle and for the N-C interface on the right. Molecules selected for folded NTD are shown in the top row, for folded CTD in the middle row and for a native-like N-C interface in the bottom row.
Fig. 5
Fig. 5. The influence of GroEL and GroEL/ES/ATP on the folding landscape of DM-MBP.
ad 2D FRET efficiency vs donor lifetime (τD(a)) histograms (E-τ plot) of the NTD during refolding in 0.1 M GuHCl. The refolding of the NTD is shown for a spontaneous refolding, b in presence of 3 µM GroEL, and (cd) upon the addition of 3 µM GroEL, 6 µM GroES and 2 mM ATP. Only the initial 10 minutes of all the three measurements are shown for (ac) and between 10 and 20 min for (d). Above and to the right, 1-D projections are shown. The static-FRET line (black) and a dynamic-FRET line (red) are plotted for comparison. The end points for the dynamic FRET line were determined by fitting the subensemble donor fluorescence lifetimes to a biexponential. The schematic below each panel illustrates the experiment and the conformation of GroEL during the folding cycle. e A schematic of the protein-folding funnel describing the refolding of WT-MBP, DM-MBP and the role of chaperones on the folding energy landscape. In the case of WT-MBP (grey), the NTD is guided by hydrophobic interactions and folds first followed by CTD folding. In the case of DM-MBP (brown), NTD folding is delayed by the high configurational entropy generated by the loss of binding energy due to less hydrophobic mutations. As soon as the NTD finds its folding competent conformation in DM-MBP, the CTD folds along the folding funnel as for WT-MBP. Chaperones shape the protein folding funnel (beige) by restricting the conformational space available to the substrate, thereby guiding the protein towards the correct conformation and thereby accelerating the refolding rate.

Similar articles

Cited by

References

    1. Sela M, White FH, Anfinsen CB. Reductive cleavage of disulfide bridges in ribonuclease. Science. 1957;125:691–692. doi: 10.1126/science.125.3250.691. - DOI - PubMed
    1. Schuler B, Lipman EA, Eaton WA. Probing the free-energy surface for protein folding with single-molecule fluorescence spectroscopy. Nature. 2002;419:743–747. doi: 10.1038/nature01060. - DOI - PubMed
    1. Teichmann SA, Parkt J, Chothia C. Structural assignments to the Mycoplasma genitalium proteins show extensive gene duplications and domain rearrangements. Proc. Natl Acad. Sci. USA. 1998;95:14658–14663. doi: 10.1073/pnas.95.25.14658. - DOI - PMC - PubMed
    1. Han JH, Batey S, Nickson AA, Teichmann SA, Clarke J. The folding and evolution of multidomain proteins. Nat. Rev. Mol. Cell Biol. 2007;8:319–330. doi: 10.1038/nrm2144. - DOI - PubMed
    1. Batey S, Clarke J. The Folding Pathway of a Single Domain in a Multidomain Protein is not Affected by Its Neighbouring Domain. J. Mol. Biol. 2008;378:297–301. doi: 10.1016/j.jmb.2008.02.032. - DOI - PMC - PubMed

Substances