. 2024 Jan 23;14(1):1999.
doi: 10.1038/s41598-024-51550-5.

Fourier transform-based method for quantifying the three-dimensional orientation distribution of fibrous units

Affiliations

Fourier transform-based method for quantifying the three-dimensional orientation distribution of fibrous units

Riccardo Alberini et al. Sci Rep. .

Abstract

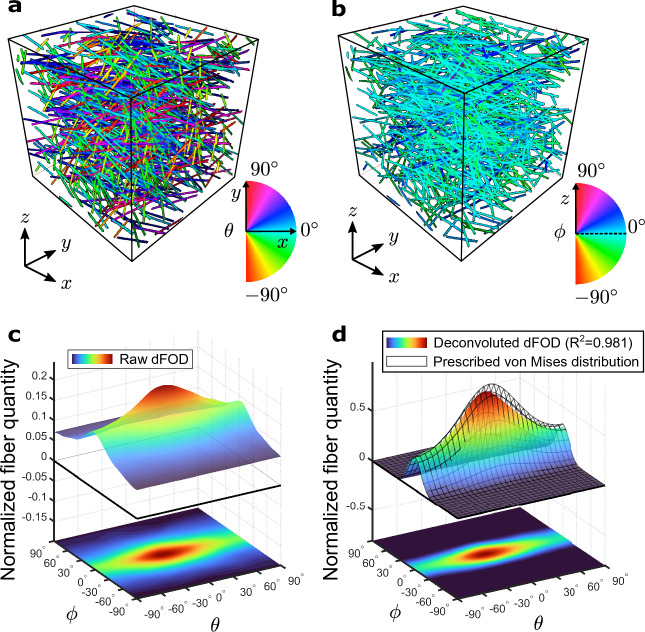
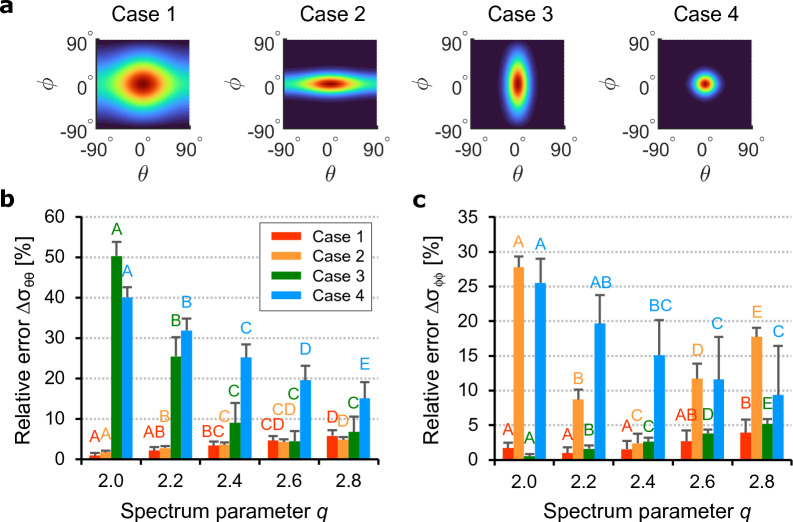
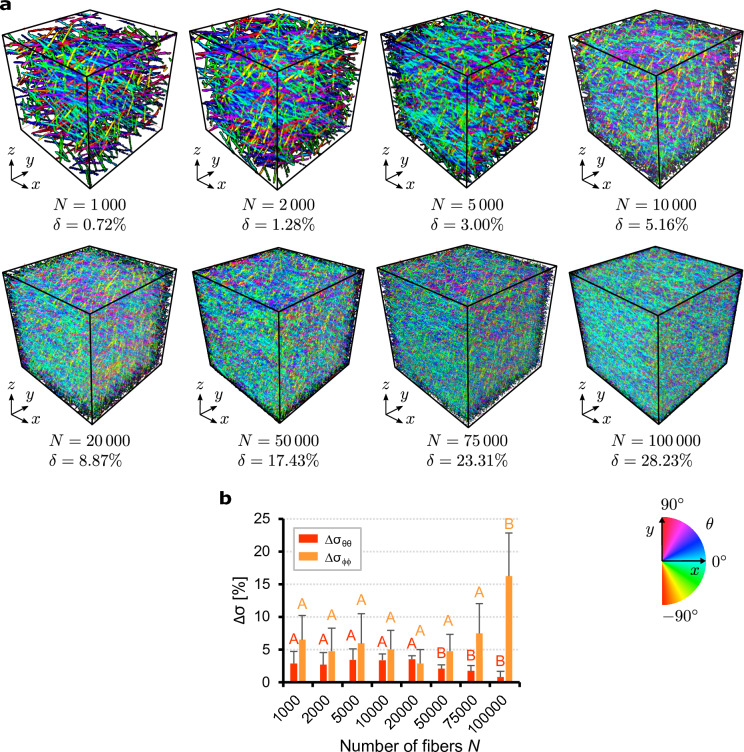
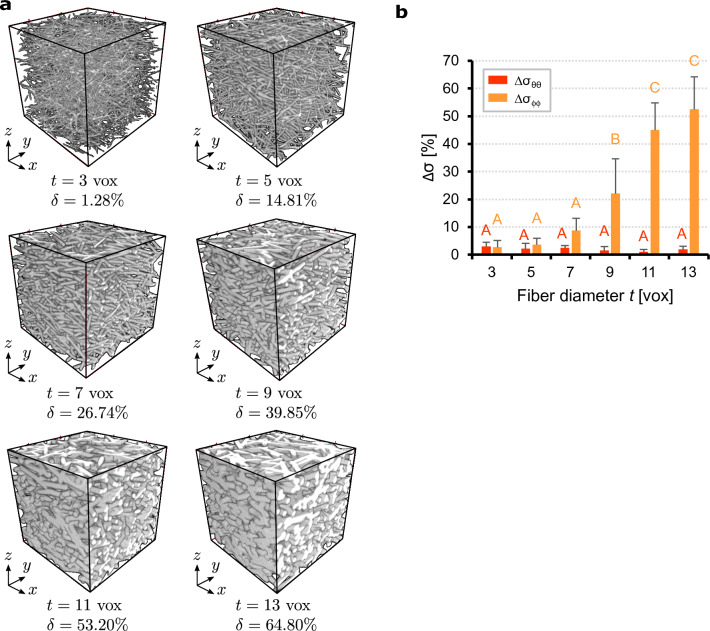
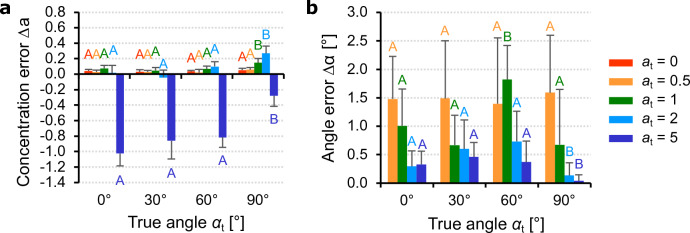
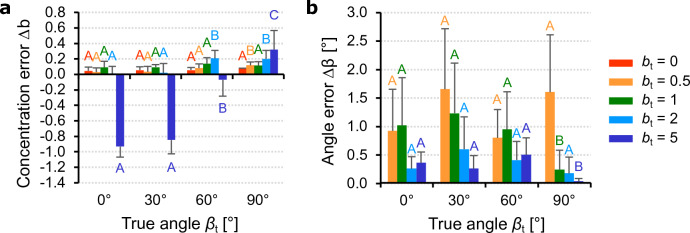
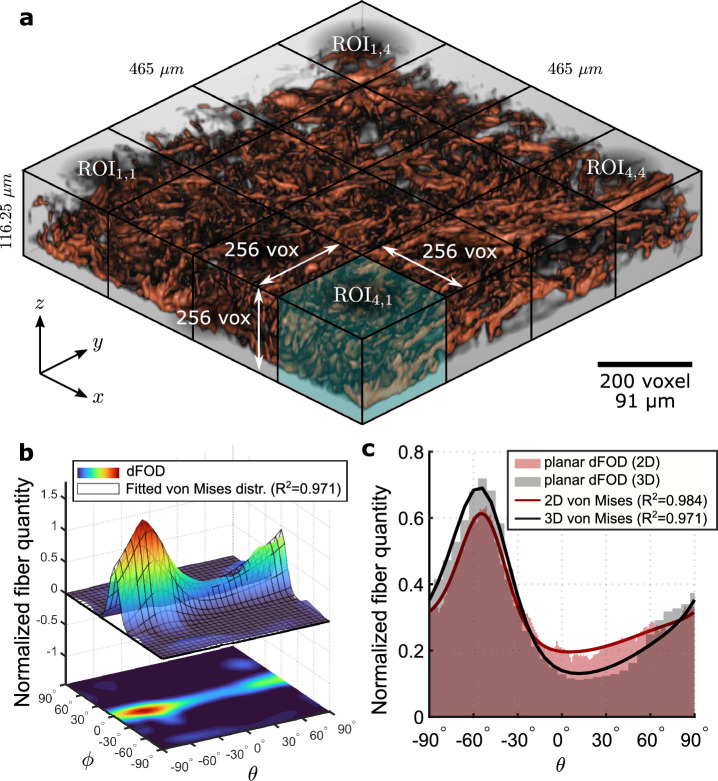
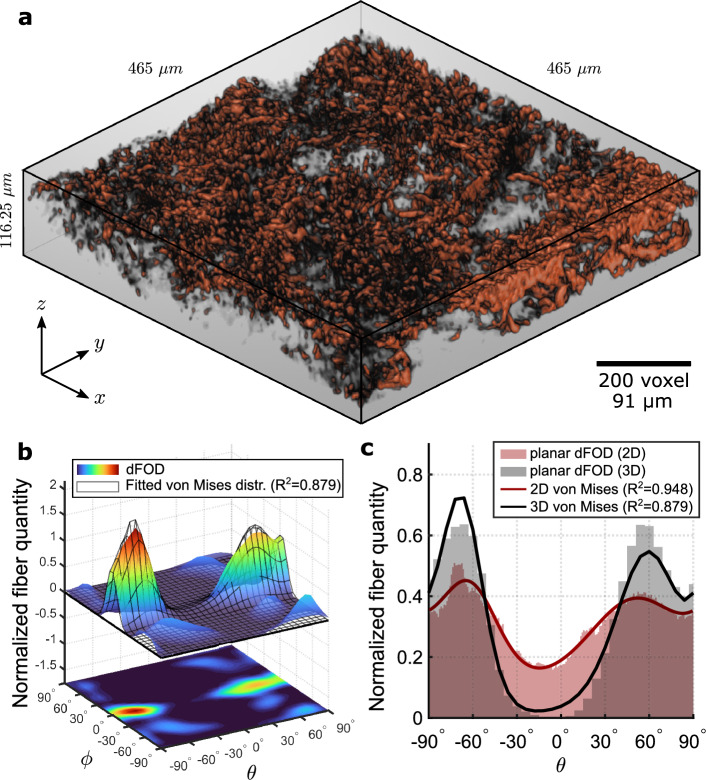
Several materials and tissues are characterized by a microstructure composed of fibrous units embedded in a ground matrix. In this paper, a novel three-dimensional (3D) Fourier transform-based method for quantifying the distribution of fiber orientations is presented. The method allows for an accurate identification of individual fiber families, their in-plane and out-of-plane dispersion, and showed fast computation times. We validated the method using artificially generated 3D images, in terms of fiber dispersion by considering the error between the standard deviation of the reconstructed and the prescribed distributions of the artificial fibers. In addition, we considered the measured mean orientation angles of the fibers and validated the robustness using a measure of fiber density. Finally, the method is employed to reconstruct a full 3D view of the distribution of collagen fiber orientations based on in vitro second harmonic generation microscopy of collagen fibers in human and mouse skin. The dispersion parameters of the reconstructed fiber network can be used to inform mechanical models of soft fiber-reinforced materials and biological tissues that account for non-symmetrical fiber dispersion.


Conflict of interest statement

The authors declare no competing interests.

Figures

Figure 1
Figure 1
Application of the 3D discrete Fourier transform algorithm: (a,b) maps of the azimuthal and elevation angles (θ,ϕ) of a representative artificial fiber dispersion with N=1000 fibers of t=3 voxel diameter. The prescribed von Mises distribution parameters are α=β=γ=0, a=0.5, b=5 (n=1); (c) corresponding raw dFOD (discrete fiber orientation distribution) d(θ,ϕ) discretized with D=31 angular intervals (5.8 angular resolution) and spectrum parameter q=2.4; (d) deconvoluted dFOD d(θ,ϕ), with overlapping prescribed von Mises distribution ρ¯ (wire-frame plot).
Figure 2
Figure 2
Algorithm calibration: (a) contour plots of the prescribed bivariate von Mises distributions (n=1, α=β=γ=0). Case 1: a=0.5, b=0.5; Case 2: a=0.5, b=5; Case 3 a=5, b=0.5; Case 4 a=5, b=5. Relative errors between the standard deviation of the measured dFOD (discrete fiber orientation distribution) and the prescribed distribution (mean and standard deviation of 10 images); (b) error Δσθθ along the azimuthal direction θ for different power parameters q; (c) error Δσϕϕ along the elevation direction ϕ for different q. Means not sharing uppercase letters differ significantly by the Tukey-test at the 5% significance level. Letters must be compared among the same cases.
Figure 3
Figure 3
Influence of fiber number: (a) maps of the azimuthal angle θ of 8 representative artificial fiber stacks (256×256×256 voxels), with N=1000, 2000, 5000, 10000, 20000, 50000, 75000, 100000 fibers of diameter t=3 voxels, and distribution parameters a=0.5, b=5, α=β=γ=0; (b) relative errors Δσθθ and Δσϕϕ between the standard deviations of the measured dFOD (discrete fiber orientation distribution) and the prescribed distribution (mean and standard deviation of 10 images). Means that do not use capital letters differ significantly by the Tukey-test at the 5% significance level. Letters must be compared in the same cases.
Figure 4
Figure 4
Influence of fiber diameter: (a) representative artificial fiber stacks (256×256×256 voxels), generated with N=2000 fibers and diameters of 3, 5, 7, 9, 11 and 13 voxels. Distribution parameters: a=0.5, b=5, α=β=γ=0; (b) relative errors Δσθθ and Δσϕϕ between the standard deviations of the measured dFOD (discrete fiber orientation distribution) and the prescribed distribution (mean and standard deviation of 10 images). Means not sharing uppercase letters differ significantly by the Tukey-test at the 5% significance level. Letters must be compared among the same cases.
Figure 5
Figure 5
Algorithm precision for in-plane parameters. Errors between the estimated (subscript e) and true (subscript t) in-plane parameters (mean and standard deviation of 10 images): (a) error in the in-plane concentration Δa=ae-at; (b) error in the in-plane angle Δα=|αe-αt| (isotropic case at=0 omitted). Means not sharing uppercase letters differ significantly by the Tukey-test at the 5% significance level. Letters must be compared within the same concentration at.
Figure 6
Figure 6
Algorithm precision for out-of-plane parameters. Errors between the estimated (subscript e) and true (subscript t) out-of-plane parameters (mean and standard deviation of 10 images): (a) error in the out-of-plane concentration Δb=be-bt; (b) error in the out-of-plane angle Δβ=|βe-βt| (isotropic case bt=0 omitted). Means not sharing uppercase letters differ significantly by the Tukey-test at the 5% significance level. Letters must be compared within the same concentration bt.
Figure 7
Figure 7
Collagen dFOD (discrete fiber orientation distribution) in human skin: (a) SHG (second harmonic generation) tomography of human skin collagen fibers and subdivision of the volume into cubic ROIs; (b) 3D surface plot and its projected contour on the θ-ϕ plane of the dFOD. The wire-frame plot represents the fitted distribution ρ¯ using two bivariate von Mises functions (a1=2.34, b1=6.15, α1=-54.39, β1=-4.33, γ1=-8.22, νf,1=0.44, a2=0.38, b2=12.45, α2=90, β2=-0.35, γ2=0.84, νf,2=0.56). (c) Comparison of the planar dFOD derived from the 3D discrete Fourier transform and the 2D discrete Fourier transform algorithm (a1=3.46, α1=-53.59, νf,1=0.26, a2=0.19, α2=90, νf,2=0.74).
Figure 8
Figure 8
Collagen dFOD (discrete fiber orientation distribution) in mouse skin: (a) collagen fiber SHG (second harmonic generation) tomography of mouse skin; (b) 3D surface plot and its projected contour on the θ-ϕ plane of the dFOD. The wire-frame plot represents the fitted distribution ρ¯ using two bivariate von Mises functions (a1=3.93, b1=11.09, α1=-67.74, β1=0.05, γ1=-17.73, νf,1=0.44, a2=1.83, b2=9.61, α2=58.85, β2=-4.32, γ2=7.22, νf,2=0.56). (c) Comparison of the planar dFOD derived from the 3D discrete Fourier transform and the 2D discrete Fourier transform algorithm (a1=2.17, α1=-62.05, νf,1=0.29, a2=0.64, α2=50.64, νf,2=0.71).
Figure 9
Figure 9
Schematic representation of the orientation of the unit fiber N (in black), the global basis {Ea}a=1,2,3 (in blue) and the principal basis {M, Mip, Mop} (in red): (a) unit vector N in the principal frame; (b) unit vector N in the global basis; (c) rotation of the principal basis with respect to the global basis using the Tait-Bryan angles. Dashed vectors represent Mip and Mop before the rotation about M.
Figure 10
Figure 10
Illustration of the 3D discrete Fourier transform algorithm: (a) signal g(xyz) of a 256×256×256 representative image in the discrete spatial domain with N=14 fibers aligned to (θ,ϕ)=(60,60); (b) center-shifted spectrum |g^(u,v,w)| in the frequency domain, with a sketch of the overlapping funnel filter sampling the frequencies associated with the fibers with orientations within the cone, shown in (a), with mean direction (θ,ϕ)=(60,60) and opening ε; (c) cross section of the filter in the local v-w plane at u=128. The filter is axisymmetric about the direction (θ,ϕ) (note that the symmetry axis shown is slightly skewed with respect to the v-w plane); (d) raw dFOD (discrete fiber orientation distribution) of the representative fiber dispersion shown in (a) using q=2.4, and D=31, corresponding to an angular resolution of Δθ=Δϕ=5.8 (ε is taken to be equal to Δθ=Δϕ).

Similar articles

Cited by

References

    1. Brenken B, Barocio E, Favaloro A, Kunc V, Pipes RB. Fused filament fabrication of fiber-reinforced polymers: A review. Addit. Manuf. 2018;21:1–16. doi: 10.1016/j.addma.2018.01.002. - DOI
    1. Bosnjak N, Wang S, Han D, Lee H, Chester SA. Modeling of fiber-reinforced polymeric gels. Mech. Res. Commun. 2019;96:7–18. doi: 10.1016/j.mechrescom.2019.02.002. - DOI
    1. Chen Z, et al. An anisotropic constitutive model for 3D printed hydrogel-fiber composites. J. Mech. Phys. Solids. 2021;156:104611. doi: 10.1016/J.JMPS.2021.104611. - DOI
    1. Eghbali R, Narooei K. A hyperelastic-damage model to study the anisotropic mechanical behavior of coral-hydrogel bio-composite. J. Mech. Behav. Biomed. Mater. 2022;126:105054. doi: 10.1016/j.jmbbm.2021.105054. - DOI - PubMed
    1. Redon C, Chermant L, Coster J. Assessment of fibre orientation in reinforced concrete using Fourier image transform. J. Microsc. 1998;191:258–265. doi: 10.1046/j.1365-2818.1998.00393.x. - DOI - PubMed