. 2024 Jan 23;10(1):41.
doi: 10.1038/s41420-023-01770-x.

Non-alcoholic fatty liver disease promotes liver metastasis of colorectal cancer via fatty acid synthase dependent EGFR palmitoylation

Affiliations

Non-alcoholic fatty liver disease promotes liver metastasis of colorectal cancer via fatty acid synthase dependent EGFR palmitoylation

Chi Zhang et al. Cell Death Discov. .

Abstract

Liver metastasis is the major reason for most of colorectal cancer (CRC) related deaths. Accumulating evidence indicates that CRC patients with non-alcoholic fatty liver disease (NAFLD) are at a greater risk of developing liver metastasis. With the growing prevalence of NAFLD, a better understanding of the molecular mechanism in NAFLD-driven CRC liver metastasis is needed. In this study, we demonstrated that NAFLD facilitated CRC liver metastasis as a metabolic disorder and promoted the stemness of metastatic CRC cells for their colonization and outgrowth in hepatic niches. Metabolically, the lipid-rich microenvironment in NAFLD activated de novo palmitate biosynthesis in metastatic CRC cells via upregulating fatty acid synthase (FASN). Moreover, increased intracellular palmitate bioavailability promoted EGFR palmitoylation to enhance its protein stability and plasma membrane localization. Furthermore, we demonstrated that the FDA-approved FASN inhibitor orlistat could reduce NAFLD-activated endogenous palmitate production, thus inhibiting palmitoylation of EGFR to suppress CRC cell stemness and restrict liver metastasis in synergy with conventional chemotherapy. These findings reveal that the NAFLD metabolic microenvironment boosts endogenous palmitate biosynthesis in metastatic CRC cells and promotes cell stemness via EGFR palmitoylation, and FASN inhibitor orlistat could be a candidate adjuvant drug to suppress liver metastasis in CRC patients with NAFLD.


Conflict of interest statement

The authors declare no competing interests.

Figures
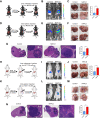
Fig. 1
Fig. 1. NAFLD promotes liver metastasis of CRC.
AC Schematics illustrating the experimental liver metastasis model established via liver orthotopic implantation in C57BL/6 mice (A). In vivo bioluminescent images of luc-MC38 cells implanted in the liver of control and NAFLD C57BL/6 mice at day 14 after implantation (B). At the end of the experiment, liver metastases were taken photos and metastatic lesion volume was assessed (C). DG Schematics illustrating the experimental liver metastasis model established via splenic implantation in C57BL/6 mice (D). In vivo bioluminescent images of luc-MC38 cells injected in the spleen of control and NAFLD C57BL/6 mice at day 14 after implantation (E). At the end of the experiment, liver metastases were dissected for taking photos, H&E staining and assessing tumor area (F, G). HJ Schematics illustrating the experimental liver metastasis model via liver orthotopic implantation in BALB/c nude mice (H). In vivo bioluminescent images of luc-HCT 116 cells implanted in the liver of control and NAFLD nude mice day 14 after implantation (I). At the end of the experiment, liver metastases were taken photos and assess metastatic lesion volume (J). KN Schematics illustrating the experimental liver metastasis model via splenic implantation in BALB/c nude mice (K). In vivo bioluminescent images of luc-HCT 116 cells injected in the spleen of control and NAFLD nude mice at day 14 after implantation (L). At the end of the experiment, liver metastases were dissected for taking photos, H&E staining and assessing tumor area (M, N). Data are presented as mean ± SEM. Significance was determined by two-tailed unpaired Student’s t test, *p < 0.05, **p < 0.01, ***p < 0.001, ****p < 0.0001. NAFLD non-alcoholic fatty liver disease, HFD high-fat diet, luc-HCT 116 cells Luciferase-labeled HCT 116 cells, luc-MC38 cells Luciferase-labeled MC38 cells.
Fig. 2
Fig. 2. NAFLD promotes the stemness properties of liver metastatic CRC cells.
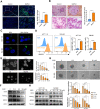
A Representative immunofluorescence images for CD44 and CD133 (red) expression of MC38 allografts in control and NAFLD mice with intrahepatic implantation. DAPI (blue) to mark nucleus. Scale bars, 20 μm. Right, quantification of the results (n = 5). B Representative IHC staining images for Oct4, Nanog and SOX2 of MC38 allografts in control and NAFLD mice with intrahepatic implantation. Scale bars, 50 μm. Below, quantification of the results (n = 5). C Sphere formation assay on tumor cells isolated from HCT 116 xenografts in control and NAFLD mice. Representative photos of HCT 116 sphere in the second passage were taken on day 10 after cells were seeded (scale bars, 200 μm), and sphere numbers and diameters were determined and plotted (n = 3). D The protein level of CSC markers Oct4, Nanog and SOX2 of HCT 116 xenografts in control and NAFLD mice by western blot assay (n = 5). E Sphere formation assay on HCT 116 and SW 480 cells treated with BSA-PA/OA at indicated concentrations (PA 0 µM, OA 0 µM; PA 50 µM, OA 100 µM; PA 100 µM, OA 200 µM; PA 200 µM, OA 400 µM, respectively). Representative photos of sphere in the second passage were taken on day 10 after cells were seeded (scale bars, 100 μm), and sphere numbers and diameters were determined and plotted (n = 3). F Protein level of CSC markers of HCT 116 and SW 480 cells treated with BSA-PA/OA at different concentrations (PA 0 µM, OA 0 µM; PA 50 µM, OA 100 µM; PA 100 µM, OA 200 µM; PA 200 µM, OA 400 µM, respectively) detected by western blot assay. G In vitro limiting dilution analysis for frequency of CSCs in HCT 116 cells treated with BSA or BSA-PA/OA, calculated with Extreme Limiting Dilution Analysis software (http://bioinf.wehi.edu.au/software/elda/). Data are presented as mean ± SEM. Significance was determined by two-tailed unpaired Student’s t test (AC), one-way ANOVA (E) and Pairwise test (G), *p < 0.05, **p < 0.01, ***p < 0.001, ****p < 0.0001. NAFLD non-alcoholic fatty liver disease, BSA bovine serum albumin, PA palmitic acid, OA oleic acid.
Fig. 3
Fig. 3. NAFLD promotes metastatic CRC cell stemness in a palmitoylation-dependent manner.
A Representative fluorescence imaging of BODIPY 493/503 staining (green), and corresponding quantification data in MC38 allografts in control and NAFLD mice (n = 5). Nuclei were stained with DAPI (blue). scale bars, 50 μm. B Representative imaging of Oil Red O staining, and corresponding quantification data in MC38 allografts in control and NAFLD mice (n = 5). scale bars, 100 μm. C Representative fluorescence imaging of BODIPY 493/503 staining (green) in HCT 116 and SW 480 cells treated with BSA or BSA-PA/OA (PA 100 μM, OA 200 μM) for 36 h. Nuclei were stained with DAPI (blue). scale bars, 5 μm. D Representative quantitative plots of the histogram (left) and MFI (right) of BODIPY 493/503 staining in HCT 116 and SW 480 cells treated with BSA or BSA-PA/OA (PA 100 μM, OA 200 μM) for 36 h. E Sphere formation assay on tumor cells isolated from HCT 116 xenografts in NAFLD mice and exposed to indicated concentrations of 2-BP. Representative images of sphere in second passage were taken on day 10 after cells were seeded (scale bars, 200 μm), and sphere numbers and diameters were determined and plotted (n = 3). F The protein level of CSC markers Oct4, Nanog and SOX2 of indicated concentrations of 2-BP treated tumor cells isolated from HCT 116 xenografts in NAFLD mice by western blot assay. G Sphere formation assay in HCT 116 and SW480 cells treated with BSA-PA/OA (PA 100 μM, OA 200 μM) and indicated concentrations of 2-BP. Representative images of sphere in second passage were taken on day 10 after cells were seeded (scale bars, 100 μm), and sphere numbers and diameters were determined and plotted (n = 3). H The protein level of CSC markers Oct4, Nanog and SOX2 of in HCT 116 and SW 480 cells treated with BSA-PA/OA (PA 100 μM, OA 200 μM) and 2-BP at indicated doses for 24 h by western blot assay. Data are presented as mean ± SEM. Significance was determined by two-tailed unpaired Student’s t test (A, B, D) and one-way ANOVA (E, G), *p < 0.05, **p < 0.01, ***p < 0.001, ****p < 0.0001. NAFLD non-alcoholic fatty liver disease, BSA bovine serum albumin, PA palmitic acid, OA oleic acid, MFI mean fluorescence intensity, 2-BP 2-bromopalmitate.
Fig. 4
Fig. 4. EGFR palmitoylation critically contributes to metastatic CRC cell stemness in NAFLD.
A Representative images of IHC staining for EGFR of MC38 allografts in control and NAFLD mice. Scale bars, 50 μm. B The protein level of EGFR of HCT 116 xenografts in control mice and NAFLD mice by western blot assay (n = 5). C The protein level of EGFR in HCT 116 and SW 480 cells treated with or without BSA-PA/OA (PA 100 µM, OA 200 µM) at indicated time points by western blot assay. D The protein level of EGFR in HCT 116 and SW 480 cells treated with or without BSA-PA/OA at indicated doses for 36 h by western blot assay (-PA 0 µM, OA 0 µM; PA 50 µM, OA 100 µM; PA 100 µM, OA 200 µM; PA 200 µM, OA 400 µM, respectively). E The palmitoylation level of EGFR in HCT 116 and SW480 cells treated with or without BSA-PA/OA (PA 100 µM, OA 200 µM) for 24 h by acyl-biotin exchange assay. F The palmitoylation level of EGFR in HCT 116 xenografts in control mice and NAFLD mice by acyl-biotin exchange assay. G The palmitoylation level of EGFR in HCT 116 and SW480 cells treated with BSA-PA/OA (PA 100 µM, OA 200 µM) and/or 2-BP (50 µM) by acyl-biotin exchange assay. H The protein level of EGFR in HCT 116 and SW480 cells treated with BSA-PA/OA (PA 100 µM, OA 200 µM) and 2-BP at indicated concentrations for 24 h by western blot assay. I The palmitoylation level of EGFR in in control cells (EGFR-WT) and EGFR palmitoylation deficient mutant cells (EGFR-9CS) treated with BSA-PA/OA (PA 100 µM, OA 200 µM) by acyl-biotin exchange assay. J The protein level of CSC markers Oct4, Nanog and SOX2 in control cells (EGFR-WT) and EGFR palmitoylation deficient mutant cells (EGFR-9CS) treated with BSA-PA/OA (PA 100 µM, OA 200 µM) for 36 h by western blot assay. K Sphere formation assay on control cells (EGFR-WT) and EGFR palmitoylation deficient mutant cells (EGFR-9CS) treated with BSA-PA/OA (PA 100 µM, OA 200 µM). Representative photos of sphere in second passage were taken on day 10 after cells were seeded (scale bars, 100 μm), sphere numbers and diameters were determined and plotted (n = 3). Data are presented as mean ± SEM. Significance was determined by two-tailed unpaired Student’s t test, *p < 0.05, **p < 0.01, ***p < 0.001, ****p < 0.0001. BSA bovine serum albumin, PA palmitic acid, OA oleic acid, 2-BP 2-bromopalmitate.
Fig. 5
Fig. 5. Palmitoylation promotes EGFR stabilization and plasma membrane localization in NAFLD liver metastatic CRC cells.
A HCT 116 and SW 480 cells treated with or without BSA-PA/OA (PA 100 µM, OA 200 µM) were incubated with cycloheximide (CHX) (25 μg/ml) and analyzed by western blot at the indicated time points. Right, quantification of the results (n = 3). B HCT 116 and SW480 cells treated with or without BSA-PA/OA (PA 100 µM, OA 200 µM) were incubated with EGF (25 µg/ml) and analyzed by western blot at the indicated time points. Right, quantification of the results (n = 3). C HCT 116 and SW 480 cells treated with or without BSA-PA/OA (PA 100 µM, OA 200 µM) were incubated with 25 μg/ml CHX and 5 µM MG132 and analyzed by western blot at the indicated time points. Right, quantification of the results (n = 3). D HCT 116 and SW 480 cells treated with or without BSA-PA/OA (PA 100 µM, OA 200 µM) were incubated with 25 μg/ml CHX and 250 µM NH4Cl and analyzed by western blot at the indicated time points. Right, quantification of the results (n = 3). E Representative immunofluorescence images for EGFR (red), LAMP1 (green), and DAPI (blue) of HCT 116 cells treated with or without BSA-PA/OA (PA 100 µM, OA 200 µM). Scale bars, 5 μm. Intensity profiles of LAMP1 (green lines) and EGFR (red lines) co-localization signal were shown in plotted lines at three random sites. F Representative immunofluorescence images for EGFR (red), F-actin (green), and DAPI (blue) of HCT 116 cells treated with or without BSA-PA/OA (PA 100 µM, OA 200 µM). Scale bars, 10 μm. Data are presented as mean ± SEM. NAFLD non-alcoholic fatty liver disease, BSA bovine serum albumin, PA palmitic acid, OA oleic acid, MFI mean fluorescence intensity, 2-BP 2-bromopalmitate, FASN fatty acid synthases, CHX cycloheximide.
Fig. 6
Fig. 6. NAFLD promotes EGFR palmitoylation via activating de novo palmitate biosynthesis in metastatic CRC cells.
A Representative images of IHC staining for FASN of MC38 allografts in control and NAFLD mice. Scale bars, 50 μm. B The protein level of FASN in HCT 116 and SW 480 cells treated with or without BSA-PA/OA at indicated doses (PA 0 µM, OA 0 µM; PA 50 µM, OA 100 µM; PA 100 µM, OA 200 µM; PA 200 µM, OA 400 µM, respectively) by western blot assay. C Representative fluorescence imaging of BODIPY 493/503 staining (green) in HCT 116 and SW 480 cells treated with BSA-PA/OA (PA 100 µM, OA 200 µM) and/or 10 µM orlistat. Nuclei were stained with DAPI (blue). D Representative quantitative plots of the histogram (left) and MFI (right) of BODIPY 493/503 staining in BSA-PA/OA (PA 100 µM, OA 200 µM) incubated HCT 116 and SW 480 cells treated with or without 10 µM orlistat. E The palmitoylation level of EGFR in HCT 116 and SW480 cells treated with or without BSA-PA/OA (PA 100 µM, OA 200 µM) and 10 µM orlistat by acyl-biotin exchange assay. F The protein level of EGFR in HCT 116 and SW480 cells treated with BSA-PA/OA (PA 100 µM, OA 200 µM) and indicated concentrations of orlistat by western blot assay. G Representative immunofluorescence images for EGFR (red), LAMP1 (green), and DAPI (blue) of BSA-PA/OA (PA 100 µM, OA 200 µM) treated HCT116 cells incubated with or without 10 µM orlistat. Scale bars, 10 μm. Intensity profiles of LAMP1 (green lines) and EGFR (red lines) co-localization signal were shown in plotted lines at three random sites. H Left, the degradation of EGFR treated with BSA-PA/OA (PA 100 µM, OA 200 µM) in HCT 116 cells was evaluated by CHX-chase assay in the presence of orlistat and/or inhibitors for proteasome MG132 and lysosome NH4Cl. Right, quantification of the intensity determined by the relative level of EGFR remaining (n = 3). I Left, the degradation of EGFR treated with BSA-PA/OA (PA 100 µM, OA 200 µM) in HCT 116 cells was evaluated by CHX-chase assay in the presence of orlistat and/or inhibitors for depalmitoylation ML348, Palm B. Right, quantification of the intensity determined by the relative level of EGFR remaining (n = 3). Data are presented as mean ± SEM. Significance was determined by two-tailed unpaired Student’s t test, *p < 0.05, **p < 0.01, ***p < 0.001, ****p < 0.0001. NAFLD non-alcoholic fatty liver disease, BSA bovine serum albumin, PA palmitic acid, OA oleic acid, MFI mean fluorescence intensity, 2-BP 2-bromopalmitate, FASN fatty acid synthases, CHX cycloheximide.
Fig. 7
Fig. 7. Orlistat suppresses CRC cell stemness and restricts liver metastasis synergized with chemotherapy in NAFLD.
A Sphere formation assay in BSA-PA/OA (PA 100 µM, OA 200 µM) treated HCT 116 and SW 480 cells incubated with or without orlistat at indicated doses. Representative photos were taken on Day 10 after seeding in second passage, scale bar represents 100 µm. Sphere numbers and diameters were determined and plotted (n = 3). B The protein level of CSC markers Oct4, Nanog and SOX2 in BSA-PA/OA (PA 100 µM, OA 200 µM) treated HCT 116 and SW 480 cells incubated with or without orlistat at indicated concentrations by western blot assay. CF Schematics illustrating the experimental liver metastasis model established via liver orthotopic implantation in C57BL/6 mice (C). In vivo bioluminescent images of luc-MC38 in the livers of mice treated with orlistat and/or 5-FU or the vehicle control in intrahepatic injection liver metastasis models (D). At the end of the experiment, liver metastases were taken photos and assess metastatic lesion volume, and plotted (E, F). GK Schematics illustrating the experimental liver metastasis model established via splenic implantation in C57BL/6 mice (G). In vivo bioluminescent images of luc-MC38 in the livers of mice treated with orlistat and/or 5-FU or the vehicle control in splenic injection liver metastasis models (H). At the end of the experiment, liver metastases were harvested for taking photos, H&E staining and assessing tumor area (IK). Data are presented as mean ± SEM. Significance was determined by one-way ANOVA, *p < 0.05, **p < 0.01, ***p < 0.001, ****p < 0.0001. BSA bovine serum albumin, PA palmitic acid. OA oleic acid, 5-FU fluorouracil, HFD high-fat diet, luc-MC38 cells luciferase-labeled MC38 cells.
Fig. 8
Fig. 8. Schematic of the proposed working model.
The NAFLD metabolic microenvironment activates endogenous palmitate biosynthesis in liver metastatic CRC cells, leading to palmitoylation-dependent EGFR stabilization and plasma membrane localization. Inhibition of FASN with orlistat suppresses NAFLD-driven CRC liver metastasis.

Similar articles

Cited by

References

    1. Siegel RL, Miller KD, Goding Sauer A, Fedewa SA, Butterly LF, Anderson JC, et al. Colorectal cancer statistics, 2020. CA Cancer J Clin. 2020;70:145–64. doi: 10.3322/caac.21601. - DOI - PubMed
    1. Engstrand J, Nilsson H, Stromberg C, Jonas E, Freedman J. Colorectal cancer liver metastases—a population-based study on incidence, management and survival. BMC Cancer. 2018;18:78. doi: 10.1186/s12885-017-3925-x. - DOI - PMC - PubMed
    1. Younossi ZM, Golabi P, Paik JM, Henry A, Van Dongen C, Henry L. The global epidemiology of nonalcoholic fatty liver disease (NAFLD) and nonalcoholic steatohepatitis (NASH): a systematic review. Hepatology. 2023;77:1335–47. doi: 10.1097/HEP.0000000000000004. - DOI - PMC - PubMed
    1. Mantovani A, Petracca G, Beatrice G, Csermely A, Tilg H, Byrne CD, et al. Non-alcoholic fatty liver disease and increased risk of incident extrahepatic cancers: a meta-analysis of observational cohort studies. Gut. 2022;71:778–88. doi: 10.1136/gutjnl-2021-324191. - DOI - PubMed
    1. Park JH, Hong JY, Shen JJ, Han K, Park JO, Park YS, et al. Increased risk of young-onset digestive tract cancers among young adults age 20-39 years with nonalcoholic fatty liver disease: a nationwide cohort study. J Clin Oncol. 2023;41:3363–337. doi: 10.1200/JCO.22.01740. - DOI - PubMed