

Mosquitoes provide a transmission route between possums and humans for Buruli ulcer in southeastern Australia
- PMID: 38263454
- PMCID: PMC10847040
- DOI: 10.1038/s41564-023-01553-1
Mosquitoes provide a transmission route between possums and humans for Buruli ulcer in southeastern Australia
Erratum in
-
Publisher Correction: Mosquitoes provide a transmission route between possums and humans for Buruli ulcer in southeastern Australia.Nat Microbiol. 2024 Sep;9(9):2463. doi: 10.1038/s41564-024-01693-y. Nat Microbiol. 2024. PMID: 38622381 Free PMC article. No abstract available.
Abstract
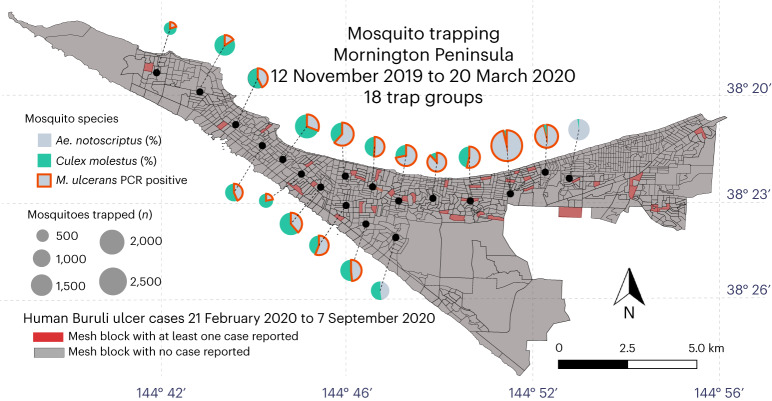
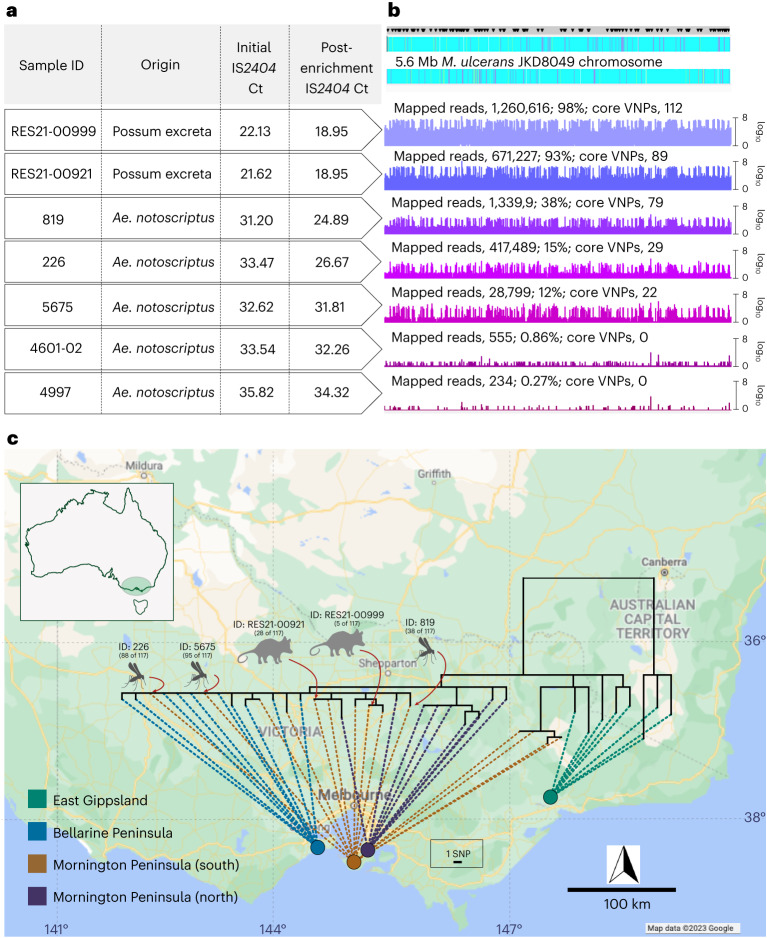
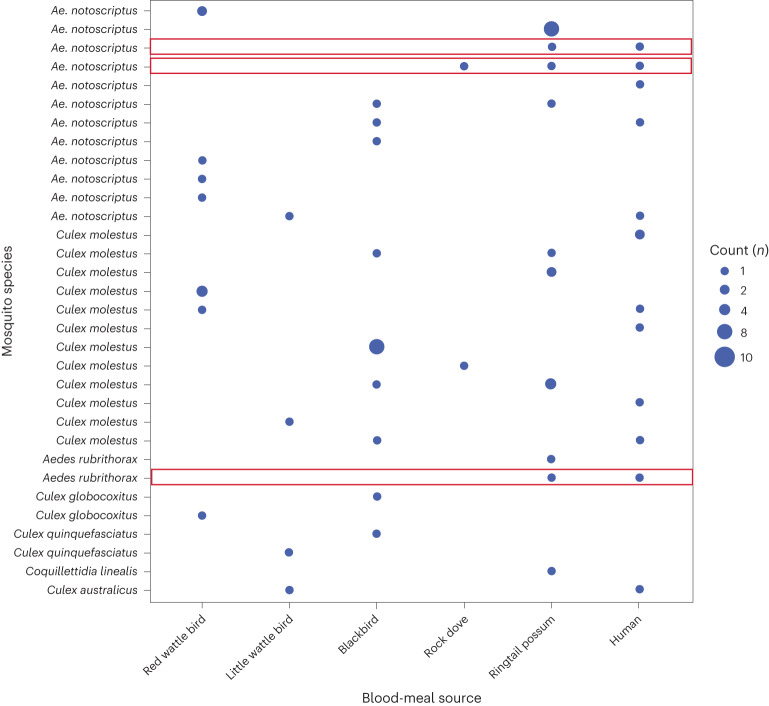
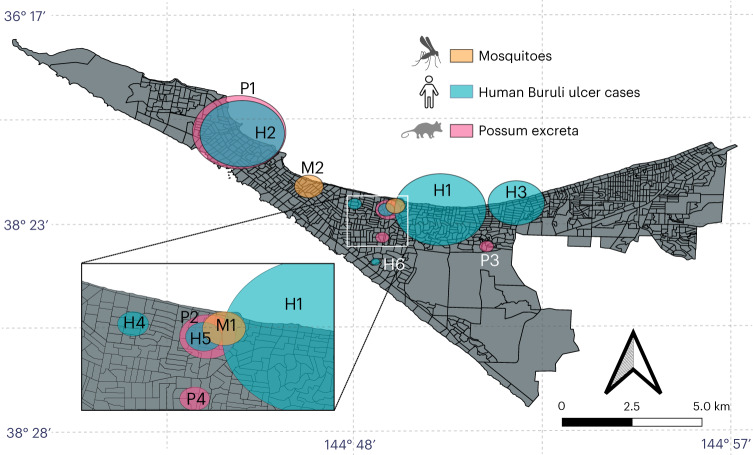
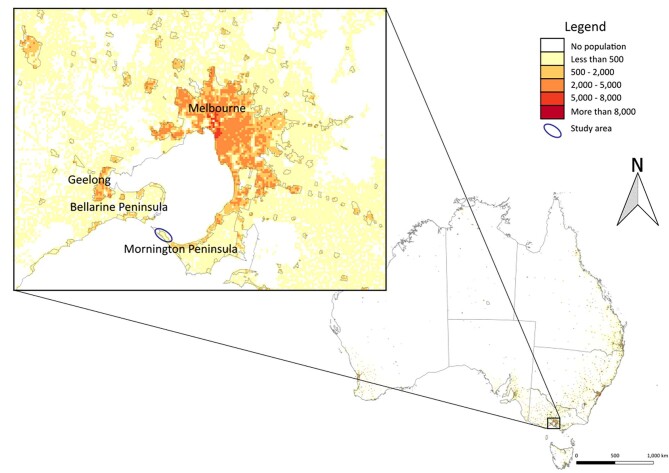
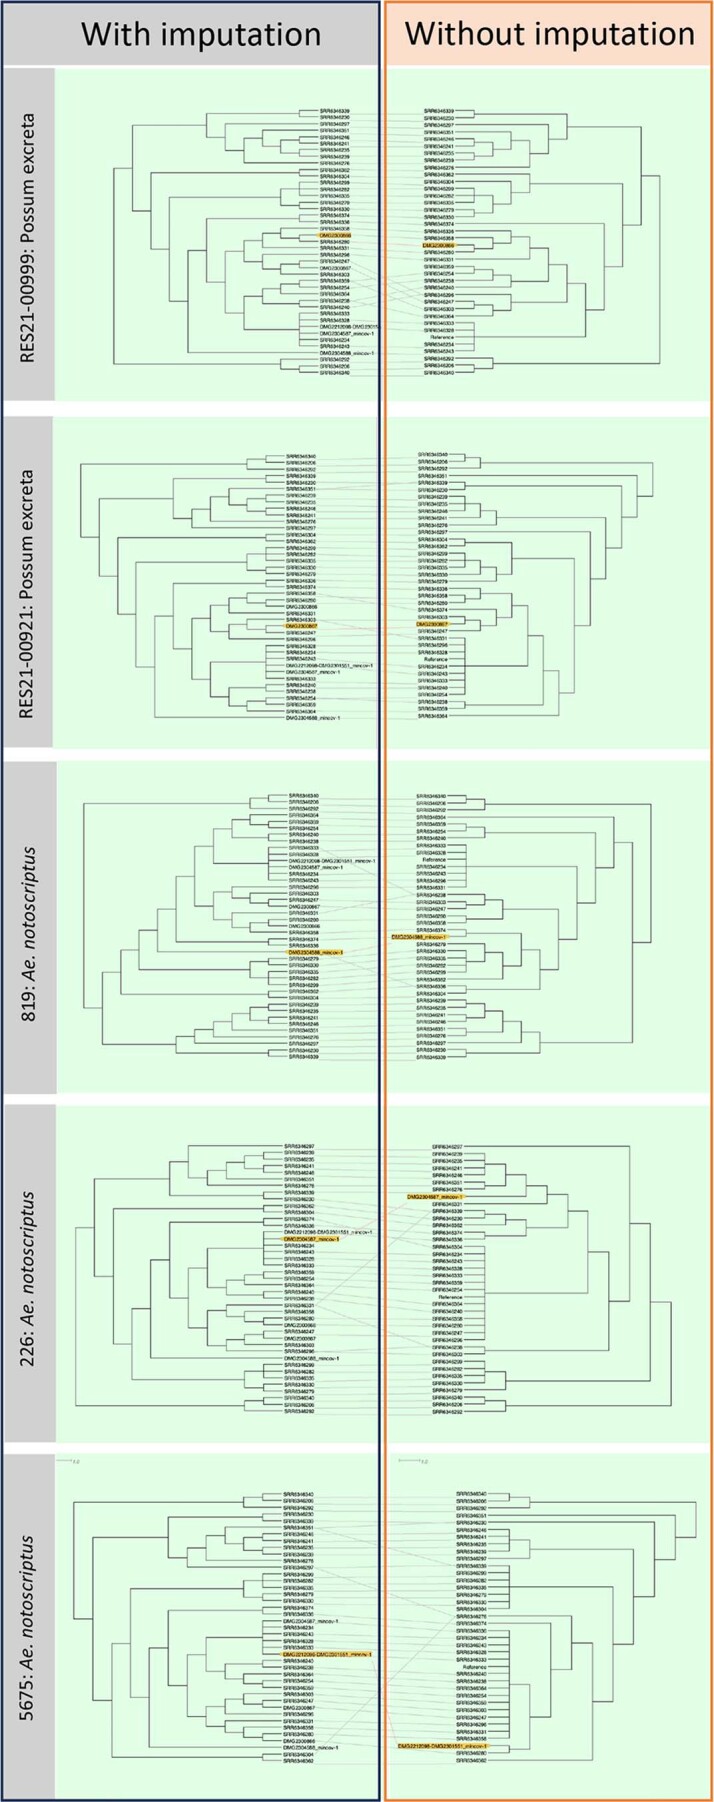
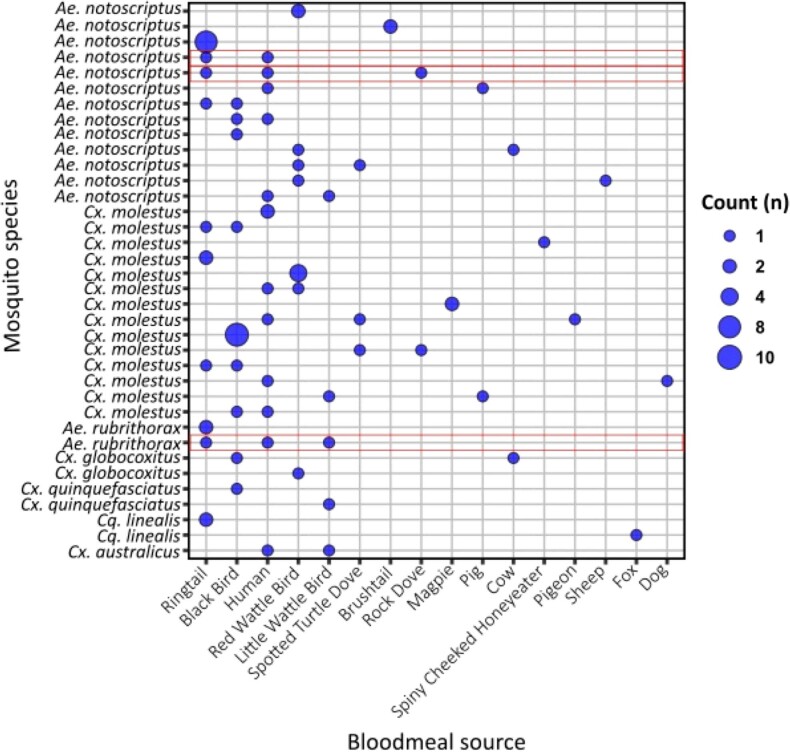
Buruli ulcer, a chronic subcutaneous infection caused by Mycobacterium ulcerans, is increasing in prevalence in southeastern Australia. Possums are a local wildlife reservoir for M. ulcerans and, although mosquitoes have been implicated in transmission, it remains unclear how humans acquire infection. We conducted extensive field survey analyses of M. ulcerans prevalence among mosquitoes in the Mornington Peninsula region of southeastern Australia. PCR screening of trapped mosquitoes revealed a significant association between M. ulcerans and Aedes notoscriptus. Spatial scanning statistics revealed overlap between clusters of M. ulcerans-positive Ae. notoscriptus, M. ulcerans-positive possum excreta and Buruli ulcer cases, and metabarcoding analyses showed individual mosquitoes had fed on humans and possums. Bacterial genomic analysis confirmed shared single-nucleotide-polymorphism profiles for M. ulcerans detected in mosquitoes, possum excreta and humans. These findings indicate Ae. notoscriptus probably transmit M. ulcerans in southeastern Australia and highlight mosquito control as a Buruli ulcer prevention measure.
© 2024. The Author(s).
Conflict of interest statement
The authors declare no competing interests.
Figures
Similar articles
-
A low-cost and versatile paramagnetic bead DNA extraction method for Mycobacterium ulcerans environmental surveillance.Appl Environ Microbiol. 2024 Oct 23;90(10):e0102124. doi: 10.1128/aem.01021-24. Epub 2024 Sep 10. Appl Environ Microbiol. 2024. PMID: 39254328 Free PMC article.
-
Statistical modeling based on structured surveys of Australian native possum excreta harboring Mycobacterium ulcerans predicts Buruli ulcer occurrence in humans.Elife. 2023 Apr 14;12:e84983. doi: 10.7554/eLife.84983. Elife. 2023. PMID: 37057888 Free PMC article.
-
Comparative Genomics Shows That Mycobacterium ulcerans Migration and Expansion Preceded the Rise of Buruli Ulcer in Southeastern Australia.Appl Environ Microbiol. 2018 Apr 2;84(8):e02612-17. doi: 10.1128/AEM.02612-17. Print 2018 Apr 15. Appl Environ Microbiol. 2018. PMID: 29439984 Free PMC article.
-
Buruli ulcer: reductive evolution enhances pathogenicity of Mycobacterium ulcerans.Nat Rev Microbiol. 2009 Jan;7(1):50-60. doi: 10.1038/nrmicro2077. Nat Rev Microbiol. 2009. PMID: 19079352 Review.
-
In the case of transmission of Mycobacterium ulcerans in buruli ulcer disease Acanthamoeba species stand accused.Ghana Med J. 2011 Mar;45(1):31-4. doi: 10.4314/gmj.v45i1.68920. Ghana Med J. 2011. PMID: 21572823 Free PMC article. Review.
Cited by
-
Mosquitoes as Vectors of Mycobacterium ulcerans Based on Analysis of Notifications of Alphavirus Infection and Buruli Ulcer, Victoria, Australia.Emerg Infect Dis. 2024 Sep;30(9):1918-1921. doi: 10.3201/eid3009.231073. Emerg Infect Dis. 2024. PMID: 39174038 Free PMC article.
-
Climate change, malaria and neglected tropical diseases: a scoping review.Trans R Soc Trop Med Hyg. 2024 Sep 2;118(9):561-579. doi: 10.1093/trstmh/trae026. Trans R Soc Trop Med Hyg. 2024. PMID: 38724044 Free PMC article.
-
A human model of Buruli ulcer: Provisional protocol for a Mycobacterium ulcerans controlled human infection study.Wellcome Open Res. 2024 Oct 21;9:488. doi: 10.12688/wellcomeopenres.22719.2. eCollection 2024. Wellcome Open Res. 2024. PMID: 39386965 Free PMC article.
-
A low-cost and versatile paramagnetic bead DNA extraction method for Mycobacterium ulcerans environmental surveillance.Appl Environ Microbiol. 2024 Oct 23;90(10):e0102124. doi: 10.1128/aem.01021-24. Epub 2024 Sep 10. Appl Environ Microbiol. 2024. PMID: 39254328 Free PMC article.
-
Epidemiology of Buruli Ulcer in Victoria, Australia, 2017-2022.Emerg Infect Dis. 2025 Mar;31(3):448-457. doi: 10.3201/eid3103.240938. Emerg Infect Dis. 2025. PMID: 40023793 Free PMC article. Review.
References
-
- World Health Organization. Buruli ulcer (Mycobacterium ulcerans infection) https://www.who.int/news-room/fact-sheets/detail/buruli-ulcer-(mycobacte... (2022).
-
- Department of Health and Human Services (Victoria). Interactive infectious disease surveillance reports https://www2.health.vic.gov.au/public-health/infectious-diseases/infecti... (2021).
-
- Janssens PG, Quertinmont MJ, Sieniawski J, Gatti F. Necrotic tropical ulcers and mycobacterial causative agents. Trop. Geogr. Med. 1959;11:293–312. - PubMed
MeSH terms
Grants and funding
LinkOut - more resources
Full Text Sources
