. 2024 Feb;27(2):359-372.
doi: 10.1038/s41593-023-01549-4. Epub 2024 Jan 23.

Single-cell transcriptomics reveals that glial cells integrate homeostatic and circadian processes to drive sleep-wake cycles

Affiliations

Single-cell transcriptomics reveals that glial cells integrate homeostatic and circadian processes to drive sleep-wake cycles

Joana Dopp et al. Nat Neurosci. 2024 Feb.

Abstract

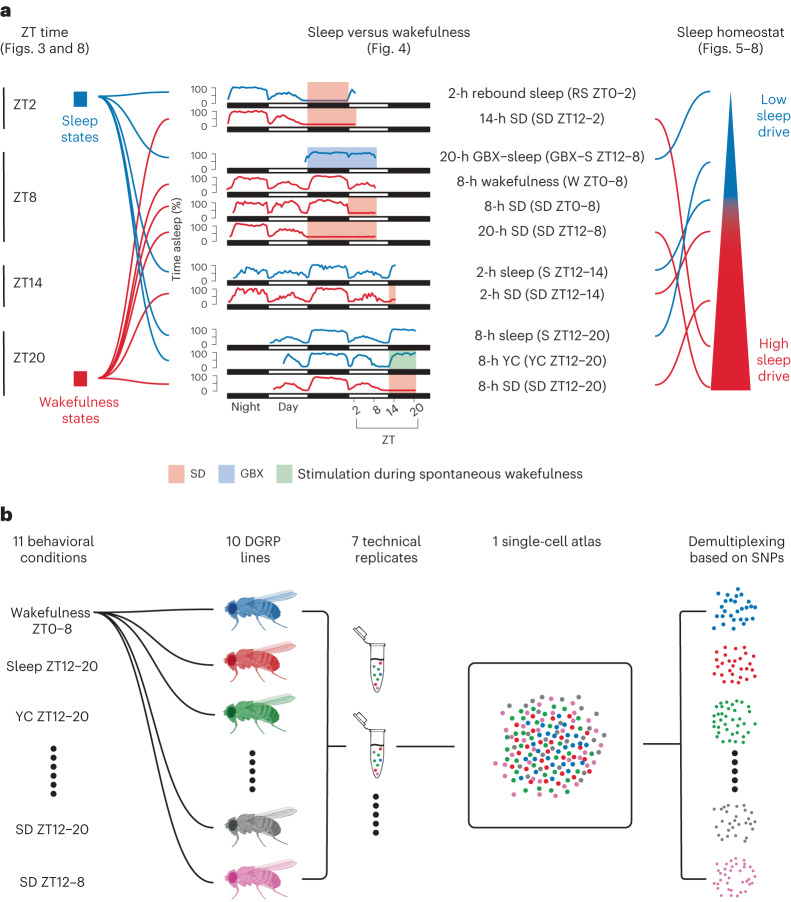
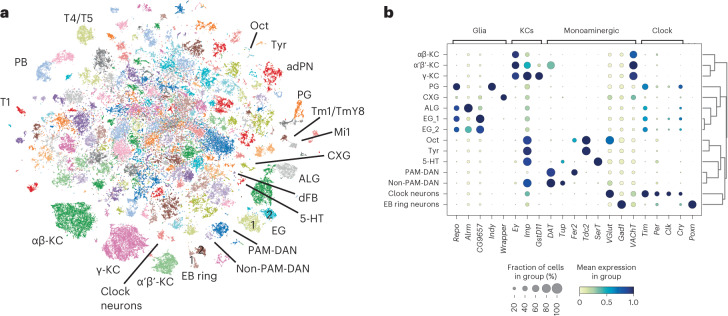
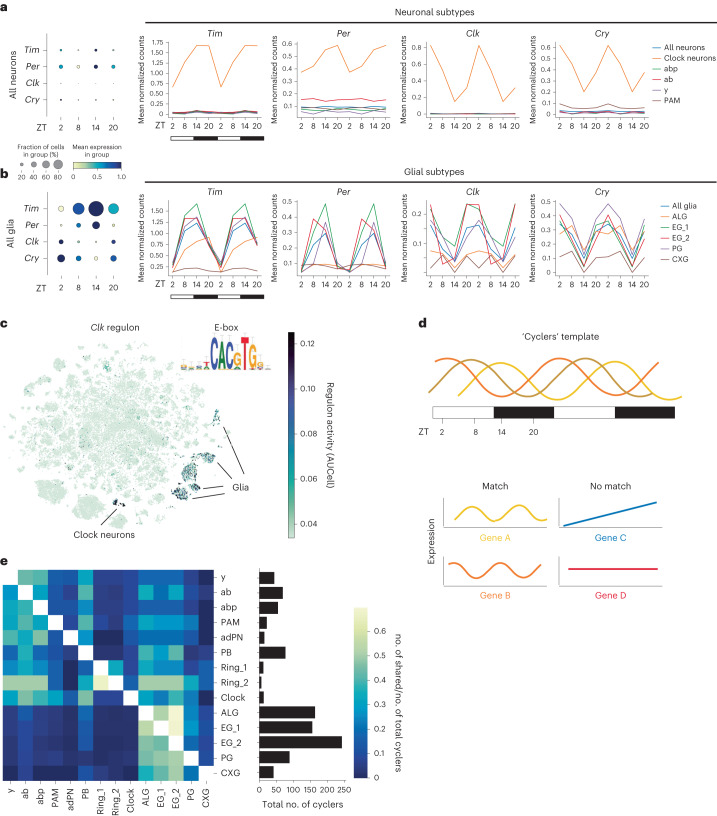
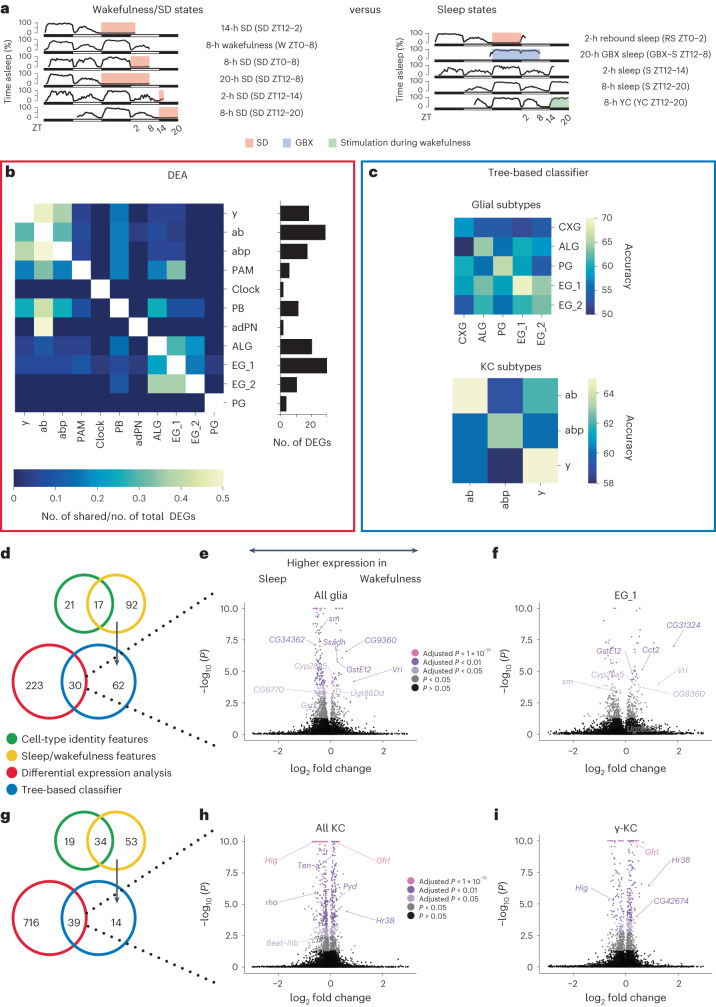
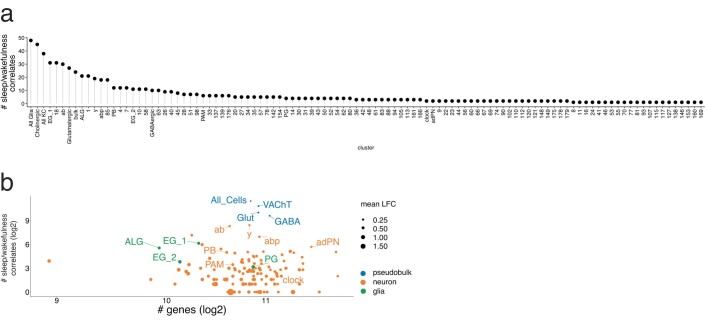
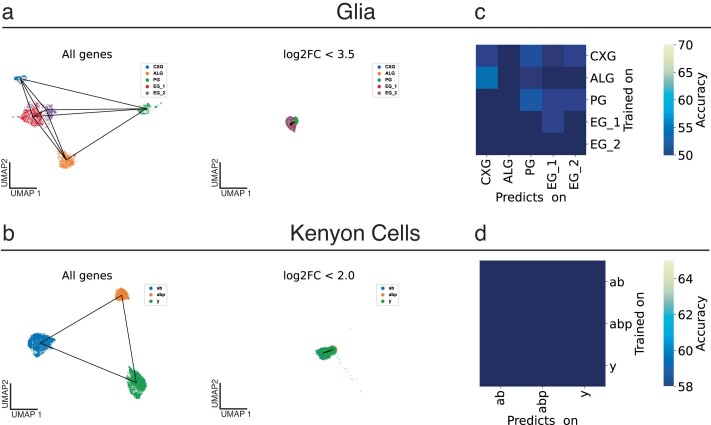
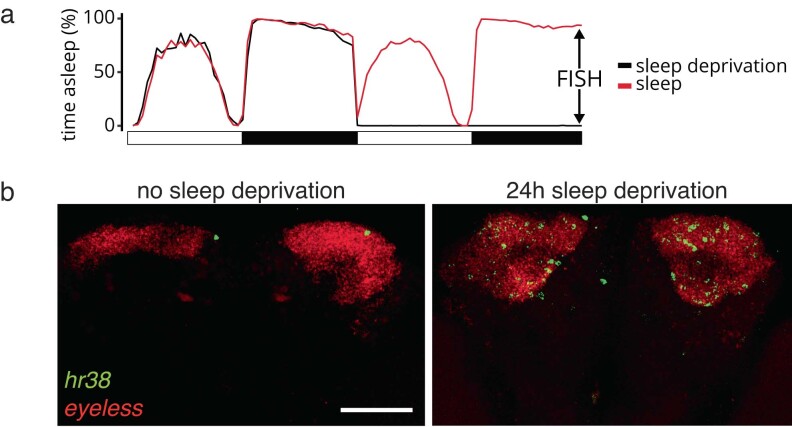
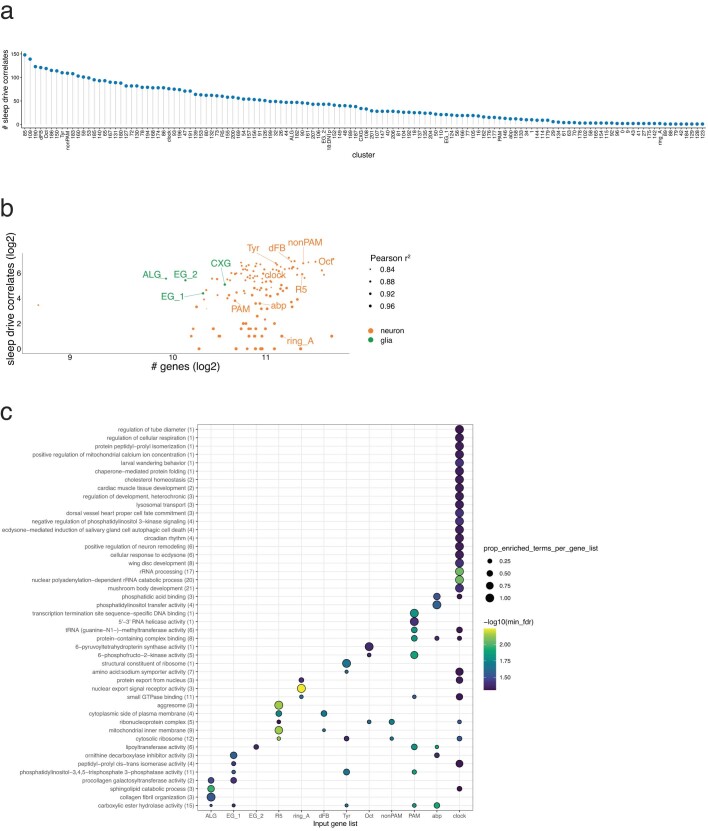
The sleep-wake cycle is determined by circadian and sleep homeostatic processes. However, the molecular impact of these processes and their interaction in different brain cell populations are unknown. To fill this gap, we profiled the single-cell transcriptome of adult Drosophila brains across the sleep-wake cycle and four circadian times. We show cell type-specific transcriptomic changes, with glia displaying the largest variation. Glia are also among the few cell types whose gene expression correlates with both sleep homeostat and circadian clock. The sleep-wake cycle and sleep drive level affect the expression of clock gene regulators in glia, and disrupting clock genes specifically in glia impairs homeostatic sleep rebound after sleep deprivation. These findings provide a comprehensive view of the effects of sleep homeostatic and circadian processes on distinct cell types in an entire animal brain and reveal glia as an interaction site of these two processes to determine sleep-wake dynamics.


Conflict of interest statement

The authors declare no competing interests.

Figures

Fig. 1
Fig. 1. Sampling flies at sleep and wakefulness states for subsequent transcriptional profiling.
a, Flies were sampled at four different ZT times and 11 different sleep or wakefulness states. Seven of the conditions were ordered according to accumulated sleep pressure. The corresponding downstream analyses of each of the three correlates are described in the corresponding figure (displayed in parentheses). b, In each of seven technical replicates (runs), each condition was linked to two or three DGRP lines. The link between condition and DGRP line was changed in every run. The flies’ central brains were dissected and the tissue was dissociated in a single tube, minimizing batch effects. Conditions were separated by demultiplexing the sequenced reads based on unique SNPs of DGRP lines. Source data
Fig. 2
Fig. 2. Cell-type annotations in a single-cell atlas of the sleeping fruit fly.
a, t-Distributed stochastic neighbor embedding (t-SNE) plot of the entire dataset of 106,762 single cells with annotated clusters and expression of key marker genes of glial and neuronal cell types used to annotate the clusters. b, Marker gene expression across most of the clusters annotated in a. 5-HT, 5-hydroxytryptamine (serotonergic) neuron; adPN, anterodorsal projection neuron; ALG, astrocyte-like glia; CXG, cortex glia; EG, ensheathing glia; PB, protocerebral bridge neuron; PG, perineurial glia.
Fig. 3
Fig. 3. Oscillating transcripts in neurons and glia.
a,b, Circadian expression levels of the core clock genes per, tim, cry and Clk averaged across all neurons, some neuronal subtypes (a) and all glia and glial subtypes (b). The size of the dot indicates the fraction of cells in each group. Mean expression in each group was normalized to gene expression across the four ZT time points. The data in the line plot were plotted twice to better visualize the cycling patterns. c, Clk regulon and its activity across all cell types. d, Schematic of the template to detect cycling transcripts based on Borbély’s two-process model. Examples of genes whose expression would match (yellow and orange) or not match (blue and red) the template are given. e, Heatmap of intersecting cycling genes between all annotated cell types with at least one shared gene relative to the total number of cycling genes (at least five genes, right bar plot) according to cell type. Genes with a JTK cycle Benjamini–Hochberg-corrected P < 0.05 were considered as significantly cycling.
Fig. 4
Fig. 4. The transcriptomes of glia and KCs change differently between sleep and wakefulness.
a, Grouping of wakefulness–SD states and sleep states to compare them in differential expression analysis and a tree-based classifier. b, Heatmap of intersecting DEGs between all annotated cell types with at least one shared gene relative to the total number of DEGs according to cluster. The bottom bar plot shows the amount of total DEGs with an adjusted P < 0.05 and log fold change lower than −0.5 or greater than 0.5. The statistical method used was a Wilcoxon rank-sum test. P values were adjusted for multiple-comparisons testing using the Benjamini–Hochberg method. c, Classifying glial (top) and KC (bottom) subtypes into sleep or wakefulness labels revealed that performance was highest for the same subtype. di, For glia (d) and KCs (g), candidate genes were filtered by (1) removing the cell-type features from the sleep/wake features identified using separately trained Explainable Boosting Machines (EBMs) and (2) overlapping significant differential expression analysis (DEA) and EBM results. The volcano plots highlight a selection of the common genes between the two methods for all glia (e), EG_1 (f), all KC (h) and y-KC (i).
Fig. 5
Fig. 5. Analysis of molecular correlates of sleep drive.
a, Illustration of the sleep drive template based on Borbély’s two-process model. Points of low and high sleep pressure are indicated. Examples of genes whose expression would match (blue and purple) or not match (red and yellow) the template are given. bg, Cluster map of all significant sleep drive correlates of dFB (b), Oct (c), Tyr (d) and non-PAM DANs (e). The gene expression of sleep drive correlates from non-PAM DANs did not correlate with the sleep drive template in PAM DANs (f) or all cells combined (pseudobulk) (g). A subset of significantly correlating sleep drive genes is labeled. The statistical test used was Pearson correlation. P values were adjusted for multiple tests using the Benjamini–Hochberg method. h, Heatmap of intersecting sleep drive correlates between all annotated cell types with at least one shared gene relative to the total number of sleep drive correlates according to cluster.
Fig. 6
Fig. 6. Identification of EB R5 neurons and sleep drive correlates across EB ring neuron subtypes.
a, Top, t-SNE plot of two EB ring neuron subclusters. Bottom, reclustering of EB ring neurons into three subclusters, that is, ring_A, ring_B and ring_C. b, Top 20 DEGs between the three subclusters. c (i)–(v), Expression pattern and chemical tag staining of T2A-Gal4 driver lines of the genes boxed in b. Their morphology revealed that neurons in ring_C are EB R5 neurons. d, t-SNE displaying the number of sleep drive correlates at three-cluster resolution. e, Cluster map displaying the expression of sleep drive correlates for R5 neurons. A subset of significantly correlated sleep drive genes is labeled. f, t-SNE displaying the number of sleep drive correlates at a nine-cluster resolution. Source data
Fig. 7
Fig. 7. Analysis of sleep drive correlates in clock neuron subtypes.
a, Predicted annotations of clock neuron subtypes on our data based on training the scANVI model on data from Ma et al.. Cluster annotation names were transferred from Ma et al.. b, VGlut expression mapped onto our data; DN1p subtype clusters 18 (green) and 4 (red) are indicated. c, Plotting of our 494 clock neurons together with clock scRNA-seq atlas of Ma et al. split into 17 high-confidence annotated clusters. d, Our cells in blue highlighted in the UMAP space with data from Ma et al.. e, Proportion of cells according to clock subtype for data from Ma et al., data from this study and published counts of cells from neuroanatomical studies. fh, Cluster map of all significant sleep drive correlates of 18:DN1p (f). Gene expression of the significant genes for 18:DN1p did not correlate with sleep drive in another DN1p subtype (g) or 14:DN3 (h).
Fig. 8
Fig. 8. Homeostatic and circadian processes converge on glial cells.
a, Clusters assigned to cyclers (yellow, left) or sleep drive correlates (blue, right) visualized in the t-SNE. Middle, The t-SNE shows the merge of left and right t-SNE, highlighting the clusters assigned to both groups in green. b, Number of correlating genes with circadian or sleep drive template across all annotated clusters that have correlates for either process. The color indicates their assigned group (yellow, cyclers; blue, sleep drive correlates; green, both). c, Sleep amount 4 h after SD compared to the baseline sleep of the same fly in the same ZT time period before SD in flies expressing conditional knockout of vri (n = 30), tim (n = 47) and cry (n = 35) in pink and control flies (repo-Gal4>iso31 (n = 58); repo-Gal4>UAS-Cas9.P2 (n = 30); repo-Gal4>UAS-sgRNA-vri (n = 41); repo-Gal4>UAS-sgRNA-tim (n = 26); and repo-Gal4>UAS-sgRNA-cry (n = 41)) in purple. d, Sleep amount 4 h after SD compared to baseline sleep of the same fly in the same ZT time period before SD of flies expressing a dominant negative form of Cyc (n = 48) in pink and control flies (repo-Gal4>iso31 (n = 58)) in purple. c,d, The statistical method used was a Wilcoxon rank-sum test, with Bonferroni-corrected P value adjustment for multiple-comparisons testing. The boxplots indicate the minimum, median, maximum, and first and third quartiles. The error bars represent the first (third) quartile ± 1.5 times the interquartile range. Adjusted *P < 0.05, **P < 0.01, ***P < 0.001; NS, not significant. Source data
Extended Data Fig. 1
Extended Data Fig. 1. Sleep behavior screening of 36 DGRP lines to select suitable DGRP lines for single cell transcriptomics.
a. Clustered heatmap of quantified sleep amount during day and night, sleep bout length and number, latency to first and longest sleep bout during nights across all tested DGRP lines. Based on these parameters ten DGRP lines were selected (n = 355, yellow) and 26 dismissed (n = 425, purple). b. Principal Component Analysis on mean and standard deviation per sleep parameter and DGRP line. c-d. Scatterplot showing the probability to switch from a wake to a sleep state (pDoze) or vice versa (pWake) averaged across flies of the same DGRP line. Source data
Extended Data Fig. 2
Extended Data Fig. 2. Bias analysis of (sub)clusters.
a. Normalized number of cells coloured by genoype for each cluster in resolution 8. Most clusters have a relatively similar number of cells from each genotype. b. tSNE of all cells coloured by genotype shows cells of different DGRP lines mix well. c, e. tSNE displaying cells colored by assignment to their run reveals that there are no technical batch effects for EB ring (c) and clock neuron (e) subclustering. d, f. Proportion of cells in each cluster colored by their assignment to their run for EB ring (d) and clock neuron (f) subclusters.
Extended Data Fig. 3
Extended Data Fig. 3. Annotation of dFB cluster.
a. Heatmap of those 12 clusters of our 10x data that map to at least one R23E10-Gal4 FAC-sorted cell from the publicly available scRNA-seq data by Davie et al.. Cluster 198 from this study shows the highest correlation for the majority of sorted cells, indicating a positive match for this cluster with dFB cells. Similarity between FAC-sorted data and clusters of this study was calculated with a non-negative least-squares regression model (NNLS) (Stanescu et al., 2017). b. Annotation of cluster 198 as dFB in tSNE of all cell types.
Extended Data Fig. 4
Extended Data Fig. 4. Oscillation of core circadian genes in glia and number and gene ontology of cyclers across cell types.
a-e. Circadian expression levels of core clock genes per, tim, cry and Clk for each glial subtype. f Number of cyclers across all clusters with at least three correlates. g. Correlation between number of genes and number of cyclers for pseudobulk samples, neuronal and glial cell types. h. Gene ontology parent terms enriched across annotated clusters. Number of child terms per parent term in brackets. Size of dot indicates fraction of child terms associated with the parent term.
Extended Data Fig. 5
Extended Data Fig. 5. Sleep/wakefulness correlates across all clusters.
a. Number of sleep/wakefulness correlates across all clusters with at least one correlate. b. Correlation between number of genes and number of sleep/wakefulness correlates for pseudobulk samples, neuronal and glial cell types. Dot size indicates average log2 fold change (LFC) across all significant sleep/wakefulness correlates for the respective cluster.
Extended Data Fig. 6
Extended Data Fig. 6. Controlling sleep/wake state classifier by removing marker genes between subtypes of KC or glia.
a, b. Glial and KC subtypes move closer to each other in a UMAP space, because marker genes above certain log foldchange thresholds are removed. Genes falling below a threshold of 3.5 or 2 for glia and KC, respectively were excluded for training the tree-based EBM classifier. c, d. Assigning the sleep or wakefulness label randomly results in random performance of the classifier for the same cell subtype.
Extended Data Fig. 7
Extended Data Fig. 7. Validation of candidate sleep/wake correlate HR38 in KC.
a. Sleep and sleep deprivation behaviour traces of flies used for candidate gene validation (sleep: n = 236, SD: n = 213). Arrows indicate time of sampe collection. b. Representative images of validating candidate gene HR38 with KC marker gene eyeless by fluorescent in situ hybridisation. Results were consistent across brains (sleep: n = 4, SD: n = 5). Scale bar, 50 µm. Source data
Extended Data Fig. 8
Extended Data Fig. 8. Sleep drive correlates across all clusters.
a. Number of sleep drive correlates across all clusters with at least one correlate. b. Correlation between number of genes and number of sleep drive correlates for neuronal and glial cell types. c. Gene ontology parent terms enriched across annotated clusters. Number of child terms per parent term in brackets. Size of dot indicates fraction of child terms associated with the parent term.
Extended Data Fig. 9
Extended Data Fig. 9. Marker genes of clock neuron subtypes.
a-d. Marker gene expression mapped onto our data, confirming model predictions. e. Top 5 marker genes per cluster identified in Ma et al. and their gene expression in our data.
Extended Data Fig. 10
Extended Data Fig. 10. Webtool to browse gene expression across sleep conditions and ZT times.
a. Comparing expression of given gene across different cell types. b. Comparing expression of significant correlates in given cell type. Examples shown are based on sleep drive correlates. Cyclers and sleep vs wake correlates are available in the webtool, see QR code.

Similar articles

Cited by

References

    1. Borbély AA. A two process model of sleep regulation. Hum. Neurobiol. 1982;1:195–204. - PubMed
    1. Patke A, Young MW, Axelrod S. Molecular mechanisms and physiological importance of circadian rhythms. Nat. Rev. Mol. Cell Biol. 2020;21:67–84. - PubMed
    1. Hastings MH, Maywood ES, Brancaccio M. Generation of circadian rhythms in the suprachiasmatic nucleus. Nat. Rev. Neurosci. 2018;19:453–469. - PubMed
    1. Allada R, Chung BY. Circadian organization of behavior and physiology in Drosophila. Annu. Rev. Physiol. 2010;72:605–624. - PMC - PubMed
    1. Cirelli C, Gutierrez CM, Tononi G. Extensive and divergent effects of sleep and wakefulness on brain gene expression. Neuron. 2004;41:35–43. - PubMed