. 2024 Jan 23;7(1):120.
doi: 10.1038/s42003-024-05781-x.

Functionally-selective inhibition of threshold sodium currents and excitability in dorsal root ganglion neurons by cannabinol

Affiliations

Functionally-selective inhibition of threshold sodium currents and excitability in dorsal root ganglion neurons by cannabinol

Mohammad-Reza Ghovanloo et al. Commun Biol. .

Abstract

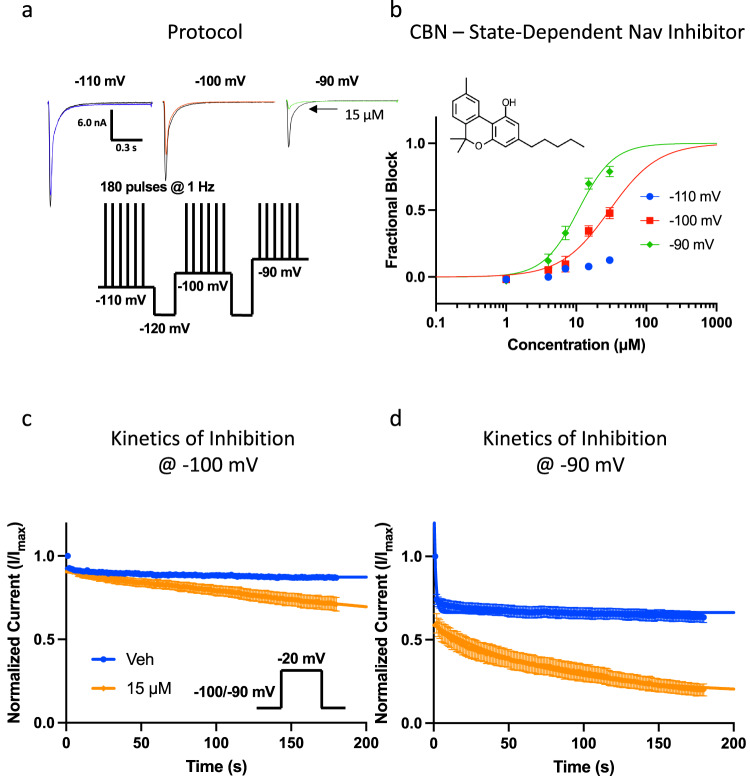
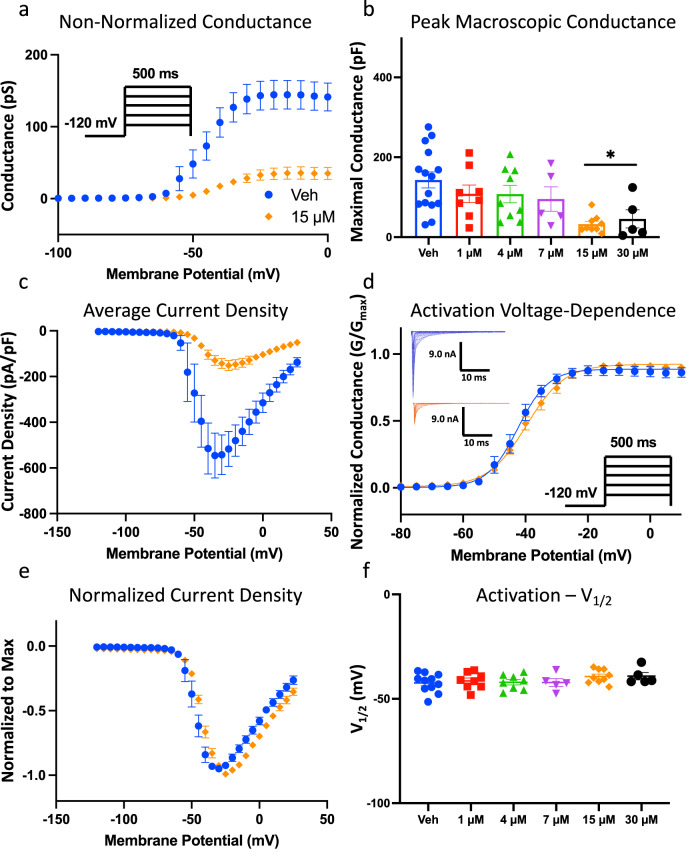
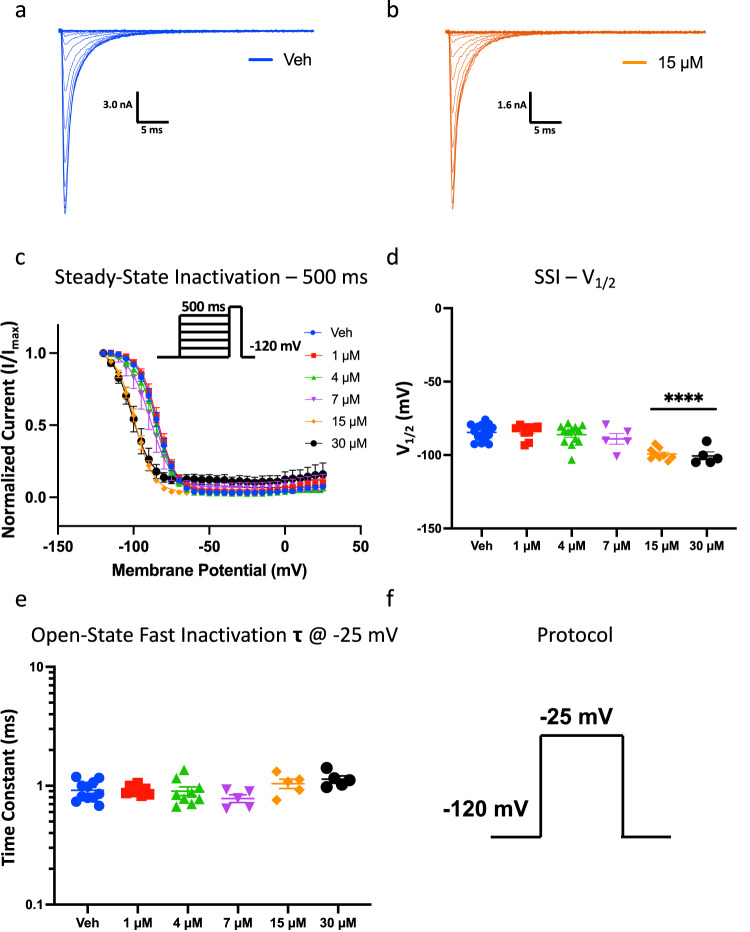
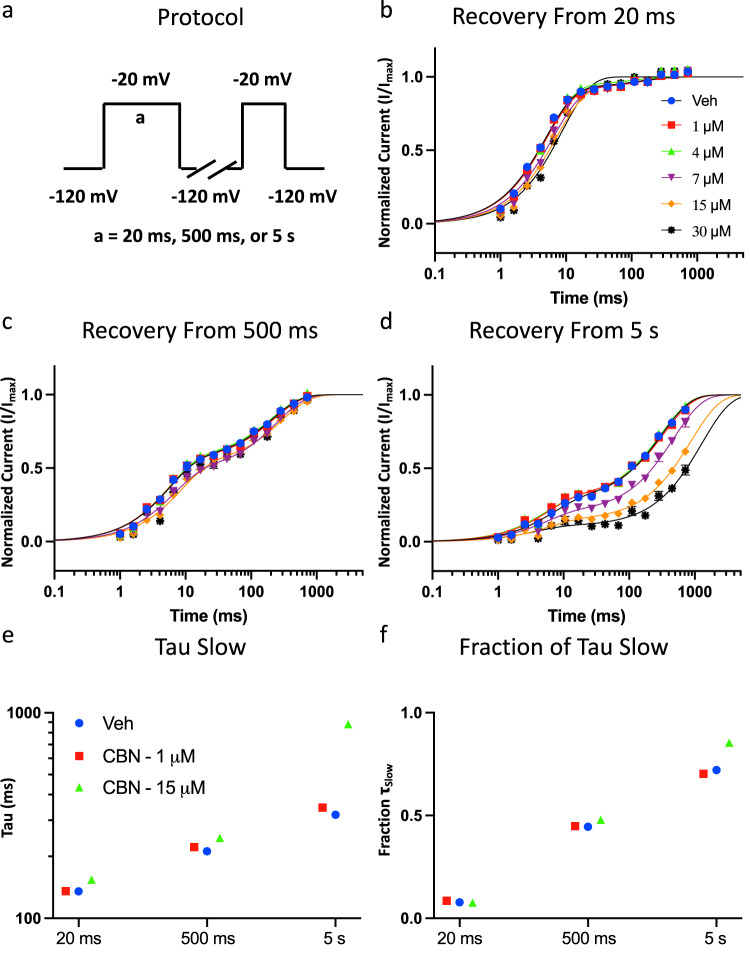
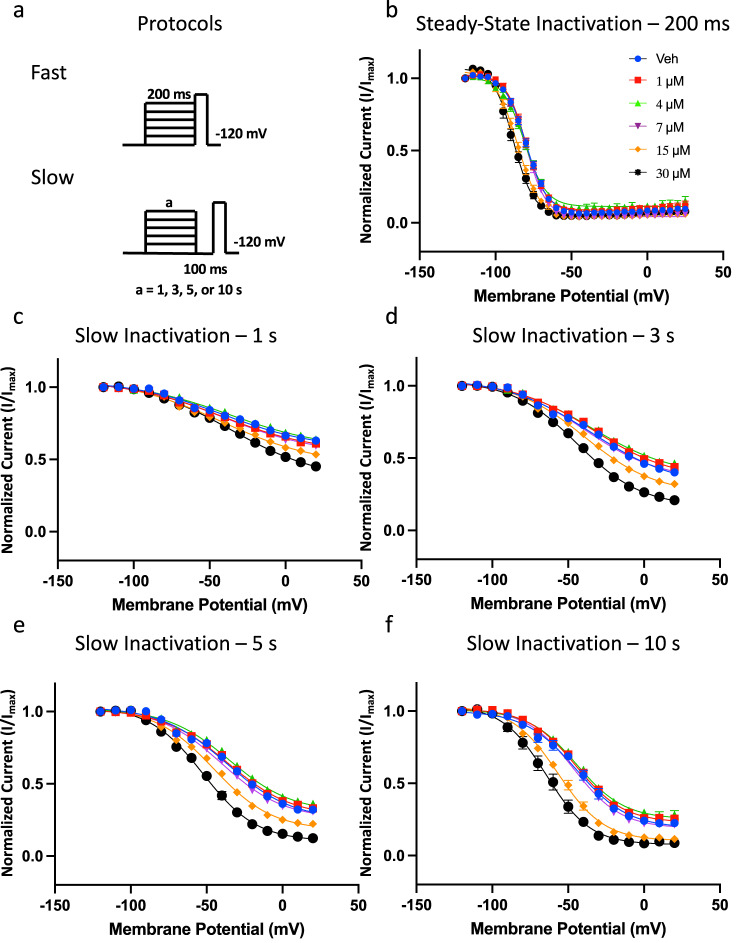
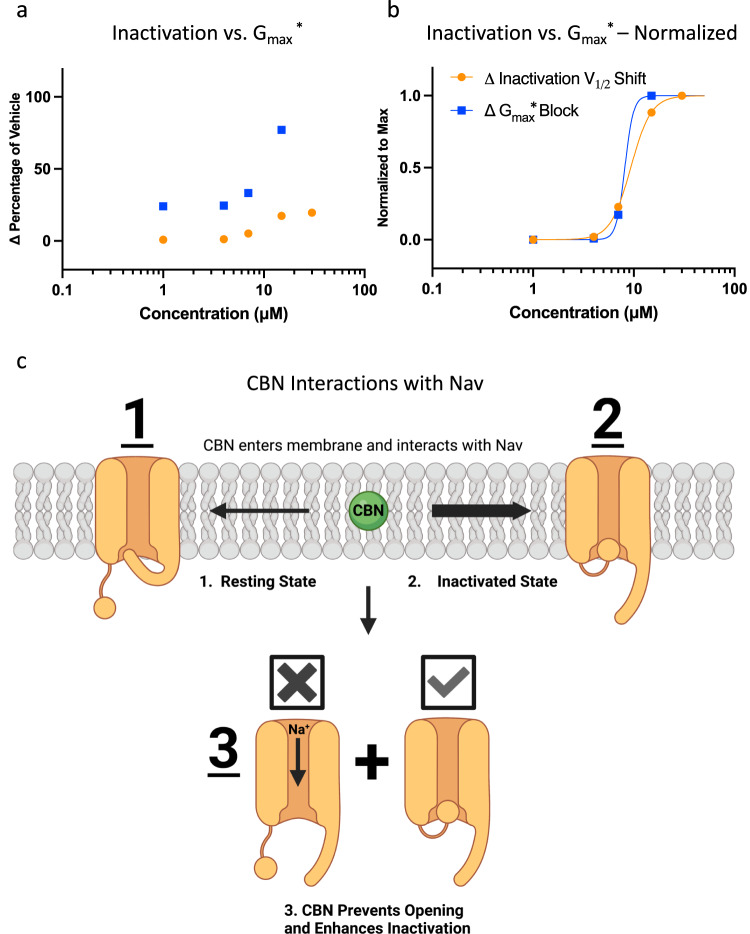
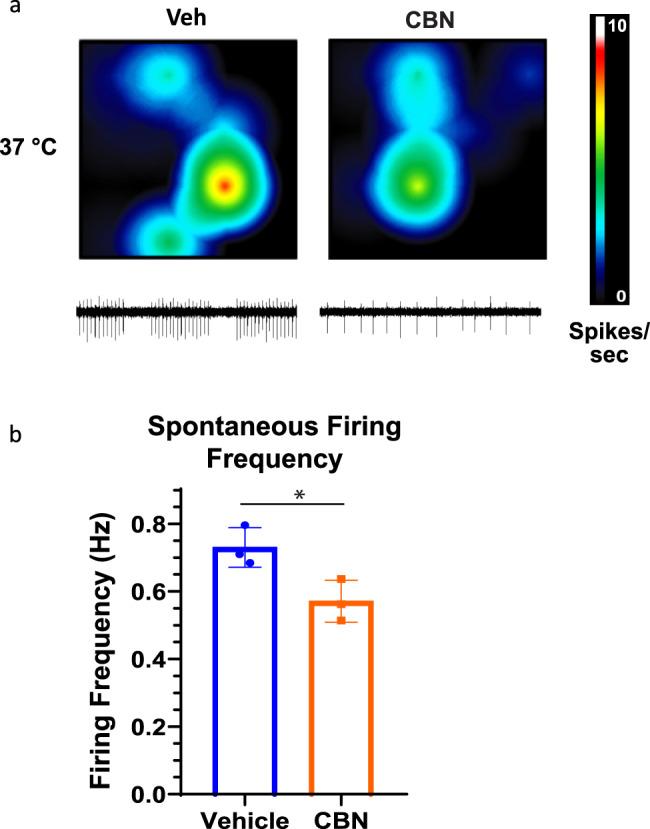
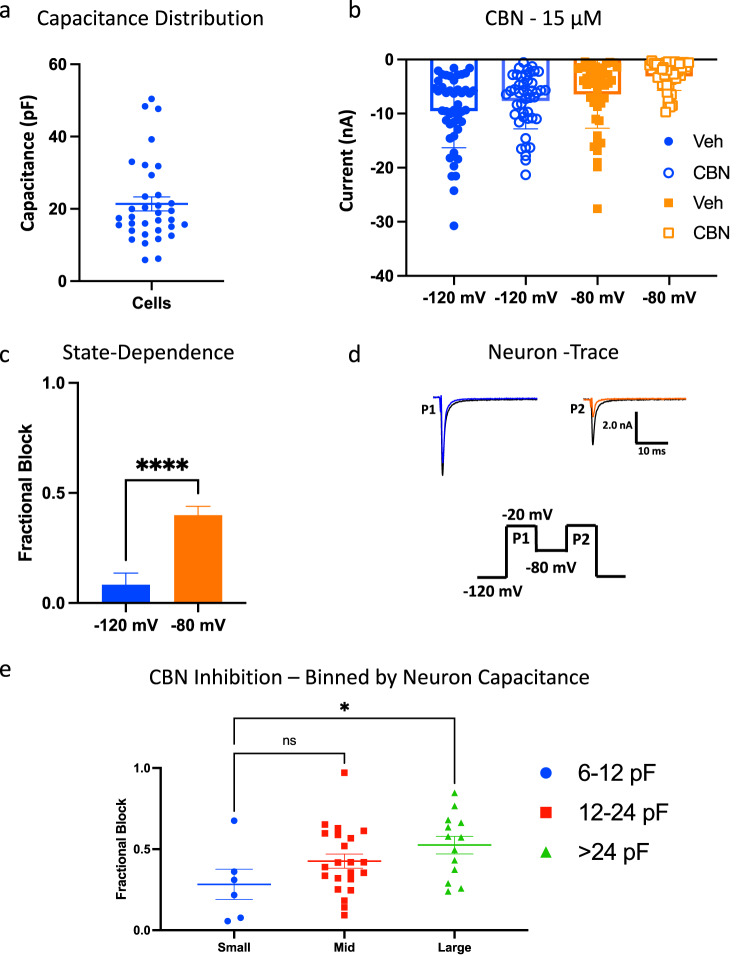
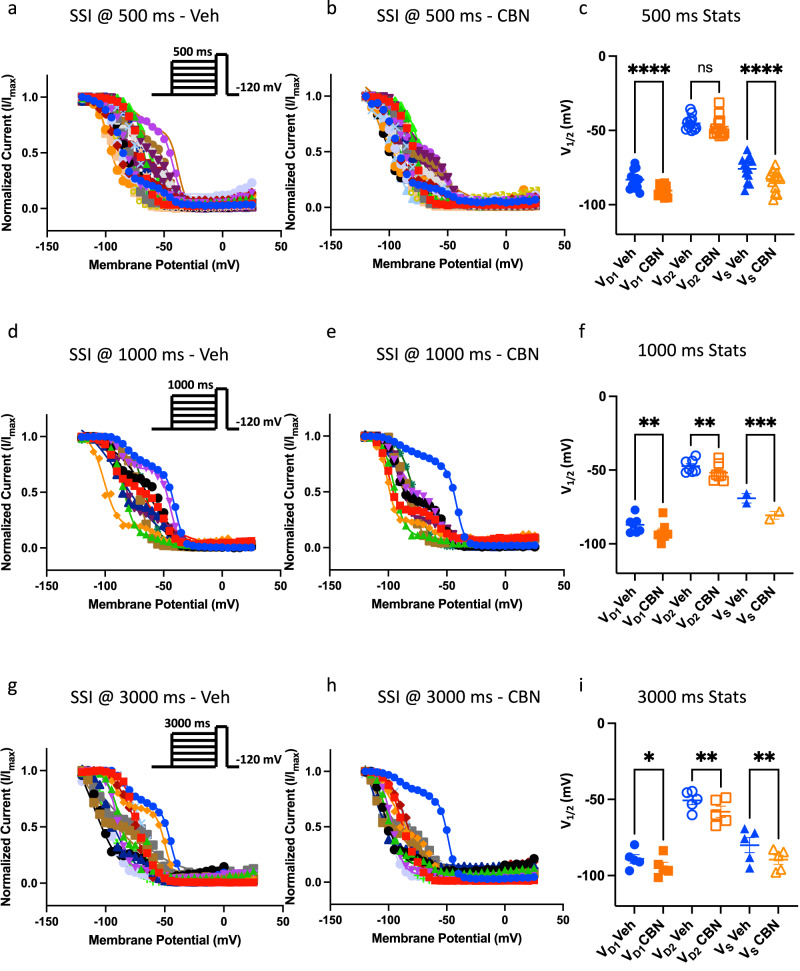
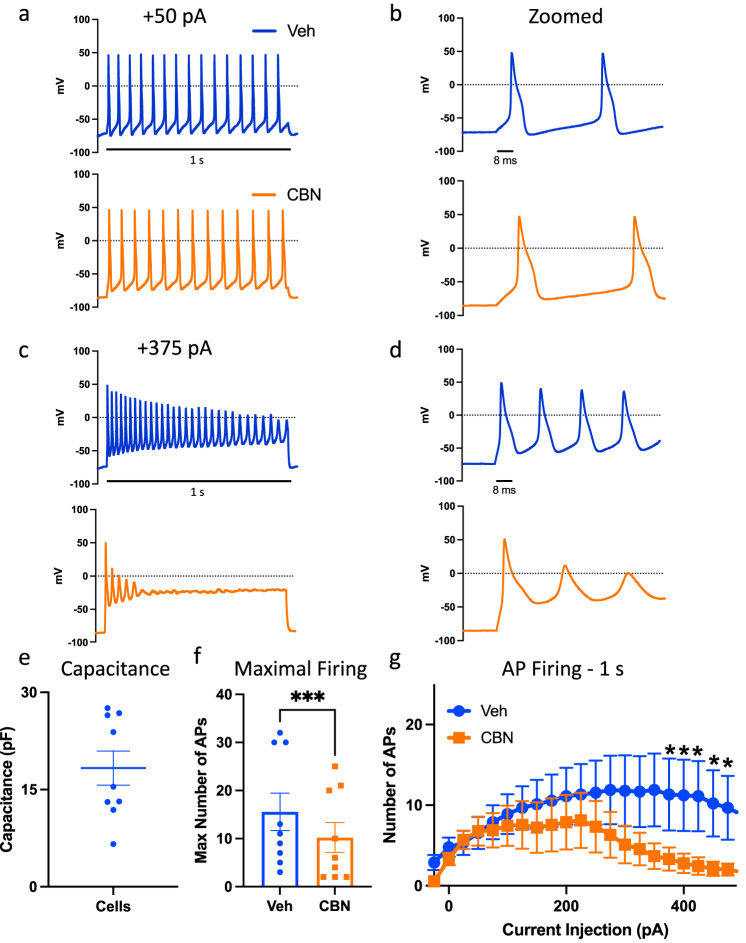
Cannabinol (CBN), an incompletely understood metabolite for ∆9-tetrahydrocannabinol, has been suggested as an analgesic. CBN interacts with endocannabinoid (CB) receptors, but is also reported to interact with non-CB targets, including various ion channels. We assessed CBN effects on voltage-dependent sodium (Nav) channels expressed heterologously and in native dorsal root ganglion (DRG) neurons. Our results indicate that CBN is a functionally-selective, but structurally-non-selective Nav current inhibitor. CBN's main effect is on slow inactivation. CBN slows recovery from slow-inactivated states, and hyperpolarizes steady-state inactivation, as channels enter deeper and slower inactivated states. Multielectrode array recordings indicate that CBN attenuates DRG neuron excitability. Voltage- and current-clamp analysis of freshly isolated DRG neurons via our automated patch-clamp platform confirmed these findings. The inhibitory effects of CBN on Nav currents and on DRG neuron excitability add a new dimension to its actions and suggest that this cannabinoid may be useful for neuropathic pain.


Conflict of interest statement

The authors declare no competing interests.

Figures

Fig. 1
Fig. 1. State-dependence of CBN as a Nav channel inhibitor.
a Pulse protocol showing 180 pulses run at 1 Hz at each holding-potential and representative current traces. The arrow indicating 15 µM is pointing to smaller superimposed current trace which indicates inhibition imparted by CBN. The leftmost trace in blue shows that 15 µM does not comparatively inhibit as much of the Nav1.7 current as the orange trace (middle) or the green trace (rightmost). Each trace indicates data associated with one of the three holding-potentials that are indicated. b CBN potency at varying holding-potentials at pulse 180 (3 min) in Nav1.7 (IC50 (µM): −100 mV = 29.9 ± 3.2, −90 mV = 10.7 ± 0.8; Hill coefficient: −110 mV = −100 mV = 1.3 ± 0.2, −90 mV = 1.7 ± 0.2; n = 12–26). Structure of CBN is shown at the top left. c Kinetics of inhibition of Nav1.7 at −100 mV, d and −90 mV holding-potentials (Mean tau (s): −100 mV Veh = 6.3 ± 0.9, −100 mV CBN = 51.4 ± 4.0, −90 mV Veh = 1.1 ± 0.4; −90 mV CBN = 76.2 ± 11.5, n = 8–15).
Fig. 2
Fig. 2. CBN does not affect activation, but it inhibits conductance in Nav1.7.
a Conductance difference in Nav1.7 in vehicle and 15 µM CBN as a function of membrane potential. The holding-potential was −120 mV. The channels were held at −120 mV, followed by a series of step pulses at ∆5 mV, with each step being 500 ms long (see inset protocol inside of the panel). b Quantification of apparent peak macroscopic conductance at −25 mV across different CBN concentrations. Data shown as means ± SEM (n = 5–15). c Mean current density of hNav1.7 in vehicle and 15 µM CBN as a function of membrane potential. d Voltage-dependence of activation as normalized conductance plotted against membrane potential (Vehicle: V1/2 = −42.4 ± 1.4 mV, Slope = 3.9 ± 0.4, n = 11; CBN: V1/2 = −39.3 ± 1.1 mV, Slope = 5.9 ± 0.5, n = 9). e Normalized current density displaying unaltered activation. f Midpoints of activation across CBN concentrations. Data shown as means ± SEM (n = 5–15).
Fig. 3
Fig. 3. CBN hyperpolarizes 500 ms inactivation probability curve in Nav1.7, but it does not alter open-state fast-inactivation.
a, b Representative macroscopic current traces of Veh and CBN (15 µM). c Voltage-dependence of 500 ms inactivation as normalized current plotted against membrane potential fit with single Boltzmann. d Quantification of SSI midpoints (in mV). Data shown as means ± SEM (n = 5–15). **** Indicates p < 0.0001, 15 and 30 µM compared to vehicle. e Open-state fast-inactivation time constants. Data shown as means ± SEM (n = 5–11). f The protocol that was used for e.
Fig. 4
Fig. 4. CBN slows recovery from slow inactivation in Nav1.7.
a Shows the protocol that was used to measure CBG effect on channel recovery from duration pre-pulses. b Recovery from inactivation in the presence of 0 (Veh)−30 µM CBN, from 20 ms, c 500 ms, and d 5 s. Symbols for data shown in panels b–d are the same. Data shown as means ± SEM (n = 10–25 for 20 ms, 9–26 for 500 ms, and 5–23 for 5 s). e, f The slow components of recovery from inactivation in vehicle and CBN at 20 ms, 500 ms, and 5 s are shown on Y axis (e), and the fraction of slow to fast component of recovery from inactivation is shown on the Y axis (f). Symbols for data shown in panels e-f are the same.
Fig. 5
Fig. 5. CBN hyperpolarizes slow inactivation curves in Nav1.7, imparts similar effect from a 200 ms pre-pulse.
a Shows the protocols that were used to measure CBN’s effect on inactivating properties. The top protocol was used to measure SSI from 200 ms, and the bottom protocol was used to measure steady-state slow inactivation (SSSI) from varying durations. b 200 ms inactivating probability curves at Veh vs. different CBN concentrations. Midpoints (in mV). c SSSI from 1 s, d 3 s, e 5 s, and f 10 s. Data shown as means ± SEM (n = 11–17 for 200 ms, 18–24 for 1 s, 15–22 for 3 s, 11–20 for 5 s, and 7–13 for 10 s).
Fig. 6
Fig. 6. CBN effect on apparent conductance compared to its effect on inactivation.
a Comparison of concentration-dependent effects of CBN on Gmax* vs. inactivation as a percentage of vehicle. b Normalized relationship of the data from a and fit with the Hill equation. The Hill coefficient was not constrained during fitting. c Cartoon representation of the concentration-dependent modality of CBN’s modulation of voltage-dependent Nav currents. Given than CBN is hydrophobic, it readily partitions into the membrane. Once inside the membrane it interacts to a very small extent with the (1) resting state and a much larger affinity for the (2) inactivated states of the Nav channel. (3) CBN equipotently prevents channels from opening, as it hyperpolarizes/enhances inactivation hence.
Fig. 7
Fig. 7. CBN reduces spontaneous excitable activity of rat DRG neurons in MEA.
a Representative images of MEA recordings of AP firing at vehicle and 10 µM CBN (picked from concentration-response relationships in Fig. 1). The firing frequency of each active electrode is color coded: white/red mean high, and blue/black mean low frequencies. b Quantification of MEA data showing firing rate (n = 3 for each). * Indicates p < 0.05.
Fig. 8
Fig. 8. CBN inhibits native voltage-dependent sodium currents in freshly isolated DRG neurons.
a The distribution of the capacitance sizes we got from our cohort of neurons. b Mean peak amplitudes of neuronal Nav currents from a holding-potential of −120 and −80 mV, in vehicle and 15 µM CBN. All measurements are matched-paired. c CBN’s potency across all neurons at −120 and −80 mV shown as fractional block. Data shown as means ± SEM (n = 41). d The two-pulse protocol that was used to measure inhibition, along with a representative trace from each of P1 and P2. e The cohort of neurons binned by capacitance sizes. Data shown as means ± SEM (n = 41). * Indicates p < 0.05, **** indicates p < 0.0001, ns indicates not significantly different p > 0.05.
Fig. 9
Fig. 9. CBN hyperpolarizes inactivation curves in freshly isolated DRG neurons.
ac All measurements are matched-paired. SSI measured from a 500 ms pre-pulse duration. Double Boltzmann curve midpoints (VD1 and VD2) are shown in c. df Data from 1000 ms, and gi from 3000 ms durations. c, f, i Data shown as means ± SEM (n = 34 for 500 ms, 12 for 1000 ms, and 16 for 3000 ms) VD1 refers to the first V1/2 and VD2 to second V1/2 of double Boltzmann fits, and VS refers to the singular V1/2 of single Boltzmann fits.
Fig. 10
Fig. 10. CBN inhibits triggered excitability.
ad All measurements are matched-paired. Sample action potential traces at +50 and +375 pA current injections. e Cell capacitance distribution. f Maximal number of action potentials in Veh vs. CBN. g Collected results for the number of action potentials during 1 s of current injections in Veh vs. CBN (15 µM). Data shown as means ± SEM (n = 9). * Indicates p < 0.05.

Similar articles

Cited by

References

    1. Ghovanloo, M.-R. & Ruben, P. C. Cannabidiol and sodium channel pharmacology: general overview, mechanism, and clinical implications. Neuroscientist10.1177/10738584211017009 (2021). - PMC - PubMed
    1. Morales, P., Hurst, D. P. & Reggio, P. H. Molecular targets of the phytocannabinoids: a complex picture. Prog. Chem. Org. Nat. Prod.103, 103–131 (2017). - PMC - PubMed
    1. Maioli, C., Mattoteia, D., Amin, H. I. M., Minassi, A. & Caprioglio, D. Cannabinol: history, syntheses, and biological profile of the greatest ‘minor’ cannabinoid. Plants (Basel, Switzerland)11, 2896 (2022). - PMC - PubMed
    1. Ghovanloo, M.-R., Dib-Hajj, S. D., Goodchild, S. J., Ruben, P. C. & Waxman, S. G. Non-psychotropic phytocannabinoid interactions with voltage-gated sodium channels: an update on cannabidiol and cannabigerol. Front. Physiol.13, 2379 (2022). - PMC - PubMed
    1. Jan, T. R., Farraj, A. K., Harkema, J. R. & Kaminski, N. E. Attenuation of the ovalbumin-induced allergic airway response by cannabinoid treatment in A/J mice. Toxicol. Appl. Pharmacol.188, 24–35 (2003). - PubMed

Publication types