. 2024 Jan 9:14:1304638.
doi: 10.3389/fgene.2023.1304638. eCollection 2023.

Multi-tissue transcriptome analysis to identify candidate genes associated with weight regulation in Hanwoo cattle

Affiliations

Multi-tissue transcriptome analysis to identify candidate genes associated with weight regulation in Hanwoo cattle

Subin Jang et al. Front Genet. .

Abstract

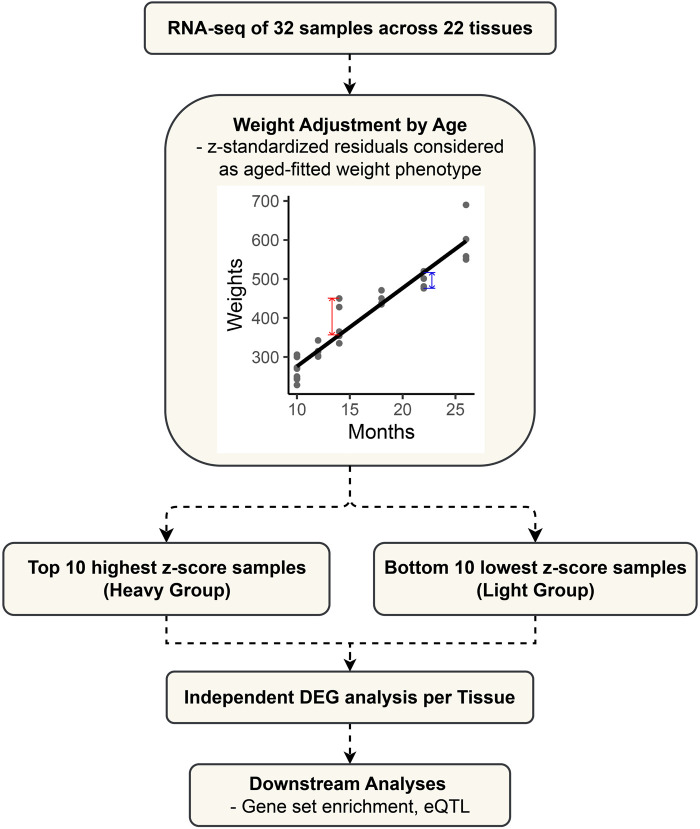
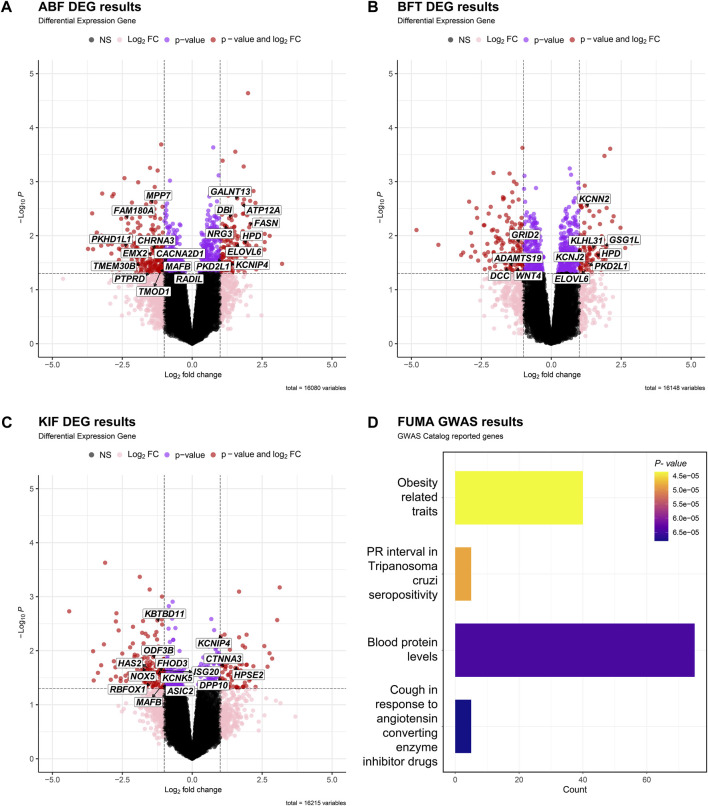
While genetic markers related to meat production traits have been identified in many other cattle breeds, research on weight in Hanwoo cattle (Korean native cattle) is still insufficient. In this study, we performed expression quantitative trait loci (eQTL) analysis and differential gene expression analysis to detect candidate genes influencing the weight characteristics of 32 castrated Hanwoo cattle across 22 tissues and, we identified variants that affect gene expression levels. In total, we identified a total of 3,298 differentially expressed genes, among which we discovered key genes such as UBD, RGS2, FASN, and SCD that have functions related to adipogenesis, body weight, obesity, and lipid metabolism. Gene-set enrichment analysis revealed that candidate genes in adipose tissue are involved in metabolic pathways linked to obesity-related traits, adipose metabolism, and lipid metabolism. Additionally, we found that decreased expression of TRIM31 contributes to weight gain which can be explained by the associated candidate cis-eQTL genotypes for TRIM31 and their effect on differential gene expression between the lower and higher weight groups. Our findings revealed candidate genes associated with the weight of Hanwoo cattle and perhaps can provide comprehensive insights into the association of weight with various tissues beyond adipose tissue and muscle, indicating the potential for expanding the focus of livestock trait research.

Keywords: Hanwoo; body weight; differentially expressed genes; eQTL analysis; transcriptome.


Conflict of interest statement

The authors declare that the research was conducted in the absence of any commercial or financial relationships that could be construed as a potential conflict of interest.

Figures

FIGURE 1
FIGURE 1
Flowchart outlining the study design and analytical approach for differential expression gene (DEG) analysis in cattle.
FIGURE 2
FIGURE 2
Correlations and hierarchical clustering between tissues based on the t value representing the difference in expression between the case group (sample with a high z-score) and the control group (sample with a low z-score). The closer the correlation value is to 1, the higher the correlation.
FIGURE 3
FIGURE 3
Volcano plot of DEGs in adipose tissue [(A) ABF, (B) BFT, (C) KIF]. The X-axis is Log2FC, the Y-axis is -Log10 p- value, and the cutoff criterion is p-value < 0.05, |Log2FC| > 1. Black dots are points that do not satisfy both the p-value and the Log2FC FC criterion, pink dots are points that satisfy only the Log2FC criterion, purple dots are points that satisfy only the p-value criterion, and red dots are differentially expressed genes (DEGs) that satisfy both p-value and Log2FC criteria. We displayed the genes associated with obesity-related traits based on the results of (D). (D) Table showing the gene set reported in the GWAS Catalog based on the results of FUMA GWAS using candidate genes from the three tissues.
FIGURE 4
FIGURE 4
Boxplot to confirm the expression level of representative genes (FASN, SCD) related to fat metabolism. (A) The expression pattern of the FASN across all tissues. (B) Boxplot showing the differential expression pattern of FASN in ABF tissue based on groups (z-scores of top and bottom 10 samples). (C) Expression pattern of the SCD across all tissues. (D) Boxplot showing the differential expression pattern of the SCD gene in ABF tissue based on groups.
FIGURE 5
FIGURE 5
(A) Distance between TRIM31 and candidate variants regulating the expression level. (B) Boxplot showing the change in TRIM31 expression level according to the genotype of the candidate cis-eQTL variant (chr23:29119138) that affects TRIM31 expression. (A, B) Additionally, outliers were excluded during the visualization process in creating the boxplot. (C) Bar plot depicting the LD values between the candidate cis-eQTL variant and surrounding SNPs within 250 Kb. The figure displays the range chr 23:28,868,629-29,200,000. A plot of the entire 500 Kb region is provided in Supplementary Figure S4. The x-axis represents genetic coordinates while the y-axis indicates the LD values between the candidate variant and SNPs. Differentially expressed gene TRIM31 and the candidate cis-eQTL variant are highlighted in red.

Similar articles

Cited by

References

    1. Adibhatla R. M., Hatcher J. (2008). Altered lipid metabolism in brain injury and disorders. Lipids health Dis. 49, 241–268. 10.1007/978-1-4020-8831-5_9 - DOI - PMC - PubMed
    1. Bolger A. M., Lohse M., Usadel B. (2014). Trimmomatic: a flexible trimmer for Illumina sequence data. Bioinformatics 30, 2114–2120. 10.1093/bioinformatics/btu170 - DOI - PMC - PubMed
    1. Brown J., Pirrung M., Mccue L. A. (2017). FQC Dashboard: integrates FastQC results into a web-based, interactive, and extensible FASTQ quality control tool. Bioinformatics 33, 3137–3139. 10.1093/bioinformatics/btx373 - DOI - PMC - PubMed
    1. Cai W., Zhang Y., Chang T., Wang Z., Zhu B., Chen Y., et al. (2023). The eQTL colocalization and transcriptome-wide association study identify potentially causal genes responsible for economic traits in Simmental beef cattle. J. Animal Sci. Biotechnol. 14, 78. 10.1186/s40104-023-00876-7 - DOI - PMC - PubMed
    1. Chakravarty B., Gu Z., Chirala S. S., Wakil S. J., Quiocho F. A. (2004). Human fatty acid synthase: structure and substrate selectivity of the thioesterase domain. Proc. Natl. Acad. Sci. 101, 15567–15572. 10.1073/pnas.0406901101 - DOI - PMC - PubMed