. 2024 Jan 19:17:21-32.
doi: 10.2147/JAA.S442217. eCollection 2024.

Bronchodilator Responsiveness Measured by Spirometry and Impulse Oscillometry in Patients with Asthma After Short Acting Antimuscarinic and/or Beta-2-Agonists Inhalation

Affiliations

Bronchodilator Responsiveness Measured by Spirometry and Impulse Oscillometry in Patients with Asthma After Short Acting Antimuscarinic and/or Beta-2-Agonists Inhalation

Nicole M D van der Burg et al. J Asthma Allergy. .

Abstract

Background: Bronchodilator responsiveness (BDR) in asthma involves both the central and peripheral airways but is primarily relieved with beta-2-agonists and evaluated by spirometry. To date, antimuscarinics can be added as a reliever medication in more severe asthma. We hypothesize that combining both short-acting beta-2 agonist (SABA) and short-acting muscarinic antagonist (SAMA) could also improve the responsiveness in mild-moderate asthma. Therefore, we aimed to compare the direct effects of inhaling SABA alone, SAMA alone or combining both SABA and SAMA on the central and peripheral airways in asthma.

Methods: Twenty-three patients with mild-moderate BDR in asthma performed dynamic spirometry and impulse oscillometry before (baseline) and multiple timepoints within an hour after inhalation of SABA (salbutamol), SAMA (ipratropium bromide), or both SABA and SAMA at three different visits.

Results: The use of SAMA alone did not show any improvement compared to the use of SABA alone. Inhalation of SABA+SAMA, however, averaged either similar or better BDR than SABA alone in FEV1, MMEF, FVC, R5, R20 and R5-R20. Inhaling SABA+SAMA reached a stable BDR in more patients within 0-10 minutes and also reached the FEV1 (Δ%)>12% faster (3.5 minutes) than inhaling SABA alone (5.1 minutes). Inhaling SABA+SAMA was significantly better than SAMA alone in FEV1 (p = 0.015), MMEF (p = 0.0059) and R20 (p = 0.0049). Using these three variables highlighted a subgroup (30%, including more males) of patients that were more responsive to inhaling SABA+SAMA than SABA alone.

Conclusion: Overall, combining SAMA with SABA was faster and more consistent at increasing the lung function than SABA alone or SAMA alone, and the additive effect was best captured by incorporating peripheral-related variables. Therefore, SAMA should be considered as an add-on reliever for mild-moderate patients with BDR in asthma.

Keywords: BDR; SABA; SAMA; central airway; mild-moderate asthma; peripheral airways.


Conflict of interest statement

The authors report no conflicts of interest in this work.

Figures
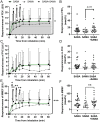
Figure 1
Figure 1
Bronchodilator responsiveness in spirometry readings as the percent (Δ%) change from the baseline for SABA, SAMA and SABA+SAMA. (A) Average percent change from baseline of FEV1 (Δ%) after inhaling SABA alone (■), SAMA alone (▲), or SABA+SAMA (●) at each timepoint. The solid line indicates the 7% cutoff for inclusion to the study and the grey box indicates the 12% threshold for clinically significant BDR. (B) The maximum percent change from baseline of FEV1 (maxΔ%), regardless of timepoint, for each patient with each bronchodilator (Note: graph is not showing 1 patient up around 80%). (C) Average MMEF (Δ%) for each bronchodilator and (D) the MMEF (maxΔ%) for each patient. (E) Average FVC (Δ%) for each bronchodilator (with 1 outlier removed at 10 minutes for SABA) and (F) the FVC (maxΔ%) for each patient. Statistics: change between bronchodilators (significance indicated at each timepoint) and change over time between bronchodilators (significance indicated on right side of graph) were compared with 2-way RM ANOVA, plots depict mean + SD (A, C and E), maximum was compared between bronchodilators with Friedman's test, plots show individual values including lines for median ± IQR (B, D and F), *p<0.05, **p<0.01, n = 23.
Figure 2
Figure 2
Assessing bronchodilator responsiveness of SABA, SAMA and SABA+SAMA using the increase in FEV1 of ≥12% as the cutoff. (A) Bars showing the proportion of patients that reached a maximum improvement of FEV1≥12% (white bar) after inhalation of SABA alone, SAMA alone, or SABA+SAMA. (B) Plot of times that it took to achieve 12% BDR interpolated from exponential plateaus per patient per bronchodilator test. Line presents median. Statistics: Mixed effects analysis, *p<0.05.
Figure 3
Figure 3
Bronchodilator responsiveness in IOS readings as the percent (Δ%) change from the baseline for SABA, SAMA and SABA+SAMA. (A) Average BDR in R5 (Δ%) after inhalation of SABA alone (■), SAMA alone (▲), or SABA+SAMA (●) at each timepoint. (B) Individual values of the maximum BDR of R5 (maxΔ%), regardless of timepoint, for each bronchodilator. (C) Average BDR of R20 (Δ%) for each bronchodilator and (D) the R20 (maxΔ%) for each patient. (E) Average BDR of R5-R20 (Δ%) for each bronchodilator and (F) the R5-R20 (maxΔ%) for each patient. Statistics: change between bronchodilators (significance indicated at each timepoint) and change over time between bronchodilators (significance indicated on right side of graph) were compared with Mixed effects analysis (A, C and E) and plots depict mean + SD. Maximum values were compared between bronchodilators with RM one-way ANOVA (B, D and F) and plots include median ± IQR. *p<0.05, **p<0.01, n = 19–23.
Figure 4
Figure 4
IOS readings of bronchodilator responsiveness (BDR) as the percent (Δ%) from the baseline for all bronchodilators. Average BDR of (A) X5 (Δ%), (B) Fres (Δ%) and (C) AX (Δ%) after inhaling SABA alone (■), SAMA alone (▲), or SABA+SAMA (●) at each timepoint. Statistics: bronchodilator effect over time were compared with Mixed effects analysis, plots depict mean + SD, n = 22–23.
Figure 5
Figure 5
Comparison of the rate of significant change. The timepoint for each variable where the maximum effect was reached and there was no more significant change to future timepoints measured for each bronchodilator test (Supplementary figure 2 and Supplementary figure 3). “<5” minutes indicates no statistical change between baseline and 60 minutes. A missing bar indicates no statistically significant change from Baseline.
Figure 6
Figure 6
Plateau levels of the extrapolated responsiveness curves. The plateau level for each patient at each variable was calculated. Each dot represents a patient that has a plateau that was extrapolated using an exponential plateau up to the first 100 minutes. The total number of patients that reached a plateau within the extrapolated 100 minutes (combined for all patients that reached a plateau in FEV1+FVC+MMEF+R5+R20+R5-R20, the maximum being plateaus in all 23 patients × all 6 variables = 138), is given under each bronchodilator label.
Figure 7
Figure 7
Most responsive subgroup to inhaling SABA+SAMA. Patients were separated based on those who had a higher BDR of all three of the FEV1 (maxΔ%), MMEF (maxΔ%) and R20 (maxΔ%) after inhaling SABA+SAMA compared to SABA alone, defined as “most” responsive (n = 7) and the remaining patients that were “least” responsive (n = 16). (A) Individual paired plots of responsiveness in FEV1, MMEF and R20 after SABA compared to SABA+SAMA. (B) Most and least responders were separated according to sex. Statistics: Spearman correlation comparing Most to Least responsive subgroups, *p<0.05.

Similar articles

References

    1. Asthma. GIf. Global Strategy for Asthma Management and Prevention, 2022; 2022. https://ginasthma.org/gina-reports/. Accessed December 4, 2024.
    1. Graham BL, Steenbruggen I, Miller MR, et al. Standardization of Spirometry 2019 Update. An Official American Thoracic Society and European Respiratory Society Technical Statement. Am J Respir Crit Care Med. 2019;200(8):e70–e88. doi:10.1164/rccm.201908-1590ST - DOI - PMC - PubMed
    1. Janson C, Malinovschi A, Amaral AFS, et al. Bronchodilator reversibility in asthma and COPD: findings from three large population studies. Eur Respir J. 2019;54(3):1900561. doi:10.1183/13993003.00561-2019 - DOI - PubMed
    1. Crisafulli E, Sartori G, Patruno V, Fantin A. Bronchodilator reversibility in patients with asthma and persistent airflow limitation. Lancet Respir Med. 2022;10(11):e94–e95. doi:10.1016/S2213-2600(22)00363-0 - DOI - PubMed
    1. Mauer Y, Taliercio RM. Managing adult asthma: the 2019 GINA guidelines. Cleve Clin J Med. 2020;87(9):569–575. doi:10.3949/ccjm.87a.19136 - DOI - PubMed