The addition of discrimination inhibitors stimulations discrimination potential and N2O emissions were linked to predation among microorganisms in long term nitrogen application and straw returning systems
- PMID: 38264480
- PMCID: PMC10803610
- DOI: 10.3389/fmicb.2023.1337507
The addition of discrimination inhibitors stimulations discrimination potential and N2O emissions were linked to predation among microorganisms in long term nitrogen application and straw returning systems
Abstract
Introduction: Ammonia oxidizing archaea (AOA) and ammonia oxidizing bacteria (AOB) have been proven to be key microorganisms driving the ammonia oxidation process. However, under different fertilization practices, there is a lack of research on the impact of interaction between predators and AOA or AOB on nitrogen cycling at the multi-trophic level.
Methods: In this study, a network-oriented microscopic culture experiment was established based on four different long-term fertilization practices soils. We used the nitrification inhibitors 2-phenyl-4,4,5,5-tetramethylimidazoline-1-oxide-3-oxyl (PTIO) and 3, 4-Dimethylpyrazole phosphate (DMPP) inhibited AOA and AOB, respectively, to explore the impact of interaction between protists and AOA or AOB on nitrogen transformation.
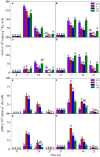
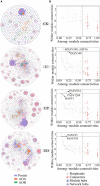
Results: The results showed that long-term nitrogen application promoted the potential nitrification rate (PNR) and nitrous oxide (N2O) emission, and significantly increased the gene abundance of AOB, but had no obvious effect on AOA gene abundance. DMPP significantly reduced N2O emission and PNR, while PTIO had no obvious effect on them. Accordingly, in the multi-trophic microbial network, Cercozoa and Proteobacteria were identified as keystone taxa of protists and AOB, respectively, and were significantly positively correlated with N2O, PNR and nitrate nitrogen. However, Nitrososphaerota archaeon as the keystone species of AOA, had an obvious negative linkage to these indicators. The structural equation model (SEM) showed that AOA and AOB may be competitors to each other. Protists may promote AOB diversity through direct trophic interaction with AOA.
Conclusion: The interaction pattern between protists and ammonia-oxidizing microorganisms significantly affects potential nitrification rate and N2O emission, which has important implications for soil nitrogen cycle.
Keywords: N2O emission; ammonia-oxidizing bacteria (archaea); keystone taxa; potential nitrification rate; predatory relationship; protists.
Copyright © 2024 Jia, Zhou, Ma, Qiu, Zhang, Wang, Zhang, Chen, Ma, Zhao and Xue.
Conflict of interest statement
The authors declare that the research was conducted in the absence of any commercial or financial relationships that could be construed as a potential conflict of interest. The author(s) declared that they were an editorial board member of Frontiers, at the time of submission. This had no impact on the peer review process and the final decision.
Figures


Similar articles
-
Ammonia-oxidizing bacteria rather than ammonia-oxidizing archaea dominate nitrification in a nitrogen-fertilized calcareous soil.Sci Total Environ. 2022 Mar 10;811:151402. doi: 10.1016/j.scitotenv.2021.151402. Epub 2021 Nov 3. Sci Total Environ. 2022. PMID: 34740642
-
Effects of nitrogen application rate and a nitrification inhibitor dicyandiamide on ammonia oxidizers and N2O emissions in a grazed pasture soil.Sci Total Environ. 2013 Nov 1;465:125-35. doi: 10.1016/j.scitotenv.2012.08.091. Epub 2012 Sep 25. Sci Total Environ. 2013. PMID: 23021462
-
[Response of the Soil N2O Emission and Ammonia-oxidizing Microorganism Community to the Maize Straw Return with Reducing Fertilizer in Purple Soil].Huan Jing Ke Xue. 2019 Jan 8;40(1):401-411. doi: 10.13227/j.hjkx.201805125. Huan Jing Ke Xue. 2019. PMID: 30628299 Chinese.
-
Niche Differentiation Among Canonical Nitrifiers and N2O Reducers Is Linked to Varying Effects of Nitrification Inhibitors DCD and DMPP in Two Arable Soils.Microb Ecol. 2023 May;85(4):1434-1447. doi: 10.1007/s00248-022-02006-8. Epub 2022 Apr 14. Microb Ecol. 2023. PMID: 35420314
-
Improving Nitrogen Use Efficiency in Aerobic Rice Based on Insights Into the Ecophysiology of Archaeal and Bacterial Ammonia Oxidizers.Front Plant Sci. 2022 Jun 13;13:913204. doi: 10.3389/fpls.2022.913204. eCollection 2022. Front Plant Sci. 2022. PMID: 35769304 Free PMC article. Review.
References
-
- Anderson M. J., Willis T. J. (2003). Canonical analysis of principal coordinates: A useful method of constrained ordination for ecology. Ecology 84 511–525.
-
- Bai J., Qiu S., Jin L., Wei D., Xu X., Zhao S., et al. (2020). Quantifying soil N pools and N2O emissions after application of chemical fertilizer and straw to a typical chernozem soil. Biol. Fertil. Soils 56 319–329. 10.1007/s00374-019-01422-2 - DOI
LinkOut - more resources
Full Text Sources

