. 2024 Jan 9:17:1297914.
doi: 10.3389/fnins.2023.1297914. eCollection 2023.

Sensorimotor-linked reward modulates smooth pursuit eye movements in monkeys

Affiliations

Sensorimotor-linked reward modulates smooth pursuit eye movements in monkeys

Yongxiang Hu et al. Front Neurosci. .

Abstract

Reward is essential for shaping behavior. Using sensory cues to imply forthcoming rewards, previous studies have demonstrated powerful effects of rewards on behavior. Nevertheless, the impact of reward on the sensorimotor transformation, particularly when reward is linked to behavior remains uncertain. In this study, we investigated how reward modulates smooth pursuit eye movements in monkeys. Three distinct associations between reward and eye movements were conducted in independent blocks. Results indicated that reward increased eye velocity during the steady-state pursuit, rather than during the initiation. The influence depended on the particular association between behavior and reward: a faster eye velocity was linked with reward. Neither rewarding slower eye movements nor randomizing rewards had a significant effect on behavior. The findings support the existence of distinct mechanisms involved in the initiation and steady-state phases of pursuit, and contribute to a deeper understanding of how reward interacts with these two periods of pursuit.

Keywords: initiation; reward; smooth pursuit eye movements; steady state; visual motion.


Conflict of interest statement

The authors declare that the research was conducted in the absence of any commercial or financial relationships that could be construed as a potential conflict of interest. The author(s) declared that they were an editorial board member of Frontiers, at the time of submission. This had no impact on the peer review process and the final decision.

Figures
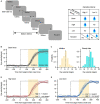
Figure 1
Figure 1
Experimental design and example trials in an example experimental day. (A) Visual stimulation design and sensorimotor-linked reward settings. (B) Horizontal eye velocity as a function of time in the base blocks. Black line is the mean eye velocity trace averaged across individual trials (gray lines). Time interval from 120–270 ms (yellow area) after the onset of target motion is the initiation period of pursuit, and 270–420 ms (cyan area) is the time interval of steady-state pursuit. (C) Distribution of eye velocity during the initiation (left) and steady state (right) of pursuit eye movements. (D) Eye velocity traces in a high block. Monkeys only received rewards within trials with higher eye velocity during the initiation period (red solid lines) than the threshold in the associated base block (the black line). (E) Eye velocity traces in the low block. Monkeys only received reward in trials with lower eye velocity during the initiation period (blue solid lines) than that in the associated base block (the black line).
Figure 2
Figure 2
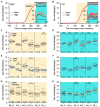
Comparisons of smooth pursuit eye movements in distinct sensorimotor-linked reward settings. (A,B) The average eye velocities across all base blocks (gray trace) compared to those across all high blocks (red trace) along the rightward and leftward directions in an example monkey. The black dots shown on the top of the graph indicated the time points at which significant differences of eye velocities were observed. The insets offer a magnified representation of the eye responses during the period. (C,E,G) Comparisons show the eye velocities in the high block (C), the low block (E), the random block (G), and their associated base blocks during the initiation of pursuit. (D,F,H) Comparisons of eye velocities during the steady state of pursuit. Gray lines show data in a given reward setting block and its associated base block. Each circle and black line show mean data across blocks. Error bars: Mean ± SEM. *p < 0.05; **p < 0.01; ***p < 0.001, Paired Student’s t-test.
Figure 3
Figure 3
Quantitative assessment of relationships between ocular responses in the steady state and the initiation in various reward settings. (A–C) Demonstration of how the eye velocities during the steady state of pursuit depending on the eye velocity during the pursuit initiation in an experimental day of the example monkey. Solid lines are linear fits for data in different reward settings (color lines) and their base block (gray lines). The distribution of eye velocities is displayed in the histograms. Each circle represents the data of individual trial in that block. (D–I) Quantitative evaluation of ocular responses’ linear fitting in the three reward settings: the intercept (D–F) and the slope (G–I). Each circle and line show data in a given reward setting block and its associated base block. Error bars: Mean ± SEM. *p < 0.05; **p < 0.01; Paired Student’s t-test.
Figure 4
Figure 4
Comparisons of eye velocities as a function of sets of 10 trials. (A,C,E) The mean eye velocity within a 150 ms interval of the initiation of pursuit, from 120 to 270 ms after target motion. (B,D,F) The mean eye velocity within a 150 ms of the steady-state pursuit, from 270–420 ms after target motion. The eye velocities in the high block (red lines in A,B), the low block (blue lines in C,D), the random block (yellow lines in E,F), and their respective base blocks (gray lines) are compared. The n denotes the total number of blocks across experimental days and monkeys within each specific reward setting. Error bars: Mean ± SEM. *p < 0.05; **p < 0.01.
Figure 5
Figure 5
The onset time of pursuit was consistent under distinct reward settings. (A) The method utilized to estimate the latency of pursuit in single trials. The mean eye velocity (black solid trace) within the gray shading area, ranging from 20 ms before to 100 ms after the pursuit initiation (black dashed line), is set as the template. In order to obtain the best least-squares fit to the eye trace of single trial, the template was adjusted by shifting on the time scale (the x axis, red dashed traces) and scaling on the eye velocity scale (the y axis, magenta dashed traces). (B–D) The mean latency of pursuit in the individual block under distinct reward settings: the high block (B), MA: n = 21, MC: n = 26, ML: n = 25; the low block (C), MA: n = 21, MC: n = 24, ML: n = 25; and the random block (D), MA: n = 49, MC: n = 29, ML: n = 22. Each line and the paired circles present data in a given reward setting block and its associated base block. Error bars: Mean ± SEM.
Figure 6
Figure 6
Trial-over-trial eye velocity changes vary in distinct sensorimotor-linked reward settings. (A–F) The eye velocity as a function of time when the eye velocity in the previous trial was faster [(A–C) FE subgroup] or slower [(D–F) SE subgroup] than the average response of the base blocks. Solid lines represent eye responses on the current trial and dashed lines represent data on the prior one trial. The gray lines are base blocks and color lines are high block (red lines), low block (blue lines) and random block (orange lines). Cyan shading represents the steady state period. Error bars: Mean ± SEM. (G–I) Difference of mean trial-over-trial change in the steady state between the base block and its associated high (G), low (H) or random (I) block. The FE (dark color) and SE (light color) subgroups are depicted, respectively. The data distributions of individual blocks were color-coded. Boxes indicate average values, with 25% quartile values and 75% quartile values. Error bars indicate minimum and maximum values across all blocks. **p < 0.01; ***p < 0.001; Paired Student’s t-test.
Figure 7
Figure 7
Conceptual scheme for sensorimotor-linked reward interacts with the sensorimotor transformation for smooth pursuit eye movements. Black schematic parts were inspired by Behling and Lisberger (2020). Red schematic parts were observed in this study. Our results depicted distinct reward interaction mechanisms for gain modulations in the pursuit system: the sensorimotor-linked reward can facilitate eye movements during the steady state (solid arrow to g2), as opposed to the initiation (dashed arrow to g1). Rewarding greater eye movements could work as a condition between the motor feedback and reward processing to elicit reward modulation on the neural system.

Similar articles

References

    1. Behling S., Lisberger S. G. (2020). Different mechanisms for modulation of the initiation and steady-state of smooth pursuit eye movements. J. Neurophysiol. 123, 1265–1276. doi: 10.1152/jn.00710.2019, PMID: - DOI - PMC - PubMed
    1. Blaisdell A. P., Sawa K., Leising K. J., Waldmann M. R. (2006). Causal reasoning in rats. Science 311, 1020–1022. doi: 10.1126/science.1121872 - DOI - PubMed
    1. Blanchard T. C., Hayden B. Y., Bromberg-Martin E. S. (2015). Orbitofrontal cortex uses distinct codes for different choice attributes in decisions motivated by curiosity. Neuron 85, 602–614. doi: 10.1016/j.neuron.2014.12.050, PMID: - DOI - PMC - PubMed
    1. Botschko Y., Yarkoni M., Joshua M. (2018). Smooth pursuit eye movement of monkeys naive to laboratory setups with pictures and artificial stimuli. Front. Syst. Neurosci. 12:15. doi: 10.3389/fnsys.2018.00015, PMID: - DOI - PMC - PubMed
    1. Bourrelly C., Quinet J., Cavanagh P., Goffart L. (2016). Learning the trajectory of a moving visual target and evolution of its tracking in the monkey. J. Neurophysiol. 116, 2739–2751. doi: 10.1152/jn.00519.2016, PMID: - DOI - PMC - PubMed

LinkOut - more resources