. 2024 Jan 9:2:1345643.
doi: 10.3389/fnimg.2023.1345643. eCollection 2023.

A reappraisal of the default mode and frontoparietal networks in the common marmoset brain

Affiliations

A reappraisal of the default mode and frontoparietal networks in the common marmoset brain

Takuto Okuno et al. Front Neuroimaging. .

Abstract

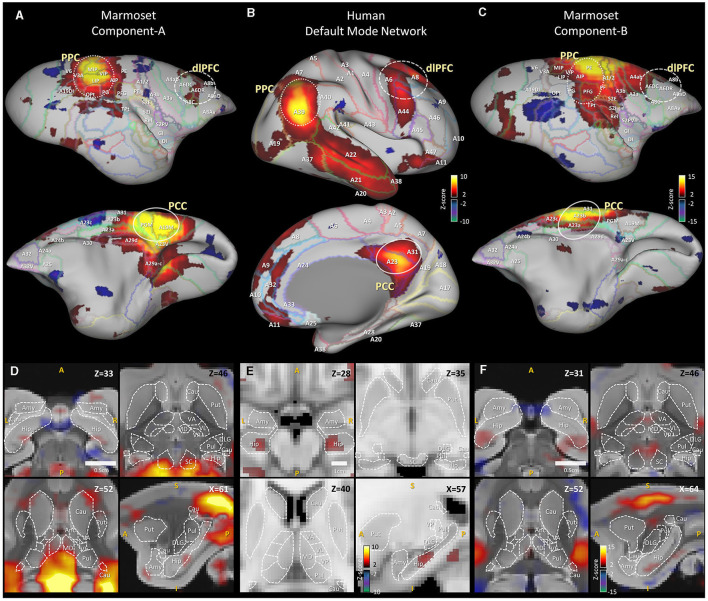
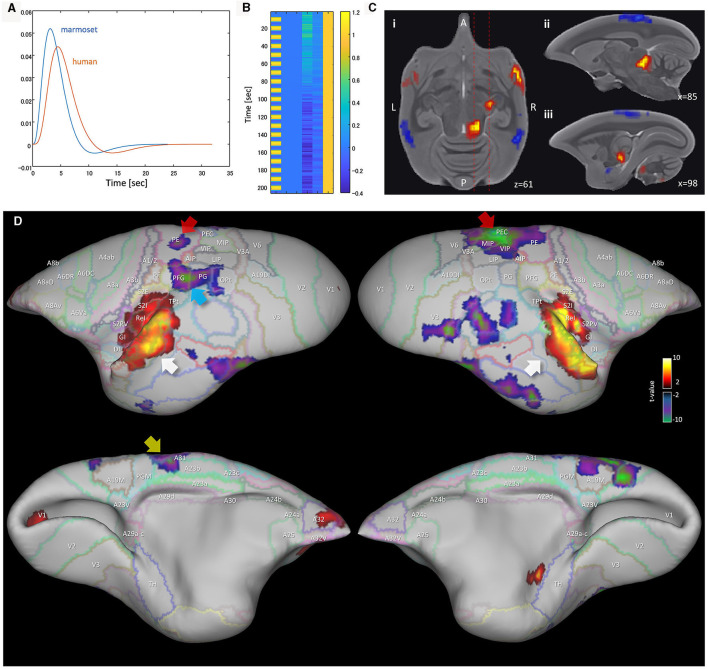
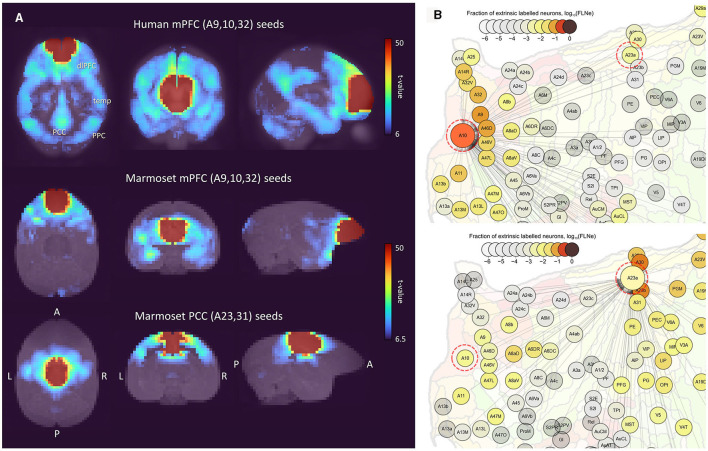
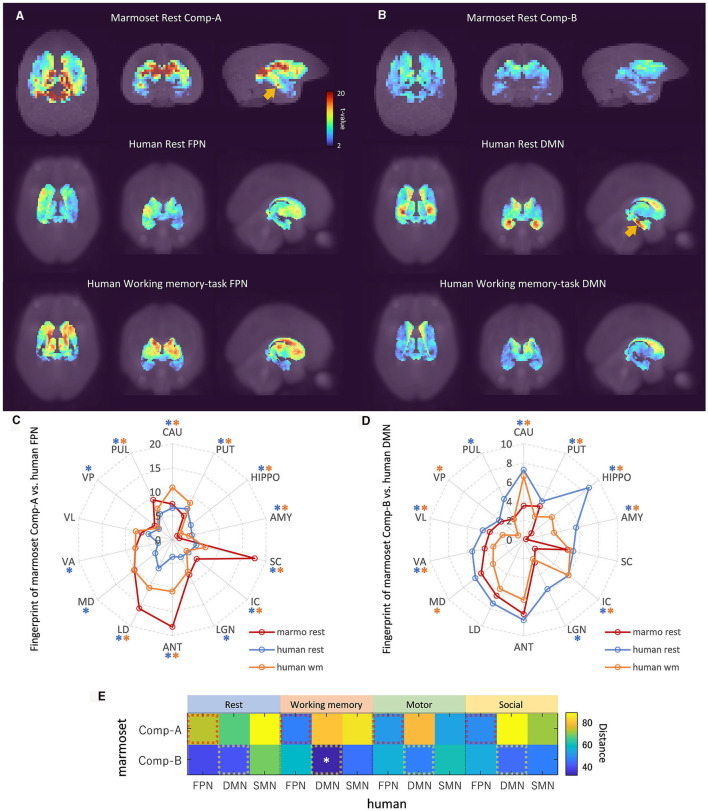
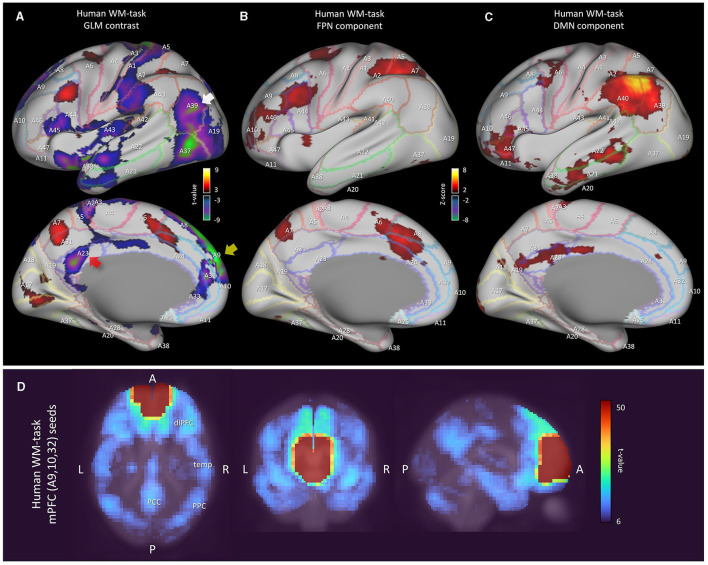
In recent years the common marmoset homolog of the human default mode network (DMN) has been a hot topic of discussion in the marmoset research field. Previously, the posterior cingulate cortex regions (PGM, A19M) and posterior parietal cortex regions (LIP, MIP) were defined as the DMN, but some studies claim that these form the frontoparietal network (FPN). We restarted from a neuroanatomical point of view and identified two DMN candidates: Comp-A (which has been called both the DMN and FPN) and Comp-B. We performed GLM analysis on auditory task-fMRI and found Comp-B to be more appropriate as the DMN, and Comp-A as the FPN. Additionally, through fingerprint analysis, a DMN and FPN in the tasking human was closer to the resting common marmoset. The human DMN appears to have an advanced function that may be underdeveloped in the common marmoset brain.

Keywords: common marmoset; default mode network; fMRI; frontoparietal network; general linear model (GLM); independent component analysis (ICA).


Conflict of interest statement

The authors declare that the research was conducted in the absence of any commercial or financial relationships that could be construed as a potential conflict of interest.

Figures

Figure 1
Figure 1
Human default mode network component and awake marmoset ICA components. (A) Right cortical surface of the marmoset, (top) lateral side, (bottom) medial side. Awake resting-state marmoset ICA component-A, selected from 30 components, mapped onto the brain surface. Z-score range is 2 to 15 for positive, −2 to −15 for negative. (B) Right cortical surface of the human brain. Human resting-state default mode network is mapped onto the surface. Z-score range is 2 to 10 for positive, −2 to −10 for negative. (C) Right cortical surface of the marmoset brain. Awake resting-state marmoset ICA component-B, mapped onto the brain surface. (D) Horizontal views (top left, right and bottom left) and a sagittal view (bottom right) of awake marmoset ICA component-A. Scale bar shows 0.5 cm. Z-score range is from 2 to 15. (E) Horizontal views (top left, right and bottom left) and a sagittal view (bottom right) of human resting-state default mode network component. Z-score range is from 2 to 10. Scale bar shows 1 cm. (F) Horizontal views (top left, right and bottom left) and a sagittal view (bottom right) of awake marmoset ICA component-B. Cau, Caudate; Put, putamen; Hip, hippocampus; Amy, amygdala; SC, superior colliculus; Anc, thalamus anterior nuclear complex; LD, laterodorsal; MD, mediodorsal; VA, ventral anterior; VL, ventral lateral; VP, ventral posterior; Pul, pulvinar; DLG, lateral geniculate.
Figure 2
Figure 2
GLM analysis results of awake marmoset passive auditory task-fMRI. (A) Canonical hemodynamic response function (HRF) for the marmoset and human. (B) Example design matrix for GLM analysis (TR = 3 seconds). (C) GLM analysis result (auditory stimuli > rest) of sub-cortical regions. (i) Horizontal plane (z = 61) of marmoset brain shows several activated regions. (ii) Sagittal plane (x = 85) shows activated region of inferior colliculus. (iii) Sagittal plane (x = 98) shows activated region of medial geniculate nucleus. (D) GLM analysis result (auditory stimuli > rest) mapped to the marmoset cortical surface. White arrow shows activated region of auditory cortex. Red arrow shows deactivated region of PEC, PE. Yellow arrow shows deactivated regions of A23b, A31. Cyan arrow shows the deactivated region of PFG.
Figure 3
Figure 3
Multiseed-based connectivity analysis results of human and awake marmoset resting-state fMRI. (A) Three-dimensional maximum projection of t-values from multiple seeds are shown. (Top) Result for seeds in human mPFC (part of A9, A10 and A32 areas). (Middle) Result for seeds in marmoset mPFC (parts of A9, A10, and A32). (Bottom) Result for seeds in marmoset PCC (parts of A23a, A23b, and A31). (B) Retrograde tracing results of marmoset cortex from the Marmoset Brain Connectivity Atlas (Majka et al., 2020). (Top) Injection point in area A10. (Bottom) Injection point in area A23a.
Figure 4
Figure 4
Fingerprint analysis result between awake resting marmoset and resting/tasking human ICA components. (A) Example fingerprint result of three-dimensional maximum projection of t-values. Correlation between Comp-A time-series and voxel time-series in sub-cortical regions was calculated. The closest two ICA components are shown at the top row (awake resting marmoset) and bottom row (wm-task human). The middle row shows resting human for reference. t-value color bar is the same for all. (B) Example fingerprint result of three-dimensional maximum projection of t-values (Comp-B). The bottom row shows wm-task human. (C) Radar chart of fingerprint result of 14 sub-cortex regions (resting marmoset Comp-A, resting and wm-task human FPN). Blue and orange asterisks show the significantly different t-values between resting marmoset vs. resting human FPN, and resting marmoset vs. wm-task human FPN (p < 0.05) in each ROI by the non-parametric Steel-test and Bonferroni correction. (D) Radar chart of DMN fingerprint result of 14 sub-cortex regions (resting marmoset Comp-B, resting and wm-task human DMN). Blue and orange asterisks show the significantly different t-values between resting marmoset vs. resting human DMN, and resting marmoset vs. wm-task human DMN (p < 0.05) in each ROI by non-parametric Steel-test and Bonferroni correction. (E) Fingerprint distance results between awake resting marmoset components and resting/task human components. White asterisks show the significantly close distance (p < 0.05) by permutation test and Bonferroni correction.
Figure 5
Figure 5
Analysis results of human working memory-task fMRI data. (A) Left cortical surface of the human brain. GLM result of 2-back vs. 0-back contrast mapped onto the surface. The t-value range is 5 to 9.1 for positive, −5 to −10.6 for negative. (B) Left cortical surface of the human brain. Wm-task human FPN component is mapped onto the surface. Z-value range is 3 to 15 for positive, −3 to −15 for negative. (C) Left cortical surface of the human brain. Wm-task human DMN component is mapped onto the surface. (D) Multiseed-based connectivity analysis result of human wm-task fMRI using mPFC seeds (part of A9, A10 and A32 areas). Three-dimensional maximum projection of t-values from multiple seeds are shown.

Similar articles

Cited by

References

    1. Barks S. K., Parr L. A., Rilling J. K. (2013). The default mode network in chimpanzees (Pan troglodytes) is similar to that of humans. Cereb. Cortex 25, 538–544. 10.1093/cercor/bht253 - DOI - PMC - PubMed
    1. Beckmann C. F., Smith S. M. (2004). Probabilistic independent component analysis for functional magnetic resonance imaging. IEEE Trans. Med. Imag. 23, 137–152. 10.1109/TMI.2003.822821 - DOI - PubMed
    1. Behzadi Y., Restom K., Liau J., Liu T. T. (2007). A component based noise correction method (CompCor) for BOLD and perfusion based fMRI. Neuroimage 37, 90–101. 10.1016/j.neuroimage.2007.04.042 - DOI - PMC - PubMed
    1. Belcher A. M., Yen C. C., Stepp H., Gu H., Lu H., Yang Y., et al. . (2013). Large-scale brain networks in the awake, truly resting marmoset monkey. J. Neurosci. 33, 16796–16804. 10.1523/JNEUROSCI.3146-13.2013 - DOI - PMC - PubMed
    1. Binder J. R. (2012). Task-induced deactivation and the “resting” state. Neuroimage 62, 1086–1091. 10.1016/j.neuroimage.2011.09.026 - DOI - PMC - PubMed