High-level expression of leghemoglobin in Kluyveromyces marxianus by remodeling the heme metabolism pathway
- PMID: 38264583
- PMCID: PMC10804453
- DOI: 10.3389/fbioe.2023.1329016
High-level expression of leghemoglobin in Kluyveromyces marxianus by remodeling the heme metabolism pathway
Abstract
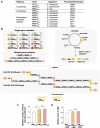
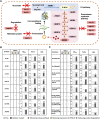
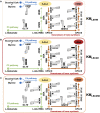
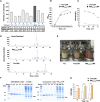
Soy leghemoglobin, when bound to heme, imparts a meat-like color and flavor and can serve as a substitute for animal-derived proteins. Enhancing cellular heme synthesis improves the recombinant expression of leghemoglobin in yeast. To achieve high-level expression of leghemoglobin A (LBA) in Kluyveromyces marxianus, a food-safe yeast, large-scale heme synthesis modules were transferred into K. marxianus using yeast artificial chromosomes (KmYACs). These modules contained up to 8 native and heterologous genes to promote the supply of heme precursors and downstream synthesis. Next, eight genes inhibiting heme or LBA synthesis were individually or combinatorially deleted, with the lsc1Δssn3Δ mutant yielding the best results. Subsequently, heme synthesis modules were combined with the lsc1Δssn3Δ mutant. In the resulting strains, the module genes were all actively expressed. Among these module genes, heterologous S. cerevisiae genes in the downstream heme synthesis pathway significantly enhanced the expression of their counterparts in K. marxianus, resulting in high heme content and LBA yield. After optimizing the medium recipe by adjusting the concentrations of glucose, glycine, and FeSO4·7H2O, a heme content of 66.32 mg/L and an intracellular LBA titer of 7.27 g/L were achieved in the engineered strain in a 5 L fermentor. This represents the highest intracellular expression of leghemoglobin in microorganisms to date. The leghemoglobin produced by K. marxianus can be utilized as a safe ingredient for plant-based protein products.
Keywords: Kluyveromyces marxianus; heme biosynthesis; high-level expression; leghemoglobin; yeast artificial chromosomes.
Copyright © 2024 Tian, Wu, Wu, Lu, Wang, Lin, Liu, Zhou, Yu and Lu.
Conflict of interest statement
The authors declare that the research was conducted in the absence of any commercial or financial relationships that could be construed as a potential conflict of interest.
Figures


Similar articles
-
Transfer of disulfide bond formation modules via yeast artificial chromosomes promotes the expression of heterologous proteins in Kluyveromyces marxianus.mLife. 2024 Mar 22;3(1):129-142. doi: 10.1002/mlf2.12115. eCollection 2024 Mar. mLife. 2024. PMID: 38827505 Free PMC article.
-
High-level secretory production of leghemoglobin in Pichia pastoris through enhanced globin expression and heme biosynthesis.Bioresour Technol. 2022 Nov;363:127884. doi: 10.1016/j.biortech.2022.127884. Epub 2022 Sep 5. Bioresour Technol. 2022. PMID: 36067892
-
Genome engineering of Kluyveromyces marxianus for high D-( -)-lactic acid production under low pH conditions.Appl Microbiol Biotechnol. 2023 Aug;107(16):5095-5105. doi: 10.1007/s00253-023-12658-2. Epub 2023 Jul 5. Appl Microbiol Biotechnol. 2023. PMID: 37405435
-
Kluyveromyces marxianus as a host for heterologous protein synthesis.Appl Microbiol Biotechnol. 2016 Jul;100(14):6193-6208. doi: 10.1007/s00253-016-7645-y. Epub 2016 Jun 3. Appl Microbiol Biotechnol. 2016. PMID: 27260286 Review.
-
Kluyveromyces marxianus: An emerging yeast cell factory for applications in food and biotechnology.Int J Food Microbiol. 2020 Nov 16;333:108818. doi: 10.1016/j.ijfoodmicro.2020.108818. Epub 2020 Aug 12. Int J Food Microbiol. 2020. PMID: 32805574 Review.
Cited by
-
Secretory Production of Plant Heme-Containing Globins by Recombinant Yeast via Precision Fermentation.Foods. 2025 Apr 20;14(8):1422. doi: 10.3390/foods14081422. Foods. 2025. PMID: 40282823 Free PMC article.
-
Metabolic engineering of yeast to efficiently synthesize heme and hemoproteins: recent advance and prospects.FEMS Yeast Res. 2025 Jan 30;25:foaf019. doi: 10.1093/femsyr/foaf019. FEMS Yeast Res. 2025. PMID: 40228812 Free PMC article. Review.
-
Alien Chromosome Serves as a Novel Platform for Multiple Gene Expression in Kluyveromyces marxianus.Microorganisms. 2025 Feb 25;13(3):509. doi: 10.3390/microorganisms13030509. Microorganisms. 2025. PMID: 40142402 Free PMC article.
-
Enhancement of Antioxidant Activity, Stability, and Structure of Heme-Peptides by L-Lysine.Foods. 2025 Jan 9;14(2):192. doi: 10.3390/foods14020192. Foods. 2025. PMID: 39856859 Free PMC article.
-
Characterization and optimization of mnn11Δ-mediated enhancement in heterologous protein production in Kluyveromyces marxianus.Microb Cell Fact. 2025 Mar 4;24(1):50. doi: 10.1186/s12934-025-02676-2. Microb Cell Fact. 2025. PMID: 40033357 Free PMC article.
References
-
- Amberg D. C., Burke D. J., Strathern J. N. (2005). Methods in yeast genetics: a cold spring harbor laboratory course manual. Cold Spring Harbor, New York, United States: Cold Spring Harbor Laboratory Press.
-
- Arredondo-Peter R., Moran J. F., Sarath G., Luan P., Klucas R. V. (1997). Molecular cloning of the cowpea leghemoglobin II gene and expression of its cDNA in Escherichia coli. Purification and characterization of the recombinant protein. Plant Physiol. 114 (2), 493–500. 10.1104/pp.114.2.493 - DOI - PMC - PubMed
LinkOut - more resources
Full Text Sources

