

Patient years lost due to cytomegalovirus serostatus mismatching in the scientific registry of transplant recipients
- PMID: 38264645
- PMCID: PMC10803440
- DOI: 10.3389/fimmu.2023.1292648
Patient years lost due to cytomegalovirus serostatus mismatching in the scientific registry of transplant recipients
Abstract
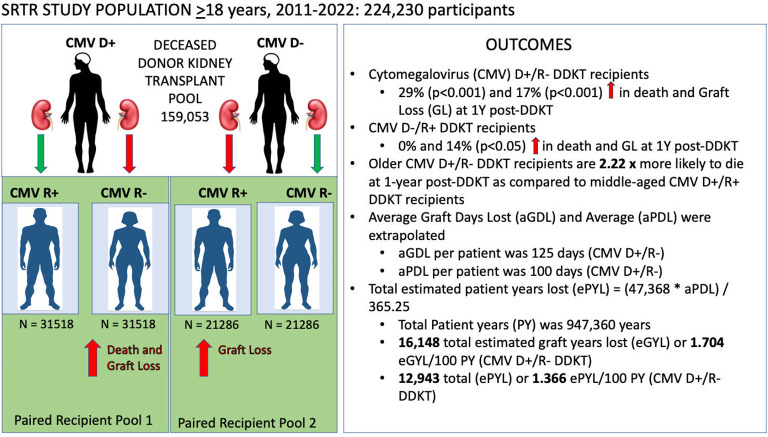
Background: The cytomegalovirus (CMV) mismatch rate in deceased donor kidney transplant (DDKT) recipients in the US remains above 40%. Since CMV mismatching is common in DDKT recipients, the cumulative effects may be significant in the context of overall patient and graft survival. Our primary objective was to describe the short- and long-term risks associated with high-risk CMV donor positive/recipient negative (D+/R-) mismatching among DDKT recipients with the explicit goal of deriving a mathematical mismatching penalty.
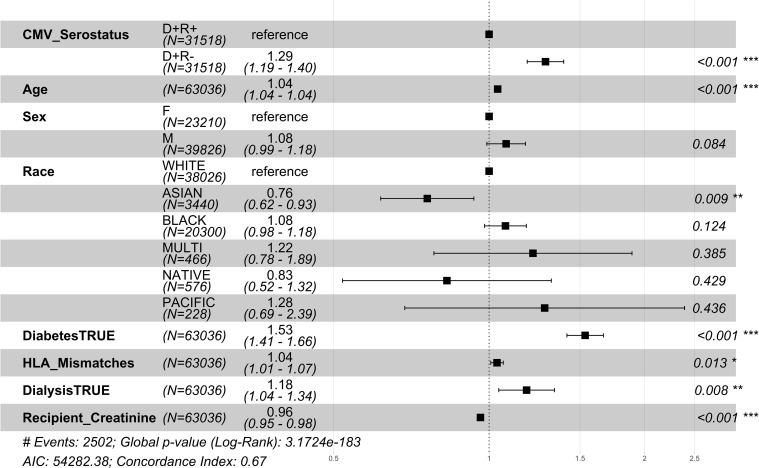
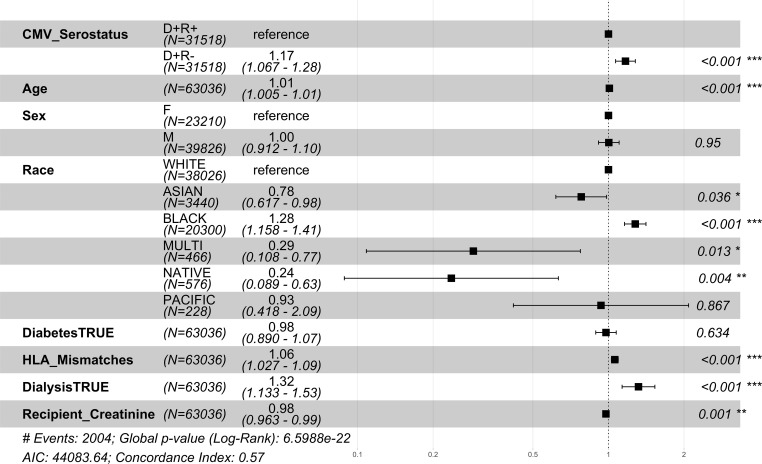
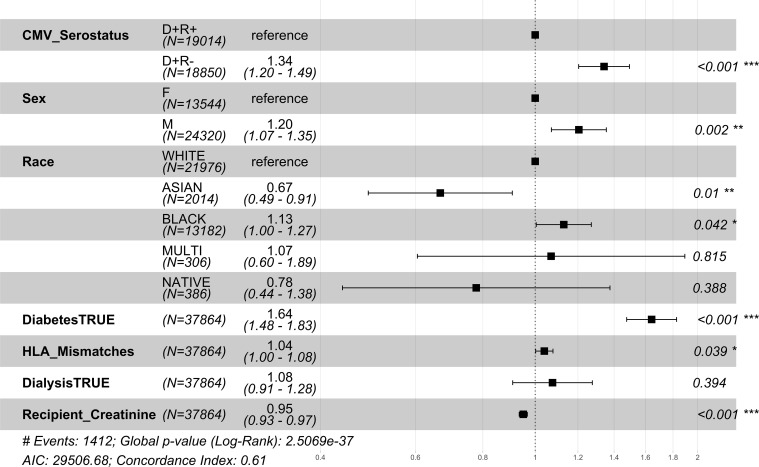
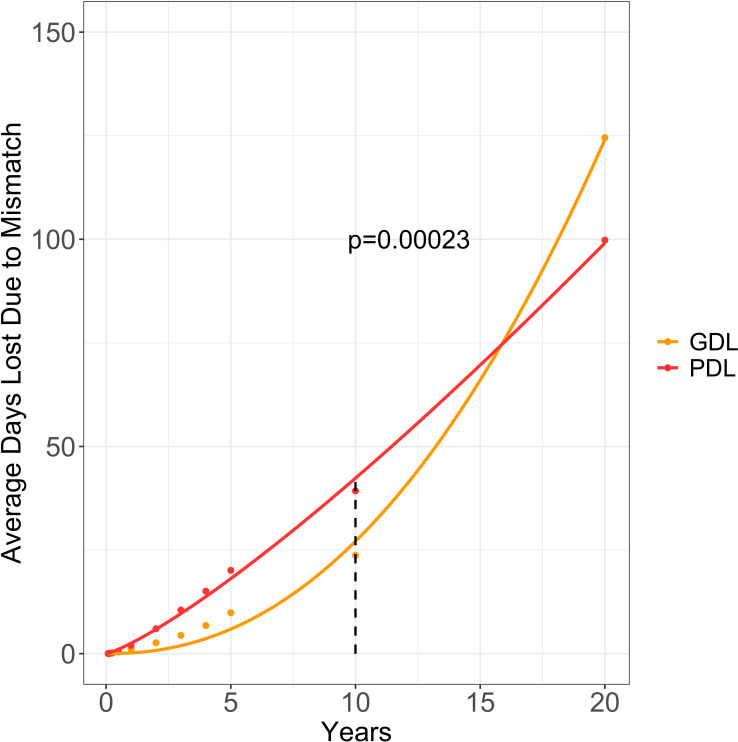
Methods: We conducted a retrospective, secondary analysis of the Scientific Registry of Transplant Recipients (SRTR) database using donor-matched DDKT recipient pairs (N=105,608) transplanted between 2011-2022. All-cause mortality and graft failure hazard ratios were calculated from one year to ten years post-DDKT. All-cause graft failure included death events. Survival curves were calculated using the Kaplan-Meier estimation at 10 years post-DDKT and extrapolated to 20 years to provide the average graft days lost (aGDL) and average patient days lost (aPDL) due to CMV D+/R- serostatus mismatching. We also performed an age-based stratification analysis to compare the relative risk of CMV D+ mismatching by age.
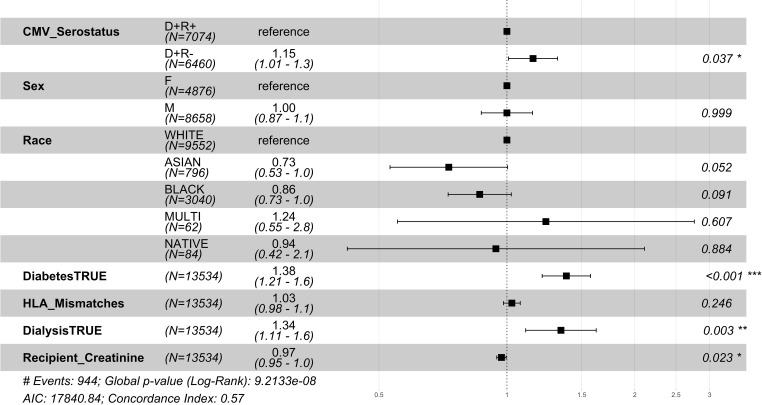
Results: Among 31,518 CMV D+/R- recipients, at 1 year post-DDKT, the relative risk of death increased by 29% (p<0.001), and graft failure increased by 17% (p<0.001) as compared to matched CMV D+/R+ group (N=31,518). Age stratification demonstrated a significant increase in the risk associated with CMV mismatching in patients 40 years of age and greater. The aGDL per patient due to mismatching was 125 days and the aPDL per patient was 100 days.
Conclusion: The risks of CMV D+/R- mismatching are seen both at 1 year post-DDKT period and accumulated throughout the lifespan of the patient, with the average CMV D+/R- recipient losing more than three months of post-DDKT survival time. CMV D+/R- mismatching poses a more significant risk and a greater health burden than previously reported, thus obviating the need for better preventive strategies including CMV serodirected organ allocation to prolong lifespans and graft survival in high-risk patients.
Keywords: CMV; graft; kidney; serostatus; survival; transplant.
Copyright © 2024 Abidi, Schold, Kaplan, Weinberg, Erlandson and Malamon.
Conflict of interest statement
MA was employed by Merck Corporation. KE was employed by Gilead Sciences, Merck Corporation, and ViiV HealthCare Limited. The remaining authors declare that the research was conducted in the absence of any commercial or financial relationships that could be construed as a potential conflict of interest.
Figures
Similar articles
-
Impact of donor and recipient cytomegalovirus serology on long-term survival of heart transplant recipients.Transpl Infect Dis. 2019 Feb;21(1):e13015. doi: 10.1111/tid.13015. Epub 2018 Nov 19. Transpl Infect Dis. 2019. PMID: 30358023
-
Association of Donor and Recipient Cytomegalovirus Serostatus on Graft and Patient Survival in Liver Transplant Recipients.Liver Transpl. 2021 Sep;27(9):1302-1311. doi: 10.1002/lt.26045. Epub 2021 Jul 31. Liver Transpl. 2021. PMID: 33687777 Free PMC article.
-
The differential impact of size mismatch in live versus deceased donor kidney transplant.Clin Transplant. 2021 Jun;35(6):e14310. doi: 10.1111/ctr.14310. Epub 2021 Apr 27. Clin Transplant. 2021. PMID: 33818840
-
Cytomegalovirus serostatus pairing and deceased donor kidney transplant outcomes in adult recipients with antiviral prophylaxis.Transplantation. 2010 Nov 27;90(10):1091-8. doi: 10.1097/TP.0b013e3181f7c053. Transplantation. 2010. PMID: 20885340
-
Discordance in cytomegalovirus viremia in kidney recipients from the same donor is associated with the worst outcomes.Clin Transplant. 2023 Jun;37(6):e14979. doi: 10.1111/ctr.14979. Epub 2023 Mar 26. Clin Transplant. 2023. PMID: 36967240 Review.
Cited by
-
The Colorado Heart Failure Acuity Risk Model: A Mortality Model for Waitlisted Cardiac Transplant Patients.JACC Adv. 2024 Dec 13;4(1):101449. doi: 10.1016/j.jacadv.2024.101449. eCollection 2025 Jan. JACC Adv. 2024. PMID: 39759431 Free PMC article.
-
Aging and Infections in Solid Organ Transplantation: Unchartered Territory.Transpl Infect Dis. 2025 Jan-Feb;27(1):e14431. doi: 10.1111/tid.14431. Epub 2024 Dec 28. Transpl Infect Dis. 2025. PMID: 39731625 Free PMC article. No abstract available.