. 2023 Jul 27;3(6):20220140.
doi: 10.1002/EXP.20220140. eCollection 2023 Dec.

Tumor microenvironment-responsive delivery nanosystems reverse immunosuppression for enhanced CO gas/immunotherapy

Affiliations

Tumor microenvironment-responsive delivery nanosystems reverse immunosuppression for enhanced CO gas/immunotherapy

Beibei Chen et al. Exploration (Beijing). .

Abstract

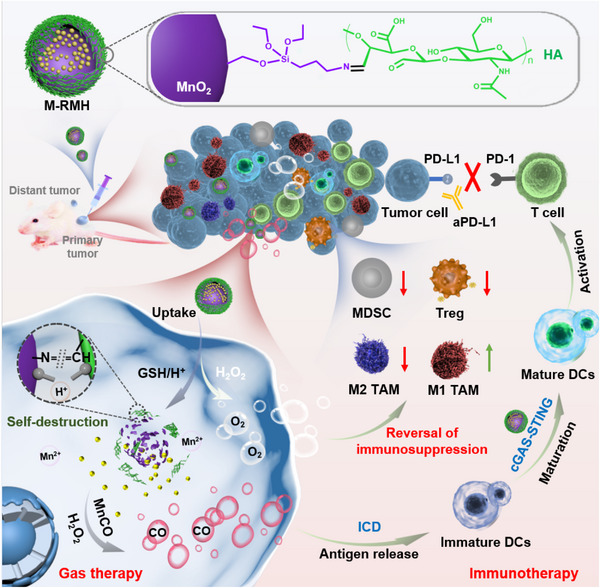
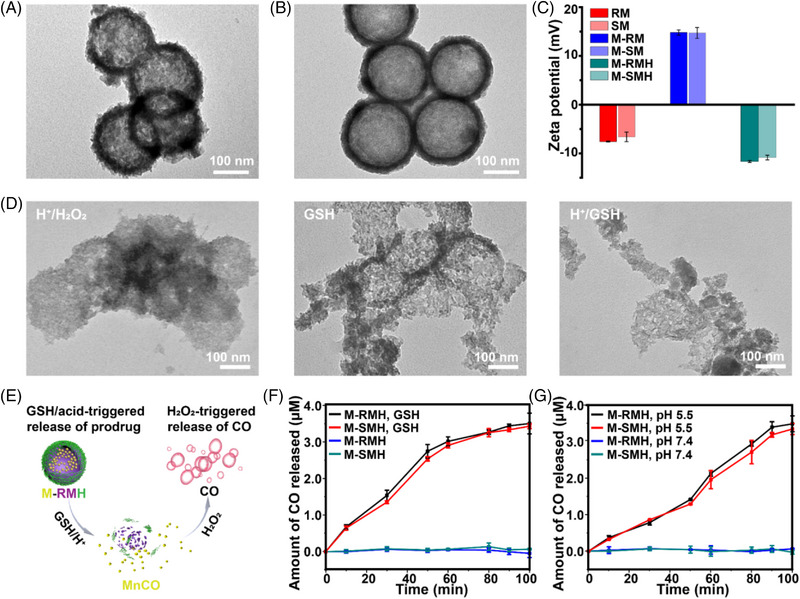
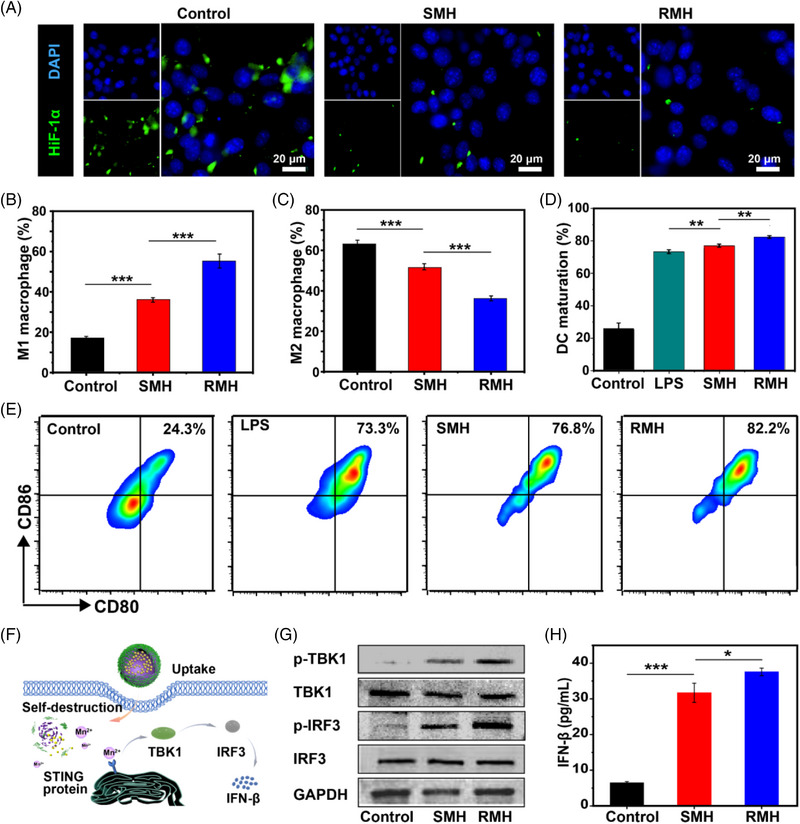
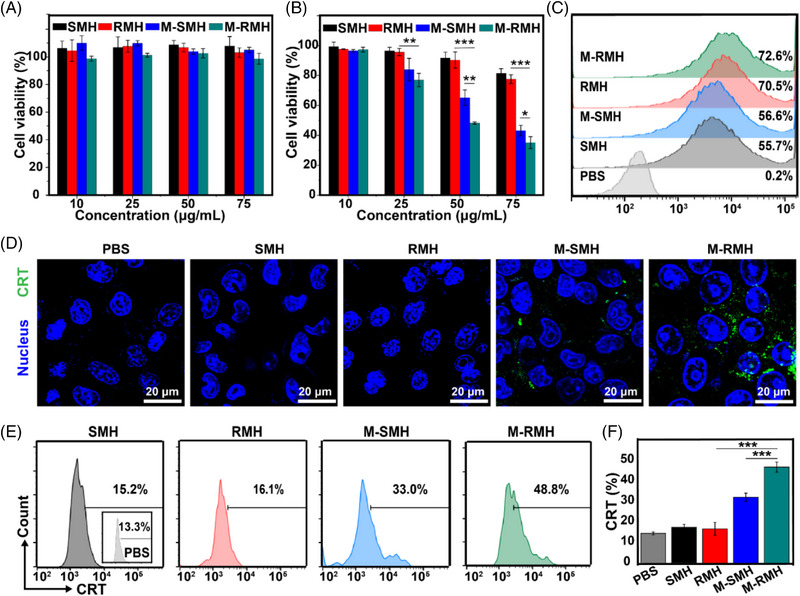
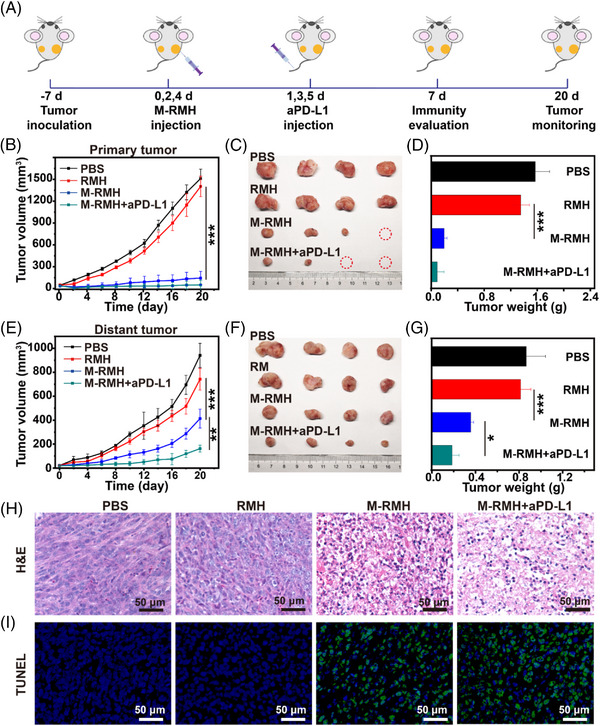
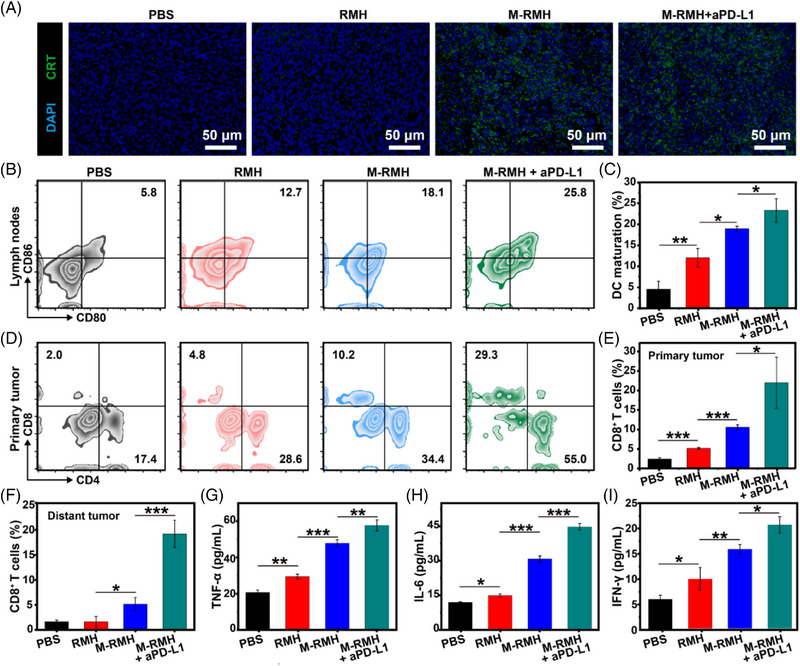
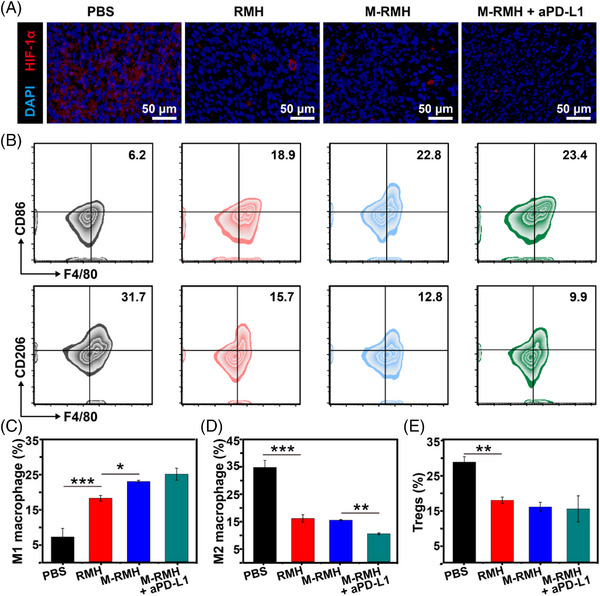
Carbon monoxide (CO) gas therapy demonstrates great potential to induce cancer cell apoptosis and antitumor immune responses, which exhibits tremendous potential in cancer treatment. However, the therapeutic efficacy of CO therapy is inhibited by the immunosuppressive tumor microenvironment (TME). Herein, a facile strategy is proposed to construct hollow-structured rough nanoplatforms to boost antitumor immunity and simultaneously reverse immunosuppression by exploring intrinsic immunomodulatory properties and morphological optimization of nanomaterials. The TME-responsive delivery nanosystems (M-RMH) are developed by encapsulating the CO prodrug within hollow rough MnO2 nanoparticles and the subsequent surface functionalization with hyaluronic acid (HA). Rough surfaces are designed to facilitate the intrinsic properties of HA-functionalized MnO2 nanoparticles (RMH) to induce dendritic cell maturation and M1 macrophage polarization by STING pathway activation and hypoxia alleviation through enhanced cellular uptake. After TME-responsive degradation of RMH, controlled release of CO is triggered at the tumor site for CO therapy to activate antitumor immunity. More importantly, RMH could modulate immunosuppressive TME by hypoxia alleviation. After the combination with aPD-L1-mediated checkpoint blockade therapy, robust antitumor immune responses are found to inhibit both primary and distant tumors. This work provides a facile strategy to construct superior delivery nanosystems for enhanced CO/immunotherapy through efficient activation of antitumor immune responses and reversal of immunosuppression.

Keywords: CO therapy; hypoxia alleviation; rough surface; tumor microenvironment.


Conflict of interest statement

The authors declare no conflicts of interest.

Figures

FIGURE 1
FIGURE 1
Schematic illustration of TME‐responsive M‐RMH to activate immune responses induced by gas therapy and reverse immunosuppression for complementary gas/immunotherapy.
FIGURE 2
FIGURE 2
TEM images of (A) RM and (B) SM. (C) Zeta potentials of different nanoparticles (Mean ± SD, n = 3). (D) TEM images of M‐RMH after various treatments. (E) Schematic illustration of nanoparticle‐mediated CO release. CO release profiles from M‐RMH or M‐SMH in buffer solutions containing H2O2 (F) with or without GSH, and (G) with different pH values.
FIGURE 3
FIGURE 3
Immunomodulatory effects of RMH and SMH by alleviating hypoxia. (A) Immunofluorescence analysis of HIF‐1α expression of 4T1 cells after different treatments. Flow cytometric analysis of (B) M1 macrophages (CD11b+CD86+) and (C) M2 macrophages (CD11b+CD206+) after incubation with RM and SM (Mean ± SD, n = 3). (D) Flow cytometric analysis and (E) quantification of CD80 and CD86 expression on BMDCs (gated on CD11c+ DCs) after different treatments (Mean ± SD, n = 3). (F) Schematic illustration of nanoparticles‐mediated activation of the STING pathway. (G) Western blot assay of p‐TBK1, TBK1, p‐IRF3, and IRF3 expression in the BMDCs after different treatments. (H) Secretion of IFN‐β secreted in BMDC suspensions after the incubation with SMH and RMH (Mean ± SD, n = 3). *p < 0.05, **p < 0.01, ***p < 0.001, analyzed by one‐way ANOVA with Tukey's test.
FIGURE 4
FIGURE 4
Cell viability of (A) HEK293 cells and (B) 4T1 cells after different treatments (Mean ± SD, n = 4). (C) Flow cytometric analysis of 4T1 cells treated with FITC‐labeled SMH, RMH, M‐SMH, and M‐RMH for 4 h. (D) CLSM images of CRT expression on the surface of 4T1 cells after different treatments. (E) Flow cytometric analysis and (F) quantification of CRT expression on the surface of 4T1 cells after various treatments (Mean ± SD, n = 3). *p < 0.05, **p < 0.01, ***p < 0.001, analyzed by one‐way ANOVA with Tukey's test.
FIGURE 5
FIGURE 5
In vivo antitumor efficacy of M‐RMH on a bilateral tumor‐bearing mice model. (A) Schematic illustration of experimental design in vivo. (B) Tumor growth curves, (C) representative photographs, and (D) average tumor weights of primary tumors in mice after the treatment with PBS, RMH, M‐RMH, and M‐RMH + aPDL1, respectively (Mean ± SD, n = 4). (E) Tumor growth curves, (F) representative photographs, and (G) average tumor weights of distant tumors of mice after different treatments (Mean ± SD, n = 4). (H) H&E and (I) TUNEL staining of primary tumors after different treatments. *p < 0.05, **p < 0.01, ***p < 0.001, analyzed by one‐way ANOVA with Tukey's test.
FIGURE 6
FIGURE 6
Immune responses elicited by M‐RMH on a bilateral tumor‐bearing mice model. (A) Immunofluorescence images of tumor sections after CRT staining after different treatments. (B) Representative flow cytometry analysis and (C) quantification of matured DC (CD80+CD86+, gated on CD11c+ DCs) in lymph nodes after different treatments (Mean ± SD, n = 3). (D) Representative flow cytometry analysis of CD4+ and CD8+ T cells (gated on CD3+ T cells) in the primary tumors after various treatments. (E) Quantification of CD8+ T cells in the primary tumors after various treatments (Mean ± SD, n = 3). (F) Quantification analysis of CD8+ T cells in distant tumors after different treatments (Mean ± SD, n = 3). Cytokine levels of (G) TNF‐α, (H) IL‐6, and (I) IFN‐γ in the serum of mice after various treatments (Mean ± SD, n = 3). *p < 0.05, **p < 0.01,***p < 0.001, analyzed by one‐way ANOVA with Tukey's test.
FIGURE 7
FIGURE 7
Reversal of immunosuppression on a bilateral tumor‐bearing mice model. (A) Immunofluorescence assay showing HIF‐1α expression in primary tumor tissues from mice after different treatments. (B) Representative flow cytometry analysis of M1 (CD11b+F4/80+CD86+) and M2 macrophages (CD11b+F4/80+CD206+) in primary tumors after various treatments. Quantification analysis of (C) M1 (CD11b+F4/80+CD86+) and (D) M2 macrophages (CD11b+F4/80+CD206+) in primary tumors. (E) Quantification of Tregs (CD3+CD4+Foxp3+) in primary tumors after different treatments. *p < 0.05, **p < 0.01, ***p < 0.001, analyzed by one‐way ANOVA with Tukey's test.

References

    1. Yu L., Hu P., Chen Y., Adv. Mater. 2018, 30, 1801964. - PubMed
    1. Wang Y., Yang T., He Q., Natl. Sci. Rev. 2020, 7, 1485. - PMC - PubMed
    1. Wegiel B., Gallo D., Csizmadia E., Harris C., Belcher J., Vercellotti G. M., Penacho N., Seth P., Sukhatme V., Ahmed A., Pandolfi P. P., Helczynski L., Bjartell A., Persson J. L., Otterbein L. E., Cancer Res. 2013, 73, 7009. - PMC - PubMed
    1. Dai Q., Wang L., Ren E., Chen H., Gao X., Cheng H., An Y., Chu C., Liu G., Angew. Chem., Int. Ed. 2022, 61, 202211674. - PubMed
    1. Yan H., Du J., Zhu S., Nie G., Zhang H., Gu Z., Zhao Y., Small 2019, 15, 1904382. - PubMed

LinkOut - more resources